

Abstract
We present a refinement of the backbone torsion parameters ε and ζ of the Cornell et al. AMBER force field for DNA simulations. The new parameters, denoted as εζOL1, were derived from quantum-mechanical calculations with inclusion of conformation-dependent solvation effects according to the recently reported methodology (J. Chem. Theory Comput. 2012, 7(9), 2886-2902). The performance of the refined parameters was analyzed by means of extended molecular dynamics (MD) simulations for several representative systems. The results showed that the εζOL1 refinement improves the backbone description of B-DNA double helices and G-DNA stem. In B-DNA simulations, we observed an average increase of the helical twist and narrowing of the major groove, thus achieving better agreement with X-ray and solution NMR data. The balance between populations of BI and BII backbone substates was shifted towards the BII state, in better agreement with ensemble-refined solution experimental results. Furthermore, the refined parameters decreased the backbone RMS deviations in B-DNA MD simulations. In the antiparallel guanine quadruplex (G-DNA) the εζOL1 modification improved the description of non-canonical α/γ backbone substates, which were shown to be coupled to the ε/ζ torsion potential. Thus, the refinement is suggested as a possible alternative to the current ε/ζ torsion potential, which may enable more accurate modeling of nucleic acids. However, long-term testing is recommended before its routine application in DNA simulations.
Introduction
Torsion parameters are critical components in empirical force fields for biomolecular systems. Because they affect conformational equilibria and since rather modest changes have a significant influence on the populations, they are relevant to all processes involving conformational changes. Nucleic acids (NAs) structures are an example of molecules in which the conformational state is of particular importance. The equilibrium between BI/BII substates or A/B and B/Z forms determines properties of DNA duplex and the myriad of noncanonical RNA motifs is essential for its biological function. Therefore, accurate modeling of the torsion potentials is one of the main concerns in biomolecular simulations.
Torsion parameters are the most frequently revisited components of NA force fields.1-8 This is not surprising, particularly as their effects are cumulative in polynucleotides, where even apparently minor inaccuracies may have major effects on populations of different structural forms, leading to artefactual geometries and incorrect estimates of free energy differences between conformational states.9 Moreover, many trajectory instabilities have been detected in simulations of noncanonical DNA and RNA molecules on long timescales (available due to GPU computing),10-13 which have often been ascribed to inaccuracies in torsion potentials. Clearly, further refinement of the torsion potentials of current empirical force fields for NAs is needed.
Optimization of torsion potentials often involves fitting to the torsional energy derived from QM calculations. A recent example is the bsc0 refinement of α/γ torsions in the AMBER Cornell et al.14 force field by Pérez et al.,1 intended to remove accumulation of undesirable flipped α/γ = g+/trans states that lead to irreversible degradation of DNA duplexes on a timescale of tens of nanoseconds. The bsc0 correction stabilizes simulations of DNA duplexes on (at least) the microsecond timescale and is also beneficial for RNA simulations.3, 15 However, even with bsc0, problems persist in simulations of B-DNA structures. For instance, average twist is usually underestimated compared to experimental data.16 This is not a trivial issue because errors in twist are cumulative with increasing sequence length and underwound duplexes may represent a potential problem in modeling the geometry of nucleosomal or circular DNA.17 In addition, the size of the major groove is probably overestimated,16 which may affect accurate modeling of major groove binding processes. Another problem is the description of single-strand loop geometries of guanine quadruplex DNA (G-DNA).18, 19 Finally, the balance between BI and BII substates in B-DNA also appears to be imperfect (see discussion below).8
Most of the current generation of QM-derived torsion profiles were obtained by fitting to QM energies obtained in vacuo, and the resulting parameters were then used in MD simulations performed in explicit or implicit solvent. However, the transferability of gas-phase derived parameters to explicit solvent simulations may be limited due to the neglect of certain conformation-dependent solvation effects. Thus, we recently suggested a procedure to incorporate these effects into the torsion parameters20 (see Eq. 1 in Methods, and ref. 3 for full details). This procedure was first used to refine parameters for the glycosidic torsion in RNA, known as χOL3 parameters (initially referred to as χOL3, 10 noting that the parameters reported by Zgarbova et al. were first made available in a test study by Banas et al.10). Our main motivation was to correct large-scale degradation of RNA systems into the so-called ladder-like structures described first by Mlynsky et al.11 in 2010. For some RNA systems, ladder-like structures emerge in ff99bsc0 and ff99 simulations on a timescale of tens to hundreds of nanoseconds. They are always irreversible and render the remaining part of the simulations meaningless. Our χOL3 parameters allowed stable simulations of various types of RNA systems, including hairpin tetraloops,10 RNA duplexes,3 reverse kink-turns12 and riboswitches.12 The correction by Zgarbova et al.3 is now the default AMBER RNA force field available in the ff10 and ff12 AMBER21 sets of force fields. Note that the glycosidic torsion is particularly difficult to fine-tune, as evident by the frequent refinement attempts in AMBER14, 22, 2, 4, 3, 13 and also CHARMM force fields.7, 23 Inclusion of the conformation-dependent solvation effects in χOL3 proved to be essential for obtaining stable simulations of RNA, as opposed to the parameters obtained in vacuo.20
Since the χOL3 correction is not suitable for DNA, we used the same solvation-dependent methodology3 to derive the χOL4 correction of the glycosidic torsion potential for DNA simulations.13 The χOL4 refinement was intended to improve the description of the rarely populated syn region (χ ~ 75°), while preserving the ff99bsc0 behavior in the preferentially populated high-anti (χ ~ 250°) region. It was shown to be beneficial mainly for antiparallel G-DNA stems containing guanine residues in the syn state because it stabilizes some of the experimentally observed noncanonical α/γ backbone conformational substates, which are native in these molecules.13
In the present work, we employed the same methodology to refine the ε and ζ torsions of the DNA sugar-phosphate backbone (Figure 1). These torsions exhibit some of the largest structural variabilities among the backbone angles in NAs.24 Their potential energy surfaces display multiple accessible minima, which have been confirmed by experimental X-ray and NMR structures. For instance, in RNA, the rare ε/ζ states are frequently found in loop regions, such as tetraloops, the S-turn in sarcin-ricin loop, etc. It appears that freedom in choosing the ε/ζ dihedral value facilitates backbone bending and stabilization of the rich variety of structurally and functionally important non-canonical RNA structures.
Figure 1.
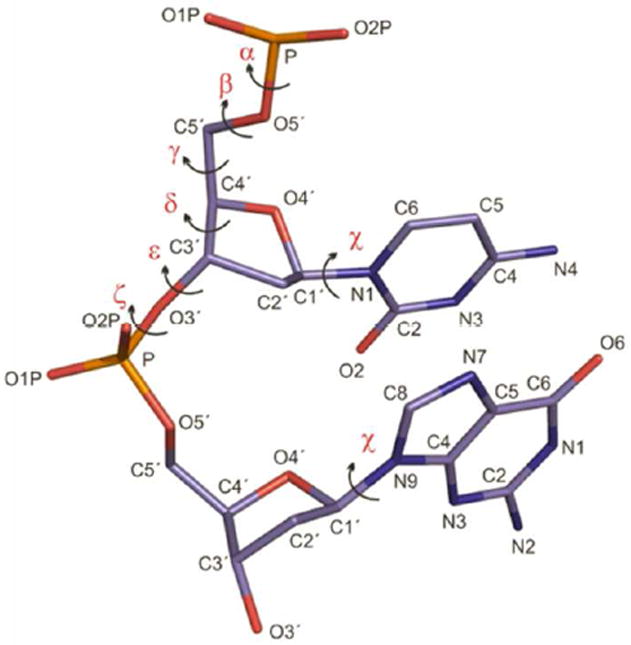
Torsions in nucleic acid backbone. ε torsion is defined as C4’-C3’-O3’-P and ζ is defined as C3’-O3’-P-O5’.
Our main interest in this study was the DNA molecule, in particular the B-DNA duplex. Two highly correlated ε/ζ states are commonly found in DNA: the canonical and dominant ε/ζ = trans/g- BI state and a minor, but still important, ε/ζ = g-/trans BII state25, 26 (both states are depicted in Supporting Information, Figure S1). For instance, the fraction of BII states in the Dickerson-Drew (DD) dodecamer in solution was found to be around 20% by a combination of different experiments.27 The BI/BII equilibrium deserves attention due to its involvement in NA recognition by proteins.28 In addition, the population of BII states has a pronounced effect on the helical parameters of the duplex and their sequence-dependence;29 the BII.BII steps exhibit more uniform distributions of the backbone angles and helical parameters, and they have negative roll, increased twist and sugar pucker closer to the north conformation. Thus, when the BI/BII relative populations are not modeled correctly, the ensemble of B-DNA structures may be inaccurate, which may impair predictions regarding DNA interactions with other molecules, such as groove binders or proteins.
Experimental studies have indicated that the propensity to populate the BII state is to a certain extent similar in NMR structures determined in solution and X-ray structures.30, 31 BII states can be found at any position in the sugar-phosphate backbone, although their occurrence depends on a base step.30 While some steps are conducive to the BII state (YpR, GpR and GpC, where Y stands for pyrimidine and R for purine), in other steps, the BI state is dominant.30 The nature of counterions (Na+ vs. K+) might also modulate the population of BI/BII states, although the observed variations are relatively small.32 Theoretical studies have suggested that when multiple BII flips occur, their local populations are correlated.33, 34 Existence of a BII state in one strand increases the probability of finding another BII state opposite the given base step, thus promoting formation of BII.BII steps. In contrast, the presence of a BII state lowers the probability of finding another BII state in neighboring steps.33, 34 Thus, the overall trends of sequence-dependent BI/BII conformational properties are fairly complex.
The experimental characterization of BI/BII thermodynamics in solution is not straightforward. Most of the experimental insight to date has been obtained from 31P-NMR experiments,30, 35, 31, 34 which rely on empirical correlation between the chemical shift of phosphorus (δP) and %BII established by Gorenstein and Kar35 (see also ref. 24). This approach assumes that δP in the BI (δP/BI) and BII (δP/BII) states are sequence-independent and that δP depends only on the BI/BII population. However, recent theoretical work of Precechtelova et al. has suggested that δP/BI and δP/BII in fact exhibit substantial sequence dependence.36 Sequence-dependence of δP can arise when the base pair steps differ in their helical geometry and average values of α, ε and ζ torsions. Note that the actual values of the α torsion may influence δP as well.37, 38 Thus, sequence effects may significantly alter BI/BII populations calculated from measured 31P-NMR shifts. This could explain the discrepancies between the BII populations reported for the DD dodecamer in some NMR experiments30, 39 and the values reported by Schwieters and Clore.27 It should be noted that Schwieters and Clore used ensemble refinement to obtain BII population estimates from a very rich NMR data set and large-angle X-ray scattering data without making any assumptions about correlations between δP and BI/BII populations.
Unfortunately, the BI/BII equilibrium is still not well described by the ff99bsc0 force field.34 In the CHARMM force field, a recent readjustment of the ε, ζ and sugar pucker parameters (included in CHARMM36) aimed mainly at increasing the BII fraction, which was heavily underestimated in CHARMM27. This modification significantly increased the BII populations, however, for most base steps they are still somewhat lower than those obtained from NMR experiment.8 Another reparametrization of the ff99bsc0 force field has been published recently,5 which was designed to improve the description of RNA structures. In the ff99bsc0 version of the Cornell et al. force field, BII populations appear to be underestimated in many base pair steps, except the GA step, in which it is probably overestimated (see below and refs 8 and 34). This indicates that ε and ζ torsion parameters in ff99bsc0, which remain the same as in the original ff94 parametrization, may be improved by readjustment.
Finally, another reason for considering readjustment of the ε/ζ backbone torsions is that the overall description of the DNA backbone in MD simulations is still imperfect. Notably, B-DNA structures simulated by MD simulations exhibit rather large root mean square deviation (RMSD) with respect to the X-ray or NMR reference (e.g., around 1.7 Å for the DD dodecamer with ff99bsc0 in this study). This contrasts with significantly smaller MD vs. X-ray RMSDs in RNA backbones (e.g., 1.1 Å for 1QC0 with ff99bsc0χOL3 in this study).
The ε/ζ reparametrization presented here is based on high-level QM calculations performed on model compounds. A key element distinguishing our method from other efforts is the inclusion of certain previously neglected solvation effects into the torsion parameters.3 The solvation correction relies on the difference between QM/SCRF and MM/PB solvation energies and takes account of both the solute-solvent polarization and conformation dependence of the solvent response to conformation-dependent charges, while avoiding double counting any component of the solvation energy. The refined ε/ζ parameters, εζOL1 (named after the city of Olomouc, parametrization version 1) were tested for their effect on the helical parameters of the canonical B-DNA DD dodecamer, especially regarding the twist and influence on the BI/BII equilibrium. Tests were also performed on other DNA structures, including G-DNA and Z-DNA. Although the main purpose of our paper is to report the derived parameters, the preliminary testing demonstrated the promising performance of the εζOL1 parameters.
Methods
Derivation of ε and ζ Parameters
The εζOL1 parameters were derived from high-quality QM profiles with inclusion of solvation effects through Eq. 1, in which the QM/COSMO and MM/PB single point energies are obtained on geometries optimized at QM/COSMO and MM/PB levels (see refs. 3 and 20 for details and justification of this methodology).
| Eq. 1 |
All calculations were performed on the deoxyribose model with the 5’-OH group replaced by a hydrogen atom and a methylphosphate attached to its 3’-oxygen (Fig. 2).
Figure 2.

Model structure used for derivation of the ε and ζ parameters.
The starting structures were optimized at the PBE/6-311++G(3df,3pd) (PBE/LP hereafter) level with the COSMO40 solvent model (default scaled Bondi radii, scaling factor 1.17) and with εr = 78.4. QM single-point calculations were then performed at the MP2/CBS level. MP2 energies were determined with the RI approximation. Complete basis set (CBS) extrapolations were obtained according to the scheme of Helgaker and Halkier41, 42 (HF and MP2 energies were extrapolated separately) using cc-pVTZ and cc-pVQZ basis sets. The in-vacuo MP2/CBS energy was combined with the solvation energy obtained from the PBE/LP/COSMO calculations. All QM calculations were performed using TurboMole 5.10.43, 44 MM optimizations were performed with default ff99bsc0 parameters and atomic charges and Gaussian 0345 using the “external” function and an in-house script linking Gaussian to the sander module of AMBER 9.46 In sander, a Poisson-Boltzmann (PB)47, 48 continuum solvent was used. The grid spacing was set to 0.1 Å, and default radii47, 48 and εr = 78.4 were used.
Several constraints were applied in both the MM and QM relaxed scans. The C4’-O4-C1’-C2’ and C1’-C2’-C3’-C4’ torsions were constrained at their fully relaxed PBE/LP/COSMO values to keep the sugar pucker close to the C2’-endo conformation (pseudorotation angle 161°). The C4’-C3’-O3’-P (ε angle) and C3’-O3’-P-O5’ (ζ angle) torsions were scanned separately with 10° increments. Two scans were carried out for ε, one with ζ constrained to 270° (corresponding to BI), and the other with ζ constrained to 180° (corresponding to BII). Similarly, two scans were carried out for ζ, one with ε constrained to 180° (corresponding to BI), and the other with ε constrained to 270° (corresponding to BII). The partially constrained relaxations were performed at the PBE/LP/COSMO and MM/PB levels.
The dihedral contributions (Eq. 1) were fit for each angle ε and ζ separately. For ε, both curves (corresponding to BI and BII in ζ) were fit simultaneously, with double weights assigned to the points in proximity of the canonical BI and flipped BII regions (ε = 160–200° and ζ = 270°; ε = 250–290° and ζ = 180°) to improve the accuracy of the fit in these regions. Similarly, when fitting the ζ angle, double weights were assigned to regions ζ = 160–200° and ε = 270°, and ζ = 250–290° and ε = 180°. The final parameters are listed in Table S1 of the Supporting Information. Modified Amber force field files are also attached.
Molecular Dynamics Simulations
Several explicit solution MD simulations were carried out to validate the modified ε/ζ parameters in combination with the ff99bsc049, 1 force field. As well as detailed testing on the DD dodecamer d(CGCGAATTCGCG)250 (1 μs, initial structure PDB ID 1BNA with resolution 1.9 Å),50 test simulations were carried out on the Jun-Fos34 model (1 μs, initial structure prepared by nucgen module of AMBER51), d(CCCCCGGGGG)2 structure (1 μs, initial structure PDB ID 1ZF952 with resolution 1.38 Å), short A-tract d(CGCA3T3GCG)2 (1 μs, initial structures PDB ID 1S2R53 with resolution 1.53 Å), A-tract structure d(CGCGA6CG)2 (1 μs, initial structure PDB ID 1D8954 with resolution 2.30 Å), AT RICH sequence d(CGCATATATGCG)2 (1 μs, initial structure prepared by nucgen module of AMBER), antiparallel guanine quadruplex (G-DNA, 500 ns, initial structure PDB ID 2GWQ with resolution 2.00 Å ; the first molecule in the crystal lattice), and Z-DNA (400 ns, initial structure PDB ID 1ICK with resolution 0.95 Å,55 spermine and magnesium ion were not included). In addition, we ran a simulation for a short RNA duplex (500 ns, the decamer r(GCACCGUUGG)2 was excised from the PDB ID 1QC0, with a resolution of 1.55 Å,56 hereafter denoted 1QC0’) to investigate the applicability of our correction for modeling canonical A-RNA.
All simulations were carried out according to the following simulation protocol. The starting structures were either neutralized by Na+ ions or the ion concentration was adjusted to 0.15 M (Jun-Fos) or 2 M (Z-DNA and A-DNA prone sequences). In simulations without excess salt, we used Aqvist Na+ parameters57 and with excess salt, the Joung and Cheatham Na+ and Cl- ion parameters.58, 59 A TIP3P60 or SPC/E61 water box was used to solvate the molecular systems. Simulations were carried out with the pmemd code from the AMBER 1162 program suite under NPT conditions (1 bar, 298 K) with default temperature and pressure settings (tautp = 1.0 ps, taup = 1.0 ps), a 2 fs time step, a 9 Å direct space non-bonded cutoff and SHAKE on bonds to hydrogen atoms with default tolerance (0.00001 Å). The non-bonded pair list was updated every 25 steps. PME was used with default grid spacing (1 Å) and default tolerance (10-5). Coordinates were stored every 1 ps. PMEMD for CUDA was used for all simulations.63
Analyses were performed using X3DNA code,64 and conventions of Altona and Sundaralingam65 and El Hassan and Calladine66 were used to characterize sugar puckering and groove widths, respectively. If not stated otherwise, the last two terminal base pairs at each end were excluded from the analysis. Mass-weighted RMSD values were calculated with respect to the initial structure. Standard deviations in MD simulations of the DD dodecamer (Table 1) were calculated as follows. The trajectory was first split into 10-ns-long non-overlapping frames. Average values over each interval were calculated for each parameter separately (e.g., 11 twist averages per each interval in the DD dodecamer, etc.). Standard deviations for the whole trajectory were then calculated from all averages (see also ref. 15). Thus, the standard deviations shown in Table 1 mainly reflect the variance between different base pair steps in a given sequence. In contrast, when comparing the helical parameters obtained with different force fields, comparisons were made for each base pair step separately, leading to much smaller standard deviations and narrower confidence intervals (see Table S2 of the Supporting Information, 50 ns interval results are shown).
Table 1.
Average structural parameters (last 800 ns of 1 μs simulations) for the Dickerson-Drew dodecamer. The last two terminal base pairs at each end were excluded from the analysis. Analyzed using X3DNA code.64 Standard deviations were calculated as explained in the Methods section.
| X-raya (NMRb) | ff99bsc0 | ff99bsc0εζOL1 | |
|---|---|---|---|
| minor groove width/ Å | 9.9 (10.5) | 11.7 ± 0.8 | 11.1 ± 0.7 |
| major groove width/ Å | 18.0 (17.6) | 19.3 ± 0.7 | 18.6 ± 0.3 |
| χ/deg | -113.6 (-110.8) | -119.7 ± 8.9 | -115.6 ± 5.6 |
| α/deg | -63.5 (-61.6) | -70.4 ± 4.7 | -68.5 ± 3.7 |
| β/deg | 176.1 (173.5) | 174.0 ± 1.5 | 176.1 ± 1.6 |
| γ/deg | 52.9 (50.3) | 55.8 ± 2.2 | 55.3 ± 1.6 |
| δ/deg | 120.4 (126.7) | 119.4 ± 8.4 | 125.4 ± 6.4 |
| ε/deg | -181.5 (-171.6) | -173.5 ± 3.7 | -176.1 ± 4.5 |
| ζ/deg | -88.7 (-101.3) | -89.3 ± 3.5 | -92.8 ± 2.1 |
| P/deg | 130.0 (136.8) | 127.1 ± 14.4 | 138.0 ± 11.7 |
| tm/deg | 37.4 (33.4) | 37.6 ± 1.4 | 37.4 ± 1.2 |
| shift/ Å | 0.0 (0.0) | 0.0 ± 0.2 | 0.0 ± 0.2 |
| slide/ Å | -0.08 (-0.2) | -0.5 ± 0.3 | -0.4 ± 0.3 |
| rise/ Å | 3.3 (3.2) | 3.3 ± 0.1 | 3.3 ± 0.1 |
| tilt/deg | -0.3 (0.0) | -0.1 ± 1.6 | 0.0 ± 1.8 |
| roll/deg | 1.9 (3.0) | 3.6 ± 3.2 | 2.9 ± 3.0 |
| twist/deg | 33.6 (35.7) | 32.5 ± 3.7 | 34.3 ± 1.3 |
| shear/ Å | -0.0 (0.0) | 0.0 ± 0.1 | 0.0 ± 0.1 |
| buckle/deg | 1.2 (0.0) | -0.5 ± 4.7 | 0.1 ± 3.5 |
| stretch/ Å | 0.0 (-0.3) | -0.02 ± 0.03 | -0.03 ± 0.04 |
| propeller/deg | -11.4 (-17.5) | -12.0 ± 6.4 | -11.8 ± 5.7 |
| stagger/ Å | 0.1 (-0.1) | 0.0 ± 0.1 | 0.0 ± 0.1 |
| opening/deg | 1.8 (-1.1) | 0.2 ± 0.6 | 0.0 ± 0.5 |
| X-displacement/ Å | -0.5 (-0.8) | -1.7 ± 0.7 | -1.2 ± 0.2 |
| Y-displacement/ Å | -0.1 (0.0) | 0.0 ± 0.3 | 0.0 ± 0.3 |
| helical rise/ Å | 3.3 (3.2) | 3.2 ± 0.2 | 3.3 ± 0.1 |
| inclination/deg | 4.1 (5.0) | 7.4 ± 7.2 | 5.2 ± 5.3 |
| tip/deg | 0.6 (0.0) | 0.1 ± 3.0 | 0.0 ± 3.0 |
| helical twist/deg | 34.0 (36.1) | 33.7 ± 3.1 | 35.3 ± 1.2 |
| Number of flips/1ns | 49 | 231 | |
| %BII | 9.4 | 12.3 | |
| RMSD(all)/Åc | 1.71 (1.67b) | 1.43 (1.43b) | |
| RMSD(backbone)/Åc | 1.95 (1.9b) | 1.58 (1.58b) |
Average values from 1FQ2 crystal structures.
Average values from 1NAJ structures.
RMSD (mass-weighted) for all atoms and backbone calculated against 1BNA structure and 1FQ2 structure (in parenthesis). The last two terminal steps at each end were excluded from the calculation of RMSD.
Force Fields
Several Cornell et al.14 force field variants and combinations were used. The ff99 force field with bsc0 correction for α/γ torsions (ff99bsc0), which is currently the default force field assigned by AmberTools (e.g. ff10 or ff12), was used as a comparison for all DNA simulations. Reference RNA calculations were performed using the ff99bsc0 force field with χOL3 correction for the glycosidic torsion,3, 10 which has been adopted as the default force field for RNA simulations in AmberTools since 2011. The εζOL1 correction derived herein was used in combination with ff99bsc0 for all DNA simulations. In the case of G-DNA and Z-DNA, the χOL4 correction was also used, which has been shown to improve the description of syn residues.13 Finally, εζOL1 was combined with ff99bsc0χOL3 for the RNA simulation.
Results and Discussion
The εζOL1 Torsion Parameters
The torsion profiles for ε and ζ torsions are shown in Figure 3, which also displays the reference QM/COSMO results and energies derived from the standard ff99bsc0 force field. Note that all profiles include the respective solvation energy (QM/COSMO or MM/PB). Two scans are provided for each torsion: one with the second torsion constrained at its BI value (left panels), and the other with the second torsion constrained at its BII value (right panels).
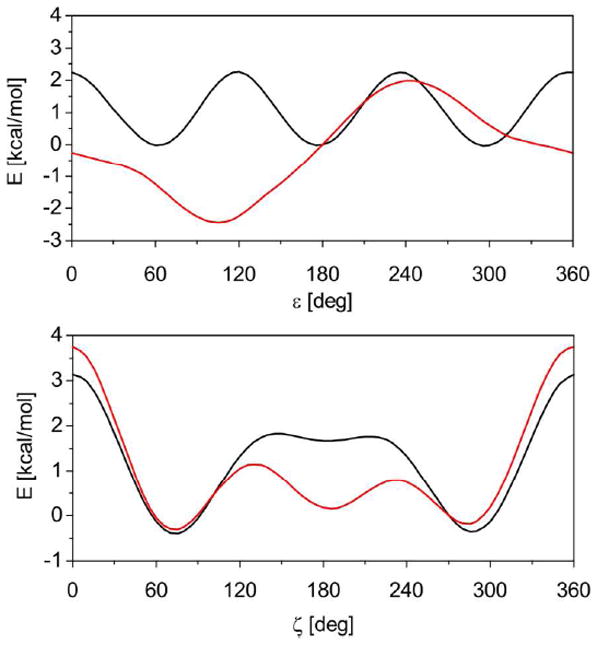
Figure 3.

Torsion profiles for ε and ζ dihedrals derived herein (εζOL1, red) compared with the reference MP2/CBS curves (green) and ff99bsc0 results (black). Solvation energies are included in both the QM and MM calculations (PBE/LP/COSMO and PB, respectively). The energies are offset to the canonical (BI) minimum. Two scans are provided for each torsion: one with the second torsion constrained at its BI value (left panels) and the other with the second torsion constrained at its BII value (right panels).
Figure 3 shows that ff99bsc0 (black curve) appears to overestimate the barrier between the BI and BII states and excessively destabilize the ε = g+ region. Compared to ff99bsc0, the εζOL1 correction follows the QM reference much more closely. However, the agreement is still not perfect due to the compromise of simultaneously fitting the two reference curves (see Methods). Also, the MM/PB curves exhibit some oscillations around the ζ = g+ region, which are mainly due to intramolecular contacts in the model molecule that cannot be easily avoided. Nevertheless, the εζOL1 parameters seem to improve the overall agreement with the QM surface compared to the original ff99bsc0 force field.
A distinct feature of the εζOL1 parameters is that they predict a smaller barrier between the BI and BII conformations than the original force field. This can be seen in Figures S2 and S3 of the Supporting Information, which compare QM and MM 2D maps of the ε/ζ energy landscape. The lower barriers predicted by the ff99bsc0εζOL1 force field are in good agreement with the QM results. As will be shown below, this leads to faster BI/BII transitions in MD simulations. Unfortunately, accurate experimental data for the kinetics of the BI/BII interconversion are not available. The transitions are not directly detectable on NMR timescale, but indirect estimates of the barrier height obtained from dynamical 31P-NMR spectra suggests barriers of 12-14 kcal/mol.39 However, such high barriers are inconsistent with other estimates in the literature.67, 68 Values of around 2 kcal/mol have been suggested by Foloppe and Mackerell based on QM calculations.68 As discussed previously, the continuous distribution of ε/ζ states that are intermediate between the BI and BII minima observed in X-ray structures (see discussion below) suggests that the barrier is quite low (a detailed discussion supporting low energy barriers of around 2 kcal/mol is given in ref. 8)
Although populations of the ε/ζ conformers can be affected by the local environment in the crystal as well as inaccuracies in structure determination, a rough (semi-quantitative) estimate of the barrier can then be derived from the X-ray dihedral distribution using the Boltzmann formula. Such an estimate of the energy profile from a subset of B-DNA structures taken from ref. 28 is shown in Figure S4 of the Supporting Information. The estimated barrier height is around 1.2 kcal/mol, corresponding to hundreds of ε/ζ transitions per nanosecond. It should be noted that these data were averaged over the values for different NA steps, which differ widely. Therefore they cannot be directly compared with the QM data presented above, which were obtained on a single small model molecule. Nevertheless, it appears that the barrier separating the BI and BII minima is actually very low. This is consistent with the very fast BI/BII transitions observed in our MD simulations (see below).
MD Simulations of the Dickerson-Drew Dodecamer
The DD dodecamer, d(CGCGAATTCGCG)2, is an excellent model for force field calibration because it is one of the most extensively studied DNA duplexes both experimentally and theoretically. This makes it easier to identify the most reliable experimental reference even when data from several sources are inconsistent. Still, great care must be taken when directly comparing simulation results to experimental data. In particular, B-DNA duplexes in solution should be described by a statistical ensemble, and therefore may not be well represented by a single structure, such as a single X-ray geometry.
It should be noted that comparison between simulation and experimental data for the DD dodecamer is complicated by so-called end effects, i.e., disruption and deformation of the terminal base pairs observed in MD simulations.69, 70 Disruption of the terminal base pairs may substantially affect the structure and dynamics of adjacent base pairs. Although fraying is observed to a certain extent in experimental studies, noncanonical structures widely occur in current simulations and seem to be sensitive to the force field choice.
As mentioned in the Introduction, ff99bsc0 provides a reasonably good description of the B-DNA structures, except for selected structural parameters, such as twist or groove widths, which are still somewhat inaccurate in this force field. Table 1 compares the structural parameters obtained from X-ray analysis of the DD dodecamer (1FQ271 crystal structure), NMR data16 and MD simulations using the standard εζ parameters in the ff99bsc0 force field and the modified εζOL1 parameters presented here (see also Figure S5 of the Supporting Information comparing distributions of backbone dihedral angles and sugar pucker). The structural parameters obtained with the εζOL1 modification are in good agreement with the experimental data. They mostly resemble the values obtained with the original force field, but in some respects the εζOL1 parameters perform better. First, the twist predicted with the modified parameters is on average higher and closer to both the X-ray and the solution NMR reference. The values of δ and sugar pucker pseudorotation phase are shifted from the X-ray reference, but are closer to the NMR data. A significant shift towards the X-ray values is apparent for the major groove width (NMR 17.6 Å; ff99bsc0 19.3 Å and εζOL1 18.6 Å), and to a lesser extent also for the minor groove width (NMR, 10.5 Å; ff99bsc0 11.7 Å and εζOL1 11.1 Å). With εζOL1, both values are also closer to the NMR values for the structures in solution.72, 73 The narrowing of the major groove width is important because it leads to better representation of the major-minor groove asymmetry.16 The overall improvement of the simulation is also demonstrated by the decreased RMSD value with εζOL1.
Fraying and End-Effects
As noted above, when comparing with experimental data, the formation of noncanonical structures at the ends of the DD dodecamer needs to be considered in MD simulations. These noncanonical structures start appearing within the first tens to hundreds of ns of the MD simulation, and some remain stable for hundreds of ns. Examples of two of the most common noncanonical end-structures, i.e., trans Watson-Creek/Sugar Edge pair, cis C-H Edge/Hoogsteen pair and stacked pair, are shown in Figure S6 of the Supporting Information. Because these structures were not reported by the NMR or X-ray experiments, we speculate that they may be a force field artifact. Unfortunately, they influence the geometry of neighboring base pairs; we will refer to this influence as an “end-effect” in the following. The two consecutive adjacent base pairs may be affected significantly (e.g., the twist of the second/penultimate base pair may change by several degrees) and sometimes even the third and fourth step may be affected due to protrusion of the fraying terminal cytosine into the major groove. Thus, the two terminal base pairs are almost always affected (the trans WC/sugar edge structure was observed in nearly all our trajectories), and the third and fourth base pair may be influenced depending on whether the relatively rare interaction of the terminal cytosine in the major groove occurs in the particular simulation. The end-effects are present in all simulations. In ff99bsc0, the above mentioned non-canonical structures interconvert on a timescale of tens to hundreds of nanoseconds (without returning to the original WC pairing), whereas in the ff99bsc0εζOL1 simulation, the trans WC/sugar edge structure forms after 100-300 ns and remains stable for the rest of the simulation. Thus, convergence of the averaged characteristic of the duplex appears to be faster with ff99bsc0εζOL1, however further exploration and longer simulation is necessary to fully assess the force field influences on the terminal base pairs. Because the end-effects complicated the results for the pairs near the helix ends, we generally omitted two terminal base pairs at each end from our analyses.
Base Pair and Base Pair Step Parameters
Figure 5 shows distributions of selected base pair and base pair step parameters for the DD dodecamer using the original and modified force fields. Populations were compared with the available experimental data: X-ray data were obtained from the DD structure with the best available resolution (PDB code 1FQ271), and NMR data were for the DD structure with PDB code 1NAJ73 (average). Most parameters exhibited very similar distributions for both the original and the modified force fields (see also the average values in Table 1). This indicates that the εζOL1 parameters do not radically change the dynamical structure of the simulated duplex but rather fine-tune some of its characteristics. However, an important change is the mentioned increase in the average twist value. This increase is highly desirable because underestimation of twist has been highlighted as one of the remaining drawbacks of the ff99bsc0 force field.16 Note that compared to X-ray data, the εζOL1 parameters seem to overestimate helical twist, whereas compared to NMR results, it is still slightly underestimated.
Figure 5.

Base pair and base pair step parameters for ff99bsc0 (black) and ff99bsc0εζOL1 (red) parametrizations. Histograms from MD simulation (last 800 ns of 1 μs simulation) are compared with X-ray (blue) and NMR (green) averages. The last two terminal base pairs at each end were excluded from the analysis.
Further information can be extracted from the sequence dependence of twist. Figure 6 shows results for each individual base pair step from ff99bsc0 (black) and ff99bsc0εζOL1 simulations (red). It also shows X-ray values71 and NMR data from two sources73,27 (ensemble size Ne = 4 was chosen, see ref. 27). Note that the twist values obtained from the MD simulations are not fully symmetric around the central step, in contrast to our expectations for a palindromic sequence. We traced this asymmetry to the end effects of the long-living noncanonical structures found commonly at the helix termini in B-DNA MD simulations (see above and ref. 70). Convergence of twist was checked for each base pair separately. Although convergence was slow for the two terminal base pair steps, it was relatively fast for the seven inner steps (see Supporting Information, Table S2). This is consistent with the findings of Dans et al., who suggested that helical parameters are well converged in the DD dodecamer after 300 ns.74 Interestingly, the twist values were also not symmetric around the centre of the sequence in the X-ray reference. This could be explained by the effect of crystal packing and ions,73 as discussed in several earlier works.70, 73, 71 Clearly, the NMR results are more relevant than the X-ray data when comparing geometries in solution, and hence we used them preferentially in our comparisons.
Figure 6.
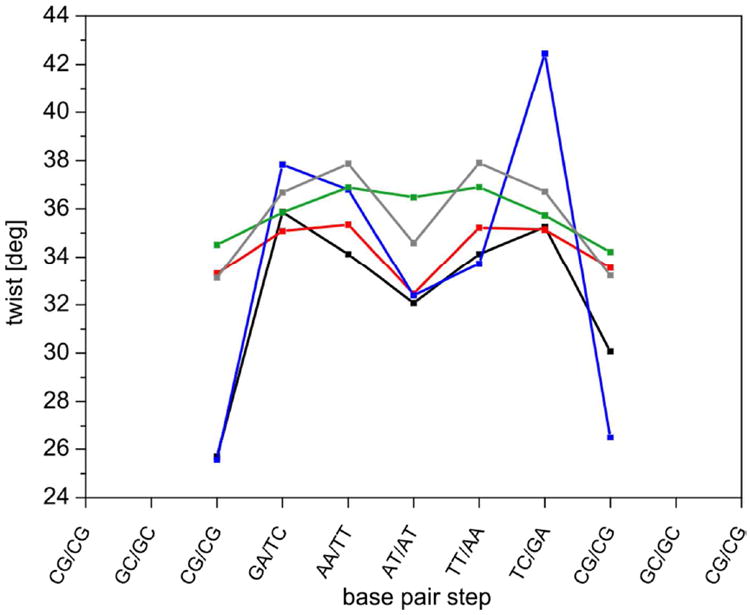
Twist values for individual base pair steps in the DD dodecamer. MD simulations with ff99bsc0 (black) and ff99bsc0εζOL (red) are compared with X-ray data (blue, 1FQ2), ensemble-refined NMR data27 (green) and NMR data with standard refinement72 (gray, average from 1NAJ structure). The last 800 ns of the 1 μs simulations were averaged and the last two terminal base pairs at each end were excluded from the analysis.
Comparing the twist extracted from the MD simulations using the εζOL1 refinement (last 800 ns of 1 μs trajectory) with the ensemble-refined NMR reference, it can be seen that the sequence dependence was reproduced quite well, except for the middle ApT step, where both force fields notably underestimated twist. The εζOL1 simulation was in closer agreement with the data by Schwieters and Clore than with the NMR data from 1NAJ. This is encouraging because the reference of Schwieters and Clore is probably most appropriate as discussed above. The εζOL1 simulation also better modeled the sequence dependence of the twist than the original force field. The average increase of the twist value in εζOL1 was about 1° for the seven middle base pair steps. A slight reduction of twist was observed in the two GA steps, but this is acceptable because the twist value is still very close to experimental values. Note also that the new parameters reduce the asymmetry of the simulated sequence dependence. In conclusion, the overall description of the twist sequence dependence seems to be better with the εζOL1 refinement than with the original ff99bsc0 force field.
Another parameter in MD simulations that is tightly bound to the ε/ζ potential is the population of BI/BII substates. Convergence of the BI populations in our 1 μs simulation of the DD dodecamer is shown in Figure S7 of the Supporting Information for each base pair step separately (both ff99bsc0 and ff99bsc0εζOL1). Whereas for some base pair steps, the populations converged relatively rapidly (within tens of ns), in other cases, they converged very slowly (on a timescale of about 200 - 300 ns). The lifetimes of the BII substates in the inner seven base steps varied over a relatively wide range (5 to 80 ps for ff99bsc0 and 1 to 16 ps for ff99bsc0εζOL1; time series for both force fields are shown in Figures S8 and S9 of the Supporting Information). The shorter lifetimes obtained with the εζOL1 modification are consistent with the predicted lower barrier height (see above). On the other hand, the lifetimes of the outer two base steps, which exhibited a high propensity for the BII state, were substantially longer (tens to hundreds of picoseconds). This explains the relatively fast convergence of the BII populations for the inner base steps compared to the much slower convergence for the steps near the end of the helix. Another factor contributing to the very slow dynamics of the end pairs is formation of the noncanonical end-structures, which also affects the BI/BII equilibrium of the neighboring bases.
Figure 7 compares the distributions of the ε and ζ dihedral angles found in the X-ray databases (determined for noncomplexed B-DNA structures only, taken from ref. 28) with those obtained from MD simulations with ff99bsc0 and εζOL1 parameters (from the last 800 ns of 1 μs trajectory). Regarding the shape, the distributions obtained with the εζOL1 parameters were slightly closer to the X-ray reference than the original ff99bsc0 ones, mainly for the BII state of ζ. The population in the regions between the BI and BII states was slightly increased, in agreement with the X-ray data and lower barriers predicted by εζOL1. Note, however, that the results are not quantitatively comparable, because the X-ray data encompass a wide variety of base-pair step compositions, whereas our data were obtained for a specific sequence.
Figure 7.

Distributions of ε and ζ conformations observed in X-ray crystal structures28 (blue) and MD simulations with ff99bsc0εζOL1 (red) and ff99bsc0 (black) force fields. Data were derived from the last 800 ns of 1 μs simulations of DD dodecamer, excluding the last two terminal base pairs at each end.
Sequence-specific data for the BI/BII preferences in the DD dodecamer structure are shown in Figure 8, together with experimental NMR data39,27 and X-ray data extracted for the B-form subset of structures.28 For the MD simulations, the BII fraction was averaged over the two strands. Again, caution is required when comparing the populations extracted from MD simulations with the X-ray results because the latter represent an average over a database of B-DNA crystal structures. For most base pair steps, the X-ray survey indicated a much lower BII populations than the NMR data. However, this can be explained by the different environment in the crystal, such as ions present in the crystal structure.73 Also, BII populations tend to increase with temperature75 and X-ray measurements are often performed at low temperatures. In addition, Pichler et al. have suggested that the BII state is more populated in hydrated nonoriented films than in the crystal.75 Thus, NMR data is probably a better reference than X-ray data for simulations carried out in solution. The NMR data shown here are quantitatively comparable, but there is a notable disagreement between the two experiments. As discussed in the Introduction, the data of Schwieters and Clore27 was selected as the most appropriate reference because they do not make any assumptions about correlations between δP and BI/BII populations.
Figure 8.

Comparison of the BII fraction for different base steps in the DD dodecamer. Average over the last 800 ns of 1 μs MD simulations (averaged over both strands) with ff99bsc0 (black) and ff99bsc0εζOL1(red) compared with X-ray30 (blue) and NMR (grey, Tian et al.39; green, Schwieters and Clore27, Ne = 8). The last two terminal base pair steps at each end were excluded from the analysis. Note that the X-ray data represent an average over a set of B-DNA database structures and are thus not quantitatively comparable.
Figure 8 shows that the results obtained with the εζOL1 correction closely follow the pattern of the experimental data by Schwieters and Clore25. For most base pair steps, the new parameters predicted higher BII populations than the original force field, leading to an overall increase of the BII percentage from about 9% with ff99bsc0 to about 12% with ff99bsc0εζOL1 for the seven inner base pair steps. However, compared to the NMR reference (22% BII for the seven inner base pair steps), the BII populations are still underestimated. Nevertheless, the εζOL1 correction provided an overall better description of the sequence dependence and average BII populations in the DD dodecamer than the original force field. As we will show below, yet larger improvements may be obtained for other sequences.
Although we could have tried to stabilize the BII state further by empirical modification of the ε/ζ parameters, we chose not to do so. One of the reasons was that BII propensities are not determined solely by the ε and ζ parameters, but other force field torsions might contribute too. This was shown by Hart et al.,8 who modified also one of the torsions involved in sugar pucker, achieving yet better agreement with experiment (comparison with data from the work of Hart et al. are given in Figures S10 and S11 of the Supporting Information). Therefore, instead of attempting empirical modification of the ε/ζ parameters we decided to keep to the QM data fit in the present study, noting that further improvements may be attempted by reparameterizing other force field components.
Backbone RMSD
RMSD of the simulated structure is one of the most frequently used indicators of the force field quality and simulation stability. RMSD is usually calculated with respect to a reference structure (X-ray, NMR) and low values generally indicate good force field behavior, provided that the structure does not undergo large natural conformational changes on the timescale of the MD run. For rigid molecules and an ideal force field, RMSD values of MD snapshots are expected to be around 1 Å due to thermal fluctuations. However, real simulations usually exhibit significantly higher values, which may be ascribed mainly to three factors. First, some NAs in solution are not well represented by a single structure, as exemplified by the rapidly interconverting BI and BII states in B-DNA. Second, a large RMSD may reflect differences between the X-ray and solution structures when X-ray data are taken as a reference for RMSD calculations. Third, a high RMSD may stem from force field inaccuracies. To help distinguishing between these three types of deviations we considered several different structures as a reference in the RMSD calculations.
Table 2 compares the RMSD values averaged over the MD simulations of the DD dodecamer and RNA decamer 1QC0’, which were calculated with respect to different reference structures (X-ray, NMR or MD average; the average MD structure was obtained by averaging over the last 800 ns of a 1 μs trajectory). The force fields used were ff99bsc0 for DNA and ff99bsc0 with χOL3 correction3, 10 (denoted as ff99bsc0χOL3) for RNA. The values in the first row are average RMSDs calculated with respect to the average MD structure. The average MD structure reflects the force field inaccuracies expressed in the simulation (and, in B-DNA, also the average BI/BII conformational equilibrium). Thus, the RMSD value calculated with respect to this structure gives information about thermal fluctuations of the system (and, in B-DNA, also fluctuations due to the BI/BII switching). For RNA, the relatively small value of 0.85 Å (ff99bsc0χOL3) is in agreement with the known stiffness of the A-RNA duplex76, 77 and suggests that the dynamical structure may be well represented by a single average geometry. On the other hand, the relatively large value of 1.13 Å for DNA (ff99bsc0) reflects the greater flexibility of the DNA helix16, 76-78 and confirms that DNA is probably better represented by an ensemble of structures.27, 79
Table 2.
RMSD values of the DD DNA dodecamer and 1QC0’ RNA duplex calculated for backbone and all atoms using AMBER force fields over the last 800 ns of 1 μs MD simulations. The RMSD is mass-weighted and the last two terminal base pair steps at each end were excluded from the analysis.
| DNA | ||||
|---|---|---|---|---|
|
| ||||
| RMSD calculated with respect to | ff99bsc0 | ff99bsc0εζOL1 | ||
| all atoms | backbone | all atoms | backbone | |
| MD average | 1.13 | 1.25 | 1.07 | 1.17 |
| X-ray (1BNA) | 1.71 | 1.95 | 1.43 | 1.58 |
| X-ray (355D) | 1.69 | 1.93 | 1.44 | 1.59 |
| X-ray (1FQ2) | 1.67 | 1.91 | 1.43 | 1.58 |
| NMR (1NAJ) | 1.64 | 1.93 | 1.32 | 1.49 |
|
| ||||
| RNA | ||||
|
| ||||
| ff99bsc0χOL3 | ||||
| all atoms | backbone | |||
| MD average | 0.86 | 0.87 | ||
| X-ray (1QC0’) | 1.09 | 1.12 | ||
It is not surprising that the average RMSD calculated with respect to the experimental structure is higher than that calculated with respect to the MD average structure. For the RNA duplex, it increased from 0.86 Å to 1.09 Å, i.e., by about 0.23 Å, which is a modest increase. However, for DNA, this increase was substantially larger (by about 0.6 Å) when either X-ray or NMR structures were used as reference. This suggests that the f99bsc0 force field provides a rather inaccurate description of the B-DNA duplex, at least comparative to that for the 1QC0’A-RNA duplex. When ff99bsc0 was combined with the εζOL1 correction, RMSD decreased from 1.64 Å to 1.32 Å for all atoms and from 1.93 Å to 1.49 Å for the backbone (1NAJ structure). Hence, it seems that the εζOL1 refinement improves the structural description of the B-DNA duplex.
α/γ Backbone Substates
In the simulations of the DD dodecamer, we also monitored the α/γ backbone substates. The population of the noncanonical α/γ = g+/trans substates was less than 0.2% over the 1 μs simulation for both the ff99bsc0 and ff99bsc0εζOL1 force fields (the last two terminal base pair steps at each end were excluded from the analysis). Accumulation of the noncanonical substates over time was not observed with either force field.
DD Dodecamer in SPC/E Water Model
The choice of explicit water model may have nonnegligible impact on the predicted structure of nucleic acids (see, e.g., ref. 15). In the present work, we focused on the TIP3P model as it is the most widely used and best tested explicit solvent for MD simulations of nucleic acids. To confirm that our refinement provides comparable results with another widely used solvent model, we also carried out 0.5 μs MD simulations of the DD dodecamer in SPC/E58 water. The average structural parameters for the ff99bsc0εζOL1 force field in TIP3P and SPC/E water are compared in the Supporting Information, Table S3. Only minor differences in the structural characteristics of the DD dodecamer due to water model were observed. The most pronounced differences included a slight increase of twist (35.9° in SPC/E, 35.3° in TIP3P) and slight decrease of the major groove width (18.1° in SPC/E, 18.6° in TIP3P). These differences shifted the MD results closer to the NMR reference in SPC/E water. Interestingly, changing the water model did not affect the frequency of ε/ζ flipping (Table S3). However, SPC/E seemed to slightly stabilize the BII state as its population increased from 12.0% in TIP3P to 15.6% in SPC/E, in better agreement with the higher BII fractions observed in experiment (see Figure 8). In conclusion, the overall description of the DD dodecamer does not seem to be strongly affected by the choice of water model, and the results show that the newly derived parameters can be used with both the TIP3P and SPC/E models.
Twist and BII Populations in Other DNA Duplexes
Because twist and BII populations are known to be sequence-dependent, we performed additional simulations of some characteristic DNA duplexes. Due to computer time limitations, we chose the following five sequences: the Jun-Fos model, known for the high propensity of some steps for the BII substate, and duplexes containing a short A-tract, d(CGCA3T3GCG)2, another A-tract with sequence CGCGAAAAAACG, alternating AT rich sequence d(CGCATATATGCG)2 and a GC rich duplex d(CCCCCGGGGG)2 that crystallizes in A-DNA form.
Validation of the MD simulations is generally complicated by the lack of reliable experimental data. As illustrated above for DD dodecamer, the use of X-ray data may be problematic, mainly due to packing effects. NMR solution measurements are in principle more relevant, but high quality NMR experiments providing a sufficient number of accurate restraints are still scarce. In addition, the results of previous in-solution experiments have largely been interpreted by considering a single representative structure. More advanced ensemble-based representations are very rare. Furthermore, twist and BII percentages have been shown to be strongly influenced by the nearest neighbors.80 For instance, twist in the CG/CG step can vary by more than 15° depending on the neighboring base pairs. Also, the effect of next-nearest neighbors is often not negligible.80 Thus, direct comparison of individual steps in two different sequences is not possible. Instead, twist values should be compared in the same context, including the nearest neighbors, and if possible, the next-nearest neighbors. This fact, combined with the limited quality of reference data means that most of our comparisons could only be semi-quantitative.
Bearing these limitations in mind, we can try to assess the performance of the original ff99bsc0 force field. Based on a database analysis of X-ray data, twist has been suggested to be on average underestimated in MD simulations with the ff99bsc0 force field.16 According to data published in a detailed study by Dans et al.74, the performance of ff99bsc0 is sequence dependent (see Table S3 in the Supporting Information of ref. 74). Whereas the twist is underestimated in some base pair steps (TA, CA and to a lesser extent CG and CC steps), it seems overestimated in the AG step. BII populations are likely to be underestimated in ff99bsc0 simulations, except for the GA step, in which they are probably overestimated8 (note that only a subset of all possible steps was analyzed in this study). However, these conclusions assume an empirical relationship between 31P NMR chemical shift and %BII, which may be inaccurate, as discussed in the Introduction.
By comparing the results of the ff99bsc0 and ff99bsc0εζOL1 simulations, we examined whether the ε/ζ refinement provided any improvement regarding the above described deficiencies. Figure 9 compares twist values and BII percentages for five sequences in 1 μs simulations.
Figure 9.

Twist (left) and BII populations (right) for individual base pair steps in the Jun-Fos oligomer and C5G5, A3T3, A6, and 3AT duplexes. Comparison of ff99bsc0 (black) and ff99bsc0εζOL1 (red) force fields and experimental data: NMR (green) for Jun-Fos30 and A3T381 and X-ray (blue) for A3T381 and A6.53 The last 800 ns of the 1 μs simulations were averaged and the last two terminal base pairs at each end were excluded from the analysis.
Jun-Fos Model
The Jun-Fos model simulated in this work was a 14-bp duplex with sequence GCATTCTGAGTCAG.34 The MD trajectories obtained with both force fields were stable on a timescale of 1 μs, and most helical parameters exhibited no significant difference (Table S4 of the Supporting Information). When including the εζOL1 correction, the largest changes in twist were observed for the TG/CA (increased by about 3°) and GA/TC (decreased by 2°; see Figure 9) steps. The effects on the remaining base pair steps were much smaller. Because ff99bsc0 strongly underestimates twist in CA steps, the observed increase is desirable in this case. However, in the case of the GA step, it is not clear whether ff99bsc0 overestimates the twist. According to data published by Dans et al.,74 the twist is underestimated in ff99bsc0 relative to a small database of naked X-ray DNA structures, but overestimated in comparison with a larger database that includes complexed DNA. Therefore it is not clear whether the observed reduction of twist in the GA step represents an improvement or worsening. Regarding the BII substates, the εζOL1 correction only caused minor changes, and the overall BII population remained underestimated with respect to that derived from 31P NMR chemical shift measurements.34 Changes in the remaining structural parameters were small and mostly consistent with those found for the other simulated sequences (see below).
CG-Rich Duplex
The CG rich duplex d(CCCCCGGGGG)2 (henceforth abbreviated to C5G5) crystallizes in A-form, but rapidly converted to a B-form structure in MD simulations with both the ff99bsc0 and ff99bsc0εζOL1 force fields. Therefore, the starting X-ray geometry is not suitable as a structural reference. Compared to ff99bsc0, the εζOL1 correction increased the twist in the three base pair steps in the middle of the duplex by about 1.0° (C5G6 step) and 1.7° (two neighboring CC steps). This represents an improvement compared to ff99bsc0, in which both the CG and CC twists were on average underestimated. Unfortunately, the results for the third from the end steps (CC) were not reliable due to disturbance by the noncanonical end-structures. The BII populations substantially increased from 5 % to 15 % (average over the middle three steps). Changes in the remaining structural characteristics were consistent with those found for the other tested sequences, e.g., a decrease of the major groove width from 20.5 Å in ff99bsc0 to 19.5 Å in ff99bsc0εζOL1 force field. The average structural parameters for the ff99bsc0 and ff99bsc0εζOL1 force field are compared in the Supporting Information, Table S5.
A-Tracts
A-tracts are AT-rich sequences that are biologically important, owing to their distinct bending properties.82, 83, 69 One of the characteristic features of A-tracts is the notably higher propeller twist compared to GC-rich or mixed DNA sequences, which has been suggested to be underestimated by the ff99bsc0 force field.84 In the present study, we carried out 1 μs test simulations of a short A-tract structure d(CGCA3T3GCG)2 (abbreviated as A3T3 in the following) and a longer A-tract d(CGCGA6CG)2 (abbreviated as A6). The MD trajectories obtained with the εζOL1 refinement were stable on a timescale of 1 μs, and most helical parameters were similar to those obtained with the original ff99bsc0 force field (Tables S6 and S7 of the Supporting Information). Twist averages for both simulations are shown in Figure 9. X-ray structural data are also shown for comparison, although they are probably not suitable as a reference here (note the non-symmetric twist sequence-dependence for the symmetric A3T3 duplex and the large spread of twist values for the monotonous AAAAAA sequence). A high-quality NMR experiment is available for the A3T3 sequence, providing a very large number of NOE and residual dipolar coupling restraints.36 For the A3T3 sequence, εζOL1 refinement resulted in a notable increase of twist for CA/TG steps by more than 3°. This is desirable considering the known underestimation of the twist value in CA steps by the ff99bsc0 force field. Nevertheless, the increase due to εζOL1 correction is still too low when compared to the NMR reference (where it is available). In the AA steps, the twist increase was smaller and sequence-dependent, again in better agreement with the NMR reference. Backbone RMSD with respect to the X-ray structure decreased from 1.63 Å for ff99bsc0 to 1.37 Å for ff99bsc0εζOL1 (averages were calculated over the A-tract, i.e., over the six internal base pairs only), and the major groove width decreased from 19.9 Å in ff99bsc0 to 18.9 Å in ff99bsc0εζOL1. In the A6 A-tract, the increase of twist in its adenine rich part was relatively small, around 1°, whereas a larger increase of almost 3° was observed in the CG/CG step, as expected. Backbone RMSD with respect to the X-ray structure decreased from 1.41 Å for ff99bsc0 to 1.22 Å for ff99bsc0εζOL1 (averages were calculated over the six internal AT base pairs only), and the major groove width decreased from 19.6 Å in ff99bsc0 to 19.1 Å in ff99bsc0εζOL1 force field. Regarding the BII states, our ε/ζ modification on average slightly increased the BII populations in both A-tracts, mainly in the CG, CA and AA steps. Changes in the remaining structural parameters of both A-tracts were consistent with those found for the other simulated sequences.
Alternating AT Rich Sequence
The d(CGCATATATGCG)2 sequence (henceforth abbreviated to 3AT) contains both TA steps, for which twist is strongly underestimated by the ff99bsc0 force field, and AT steps, for which the predicted twist is close to experiment even with ff99bsc0. Interestingly, the εζOL1 correction increased the twist in the TA steps by about 2° but did not significantly affect the AT twist. The twist also increased in the CA steps, which is again desirable. Thus, both average twist and its sequence dependence seem to be improved by the new ε/ζ parameterization. Significantly, BII populations in the TA and CA base steps also increased alongside the twist changes. Changes in the remaining structural parameters were consistent with those found for the other simulated sequences (Table S8 of the Supporting Information), including narrowing of the major groove. However, the latter change was rather small (from 19.4 Å in ff99bsc0 to 19.1 Å in ff99bsc0εζOL1 force field).
In conclusion, the εζOL1 correction seems to improve the description of DNA duplexes in several ways. It notably increases the twist in base pair steps where it was on average underestimated in ff99bsc0. Because the remaining steps, which are relatively well described in ff99bsc0, are only slightly affected, this should provide a better description of the sequence dependence of the twist. The BII populations are also on average increased compared to ff99bsc0. Furthermore, the εζOL1 correction systematically decreases the major groove width, in accord with experiment, and reduces the RMSD of B-DNA double helixes in MD simulations.
Guanine DNA Quadruplex
Antiparallel-stranded guanine DNA quadruplex (G-DNA) has been suggested as an interesting test case for force field refinement.13 Whereas its stem remains stable in the ff99bsc0 force field, the native noncanonical α/γ backbone substates in the stem seem to be very difficult to describe.13 Notable improvements of α/γ substate populations can be achieved with our χOL4 modification of glycosidic torsion potential designed specifically to improve description of the residues in the χ = syn orientation.13 However, full agreement with experiment has not yet been achieved (for deeper analysis and more details about the structure see ref. 13).
In the present study, we carried out MD simulations of G-DNA quadruplex with four force field variants: ff99bsc0, ff99bsc0χOL4, ff99bsc0εζOL1 and ff99bsc0χOL4εζOL1. Since the stem was essentially stable in all simulations, our analysis focused on description of the α/γ populations in syn-nucleotides of the antiparallel G-DNA stem (shown in Table 3). X-ray values for the 2GWQ structure were used as reference. Note that there is some ambiguity regarding the conformational state of G3 and G11 guanines in this structure. There are four independent G-DNA molecules in a unit cell; in two of them, G11 was assigned as α(g-)/γ(g-), whereas in the other two, it was assigned as α(g+)/γ(g-) (symbols (g+), (g-) and (t) are abbreviations for gauche +, gauche - and trans). We found that the model agreed reasonably well with the X-ray electron density map in the two residues assigned as α(g+)/γ(g-), whereas the fit was less good for the α(g-)/γ(g-) residues. In the case of G3, only one guanine out of all four structures was assigned as α(g-)/γ(g-). Therefore, we propose that these two conformers exist in equilibrium, with the α(g+)/γ(g-) state being more likely. Note that the α(g-)/γ(g-) substates are often found in other X-ray refinements in equivalent positions.13
Table 3.
Population (%) of various α/γ substates of syn-χ guanines in the stem of antiparallel d(G4T4G4) G-DNA structure. Na+ net neutral simulations in TIP3P, 500 ns. X-ray data correspond to the 2GWQ structure. Gauche +, gauche - and trans states are denoted as (g+), (g-) and (t). Green color indicates native states, light green indicates rare states (discussed in the text).
| nucleotides | X-ray α/γ | α/γ | ||||
|---|---|---|---|---|---|---|
| g-/g+ | g+/g- | g+/t | g-/g- | |||
| ffbsc0 | G3 | g+/g- (g-/g-)1 | 91 | 8 | 0 | 1 |
| G9 | g+/t | 0 | 0 | 95 | 0 | |
| G11 | g+/g- (g-/g-)1 | 81 | 16 | 0 | 3 | |
| G15 | g+/g- | 93 | 6 | 0 | 1 | |
| G21 | g+/t | 11 | 0 | 68 | 0 | |
| G23 | g+/g- | 66 | 25 | 0 | 10 | |
|
| ||||||
| ff99bsc0χOL4 | G3 | g+/g- (g-/g-)1 | 35 | 48 | 0 | 17 |
| G9 | g+/t | 7 | 0 | 80 | 0 | |
| G11 | g+/g- (g-/g-)1 | 14 | 53 | 0 | 32 | |
| G15 | g+/g- | 32 | 51 | 0 | 17 | |
| G21 | g+/t | 4 | 0 | 82 | 0 | |
| G23 | g+/g- | 10 | 53 | 0 | 36 | |
|
| ||||||
| ff99bsc0 χOL4εζOL1 | G3 | g+/g- (g-/g-)1 | 27 | 69 | 0 | 4 |
| G9 | g+/t | 19 | 0 | 72 | 0 | |
| G11 | g+/g- (g-/g-)1 | 13 | 80 | 0 | 7 | |
| G15 | g+/g- | 25 | 70 | 0 | 4 | |
| G21 | g+/t | 31 | 0 | 61 | 0 | |
| G23 | g+/g- | 8 | 85 | 0 | 6 | |
|
| ||||||
| ff99bsc0εζOL1 | G3 | g+/g- (g-/g-)1 | 87 | 12 | 0 | 1 |
| G9 | g+/t | 7 | 0 | 85 | 0 | |
| G11 | g+/g- (g-/g-)1 | 60 | 38 | 0 | 1 | |
| G15 | g+/g- | 84 | 15 | 1 | 1 | |
| G21 | g+/t | 14 | 0 | 68 | 0 | |
| G23 | g+/g- | 73 | 25 | 0 | 2 | |
G3 and G11 nucleotides can be found also in g-/g+ state (see text)
Whereas in B-DNA, all α/γ torsions are found in the canonical α(g-)/γ(g+) state, syn guanines in G-DNA are mainly found in the α(g+)/γ(g-) and α(g+)/γ(t) combinations (first data column of Table 3). Unfortunately, the ff99bsc0 force field in MD simulations populated the non-native α(g-)/γ(g+) state for G3, G11, G15 and G23, at the expense of the native α(g+)/γ(g-) backbone angle combination. This undesirable behavior was largely corrected by the ff99bsc0χOL4 modification, although another problem arose: the non-native α(g-)/γ(g-) states were then significantly populated at the expense of the native α(g+)/γ(g-) state. As can be seen from Table 3, both these problems were rectified only when the εζOL1 correction was applied alongside the χOL4 correction. Interestingly, εζOL1 on its own did not provide any significant improvement compared to ff99bsc0. Thus, the ff99bsc0χOL4εζOL1 force field seems to provide the best description of the G-DNA stem structure.
It should be noted that neither the χOL4 nor εζOL1 correction modifies the α/γ torsion parameters. Nevertheless, populations of the α/γ states are clearly very sensitive to changes in the χ and εζ potentials. This indicates a strong and intricate coupling of the mentioned torsions, probably mediated mechanically through the backbone or through the molecular interactions of nucleobases. Such couplings make parameter development very difficult as they may lead to incorrect conclusions regarding performance of the tested parameters, due to hidden problems in some other force field components.
Z-DNA
The Z-DNA form deserves special attention in force field testing, owing to the rich variety of its torsion angle combinations. A detailed description of the Z-DNA structure can be found in ref. 13, along with analysis of the performance of the glycosidic torsion force field refinement, χOL4, for this structure. In the present work, we simulated the d(CGCGCG)2 Z-DNA hexamer, starting from the X-ray structure with PDB ID 1ICK55. The force fields tested were ff99bsc0, ff99bsc0χOL4, ff99bsc0εζOL1 and ff99bsc0χOL4εζOL1. In all our simulations, the trajectory was stable and no major structural changes were observed on a timescale of 400 ns. The all-atom RMSD over the whole trajectory was 0.99 Å for ff99bsc0 and 1.21 Å for ff99bsc0εζOL1. Unfortunately, none of the tested force fields provided a correct description of all the Z-DNA backbone conformational substates. The main problems were (i) the ZI/ZII equilibrium, and (ii) the undesirable population of some of the nonnative α/γ substates (α(G) = trans and γ(G) = g+, see also ref. 13). The reference angles for the native α/γ and ZI/ZII substates are shown in Table 4. Note that the ZI and ZII conformers differ in five backbone angles: ε(G), ζ(G), α(C), β(C) and γ(C). In the crystal structures, the ZI state is dominant and the ZII state is found rarely, mainly in the presence of Mg2+ cations.85 Therefore, one might expect that the ZI conformer would be predominant in MD simulations.
Table 4.
Reference values of dihedral angles (degrees) in Z-DNA.28 Whereas the 5’-CpG-3’dinucleotide step exists only in one possible conformation (Z-form), two forms (ZI-form, ZII-form) are possible for the 5’-GpC-3’dinucleotide step.
| 5’-CpG-3’ step | |||
|---|---|---|---|
|
| |||
| Z-form | |||
| χ (C) | 205 | ||
| δ (C) | 144 | ||
| ε (C) | 264 | ||
| ζ (C) | 76 | ||
| α (G) | 66 | ||
| β (G) | 186 | ||
| γ (G) | 179 | ||
| δ (G) | 95 | ||
| χ (G) | 61 | ||
|
| |||
| 5’-GpC-3’ step | |||
|
| |||
| ZI-form | ZII-form | ||
| χ (G) | 61 | ||
| δ (G) | 95 | ||
| ε (G) | 242 | 187 | |
| ζ (G) | 292 | 63 | |
| α (C) | 210 | 169 | |
| β (C) | 233 | 162 | |
| γ (C) | 54 | 44 | |
| δ (C) | 144 | ||
| χ (C) | 205 | ||
The ff99bsc0 force field performs quite well regarding the α/γ substates because it generates only about 5 % of non-native populations. In contrast, the ZI/ZII equilibrium is described poorly in two respects. First, the ZII state is not reproduced by ff99bsc0 because the ζ torsion does not acquire its ZII value. Instead, ζ maintains its ZI (~ 292°) value through most of the simulation. In contrast, the α, β and ζ torsions oscillate between their ZI and ZII values, but the fast oscillations of α and β are not coupled with the corresponding ZI/ZII changes of ε torsion. We will henceforth refer to this anomalous ZII state as “pseudo-ZII”. The second problem is that the pseudo-ZII state is strongly populated, as the molecule spends about 60 % of the simulation time in the pseudo-ZII state (judged by α distribution). This is contrary to our expectation that the ZI state would be dominant.
In the ff99bsc0χOL4 simulation, the molecule again spent about 50 % of the simulation time in the pseudo-ZII state. In addition, the χOL4 correction promoted the undesirable α(t)/γ(+) conformations in the guanine residues. Thus, the refinement of the syn region of χ paradoxically did not improve the description of the Z-DNA structure, as discussed extensively in ref 13. This situation did not change even when χOL4 was combined with εζOL1 refinement (ff99bsc0χOL4εζOL1). Therefore, we decided not to run any further test simulations with these parameters.
In the ff99bsc0εζOL1 simulation, two main changes were found compared to the ff99bsc0 results. First, there was a substantial improvement of the ZII state description, as all five angles involved in ZI/ZII states acquired values close to the required ones. Moreover, changes of the individual torsions were coupled, such that all five torsions acquired the values corresponding to the ZII state simultaneously. The population of the native ZI state was around 70 % (the rest being ZII), which is probably still too low but a notable improvement compared to the ff99bsc0 simulation. The second change was the emergence of the undesirable α/γ substates, which represents a worsening with respect to ff99bsc0 description. The population and type of these α/γ substates was similar to those for the ff99bsc0χOL4 simulation. At present, it is unclear whether other force field components may be responsible for this behavior, such as inaccuracies of the γ torsion potential, which may overly destabilize the γ = trans state. In conclusion, compared to the ff99bsc0 force field, the εζOL1 correction improves the description of the ZI/ZII equilibrium but also induces undesirable α/γ substates. Clearly, an accurate and balanced description of the fine backbone details of Z-DNA remains challenging.
RNA Duplex
Although the εζOL1 parameters were developed for DNA simulations, we also carried out test MD simulations on the RNA duplex 1QC0’ (r(GCACCGUUGG)2, see Methods). Table S9 compares the X-ray structural parameters for 1QC0’ with the ff99bsc0χOL3 and ff99bsc0χOL3εζOL1 results. Both simulations were stable on the simulation timescale (500 ns) and provided almost identical results, with marginal shifts of the average values of ε, ζ and inclination closer to the X-ray reference with ff99bsc0χOL3εζOL1. The very similar performance of both force fields suggests that the εζOL1 correction might also be suitable for RNA simulations. However, due to complexity of RNA structures and the numerous noncanonical motives they contain, extensive MD simulations on a multitude of RNA structures would be necessary to assess the reliability and usefulness of the newly derived parameters for RNA MD simulations. Work in this direction is in progress in our laboratory.
Conclusions
This study reports a reparametrization of the ε and ζ torsion parameters of the Cornell et al. force field, εζOL1, which relies on high-level QM calculations and accounts for the conformation-dependent solvation effects that are not covered by the standard explicit solvent models in MD simulations.20 Performance of the refined parameters was analyzed by means of extended molecular dynamics (MD) simulations for several representative DNA systems.
The main differences with respect to the original ff99bsc0 parameters were stabilization of the flipped ε/ζ = g-/t state and lowering of the transition barrier between the canonical (BI) and flipped (BII) substates. As a result, the εζOL1 correction on average increased populations of the BII substates and increased the BI/BII interconversion rate in B-DNA duplexes as compared to the ff99bsc0 simulations. Although the average BII population was increased, it remained somewhat underestimated in comparison with NMR experimental data. However, further improvements may be achieved by modifying other force field components.8
Whereas most B-DNA structural parameters remained unaffected by the εζOL1 modification, several desirable effects were apparent. The εζOL1 modification increased the average twist in the simulated B-DNA duplexes, mainly in the base pairs steps where it was significantly underestimated by the ff99bsc0 force field. The resulting twist and sequence dependence were in better agreement with solution NMR data. Furthermore, the εζOL1 parameters improved the description of groove widths, and substantially reduced the RMSD of the sugar-phosphate backbone as compared to the ff99bsc0 MD simulations.
The εζOL1 correction was also shown to be beneficial for simulation of some rare DNA structures. In Z-DNA, which is a particularly complicated test case for current force fields, our correction seems to be able to describe the rare ZII state of Z-DNA, which was not captured properly by ff99bsc0. On the other hand, εζOL1 also increased the population of some non-native α/γ substates. Thus, a fully satisfactory description of the fine backbone details in Z-DNA was not achieved by any combination of the existing parameters. In combination with the χOL4 refinement of the glycosidic torsion, εζOL1 markedly improved the description of the native α/γ substates in antiparallel stem of G-DNA quadruplexes. All G-DNA backbone substates are now in good agreement with the available experimental reference.
Preliminary tests on canonical duplexes did not show large effects, either positive or negative, on the RNA simulations. However, we do not recommend εζOL1 for RNA simulations without completing more extensive tests.
In conclusion, the results reported for the newly derived parameters on several representative DNA structures indicate an overall improvement in the structural description of deoxyribonucleic acids. However, due to complexity of parameter development, long-term extensive testing will be necessary before the εζOL1 modification can be routinely used with confidence for DNA simulations.
Supplementary Material
Figure 4.
Dihedral terms for ε (top) and ζ (bottom). εζOL1 (red) is compared with the original ff99bsc0 AMBER parameters (black). Only parameters for CT-CT-OS-P (C2’-C3’-OS-P and C4’-C3’-OS-P) components of the ε angle were changed and parameters for H1-CT-OS-P (H3’-C3’-OS-P) component are the same as in ff99bsc0.
Acknowledgments
This work was supported by grants P208/10/1742 (PJ) and P208/11/1822 (JS) from the Grant Agency of the Czech Republic. Further funding was provided by the RCPTM – “Regional Centre of Advanced Technologies and Materials” (CZ.1.05/2.1.00/03.0058) from the European Regional Development Fund, “RCPTM-TEAM” (CZ.1.07/2.3.00/20.0017) from the Education for Competitiveness Operational Program - European Social Fund, CEITEC – “Central European Institute of Technology” (CZ.1.05/1.1.00/02.0068) from the European Regional Development Fund, the Spanish DGICYT (SAF2011-27642), the Generalitat de Catalunya (2009SGR298), and the NIH R01-GM081411 (TEC III).
Footnotes
Supporting Information: εζOL1 torsion parameters, comparison of QM and force field 2D maps, time series and distributions of selected structural parameters in MD simulations, examples of noncanonical end-structures, convergence of the BI/BII populations and additional statistical data. Files containing ff99bsc0εζOL1 parameters for DNA simulations. This material is available free of charge via the Internet at http://pubs.acs.org.
References
- 1.Perez A, Marchan I, Svozil D, Sponer J, Cheatham TE, Laughton CA, Orozco M. Biophys J. 2007;92(11):3817–3829. doi: 10.1529/biophysj.106.097782. [DOI] [PMC free article] [PubMed] [Google Scholar]
- 2.Ode H, Matsuo Y, Neya S, Hoshino T. J Comput Chem. 2008;29(15):2531–2542. doi: 10.1002/jcc.21006. [DOI] [PubMed] [Google Scholar]
- 3.Zgarbova M, Otyepka M, Sponer J, Mladek A, Banas P, Cheatham TE, 3rd, Jurecka P. J Chem Theory Comput. 2011;7(9):2886–2902. doi: 10.1021/ct200162x. [DOI] [PMC free article] [PubMed] [Google Scholar]
- 4.Yildirim I, Stern HA, Kennedy SD, Tubbs JD, Turner DH. J Chem Theory Comput. 2010;6(5):1520–1531. doi: 10.1021/ct900604a. [DOI] [PMC free article] [PubMed] [Google Scholar]
- 5.Yildirim I, Kennedy SD, Stern HA, Hart JM, Kierzek R, Turner DH. J Chem Theory Comput. 2012;8(1):172–181. doi: 10.1021/ct200557r. [DOI] [PMC free article] [PubMed] [Google Scholar]
- 6.Denning EJ, Priyakumar UD, Nilsson L, Mackerell AD. J Comput Chem. 2011;32(9):1929–1943. doi: 10.1002/jcc.21777. [DOI] [PMC free article] [PubMed] [Google Scholar]
- 7.Foloppe N, MacKerell AD. J Comput Chem. 2000;21(2):86–104. [Google Scholar]
- 8.Hart K, Foloppe N, Baker CM, Denning EJ, Nilsson L, MacKerell AD. J Chem Theory Comput. 2012;8(1):348–362. doi: 10.1021/ct200723y. [DOI] [PMC free article] [PubMed] [Google Scholar]
- 9.Sponer J, Mladek A, Sponer JE, Svozil D, Zgarbova M, Banas P, Jurecka P, Otyepka M. Phys Chem Chem Phys. 2012;14(44):15257–15277. doi: 10.1039/c2cp41987d. [DOI] [PubMed] [Google Scholar]
- 10.Banáš P, Hollas D, Zgarbova M, Jurecka P, Orozco M, Cheatham T, Sponer J, Otyepka M. J Chem Theory Comput. 2010;6(12):3836–3849. doi: 10.1021/ct100481h. [DOI] [PMC free article] [PubMed] [Google Scholar]
- 11.Mlynsky V, Banas P, Hollas D, Reblova K, Walter NG, Sponer J, Otyepka M. J Phys Chem B. 2010;114(19):6642–6652. doi: 10.1021/jp1001258. [DOI] [PMC free article] [PubMed] [Google Scholar]
- 12.Sklenovsky P, Florova P, Banas P, Reblova K, Lankas F, Otyepka M, Sponer J. J Chem Theory Comput. 2011;7(9):2963–2980. doi: 10.1021/ct200204t. [DOI] [PubMed] [Google Scholar]
- 13.Krepl M, Zgarbova M, Stadlbauer P, Otyepka M, Banas P, Koca J, Cheatham TE, III, Jurecka P, Sponer J. J Chem Theory Comput. 2012;8:2506–2520. doi: 10.1021/ct300275s. [DOI] [PMC free article] [PubMed] [Google Scholar]
- 14.Cornell WD, Cieplak P, Bayly CI, Gould IR, Merz KM, Ferguson DM, Spellmeyer DC, Fox T, Caldwell JW, Kollman PA. J Am Chem Soc. 1995;117(19):5179–5197. [Google Scholar]
- 15.Besseova I, Banas P, Kuhrova P, Kosinova P, Otyepka M, Sponer J. J Phys Chem B. 2012;116(33):9899–9916. doi: 10.1021/jp3014817. [DOI] [PubMed] [Google Scholar]
- 16.Perez A, Lankas F, Luque FJ, Orozco M. Nucleic Acids Res. 2008;36(7):2379–2394. doi: 10.1093/nar/gkn082. [DOI] [PMC free article] [PubMed] [Google Scholar]
- 17.Lankas F, Lavery R, Maddocks JH. Structure. 2006;14(10):1527–1534. doi: 10.1016/j.str.2006.08.004. [DOI] [PubMed] [Google Scholar]
- 18.Fadrna E, Spackova N, Stefl R, Koca J, Cheatham TE, Sponer J. Biophys J. 2004;87(1):227–242. doi: 10.1529/biophysj.103.034751. [DOI] [PMC free article] [PubMed] [Google Scholar]
- 19.Fadrna E, Spackova N, Sarzynska J, Koca J, Orozco M, Cheatham TE, Kulinski T, Sponer J. J Chem Theory Comput. 2009;5(9):2514–2530. doi: 10.1021/ct900200k. [DOI] [PubMed] [Google Scholar]
- 20.Zgarbova M, Luque FJ, Sponer J, Otyepka M, Jurecka P. J Chem Theory Comput. 2012;8(9):3232–3242. doi: 10.1021/ct3001987. [DOI] [PubMed] [Google Scholar]
- 21.Case DA, Darden TA, Cheatham TE, III, Simmerling CL, Wang J, Duke RE, Luo R, Walker RC, Zhang W, Merz KM, Roberts BP, Hayik S, Roitberg A, Seabra G, Swails J, Goetz AW, Kolossvary I, Wong KF, Paesani F, Vanicek J, Wolf RM, Liu J, Wu X, Brozell SR, Steinbrecher T, Gohlke H, Cai Q, Ye X, Wang J, Hsieh MJ, Cui G, Roe DR, Mathews DH, Seetin MG, Salomon-Ferrer R, Sagui C, Babin V, Luchko T, Gusarov S, Kovalenko A, Kollman PA. AMBER. Vol. 12. University of California; San Francisco: 2012. [Google Scholar]
- 22.Cheatham TE, Cieplak P, Kollman PA. J Biomol Struct Dyn. 1999;16(4):845–862. doi: 10.1080/07391102.1999.10508297. [DOI] [PubMed] [Google Scholar]
- 23.Foloppe N, MacKerell AD. Biophys J. 1999;76(6):3206–3218. doi: 10.1016/S0006-3495(99)77472-2. [DOI] [PMC free article] [PubMed] [Google Scholar]
- 24.Gorenstein DG. Chem Rev. 1994;94(5):1315–1338. [Google Scholar]
- 25.Fratini AV, Kopka ML, Drew HR, Dickerson RE. J Biol Chem. 1982;257(24):4686–4707. [PubMed] [Google Scholar]
- 26.Schneider B, Neidle S, Berman HM. Biopolymers. 1997;42(1):113–124. doi: 10.1002/(sici)1097-0282(199707)42:1<113::aid-bip10>3.0.co;2-o. [DOI] [PubMed] [Google Scholar]
- 27.Schwieters CD, Clore GM. Biochemistry. 2007;46(5):1152–1166. doi: 10.1021/bi061943x. [DOI] [PubMed] [Google Scholar]
- 28.Svozil D, Kalina J, Omelka M, Schneider B. Nucleic Acids Res. 2008;36(11):3690–3706. doi: 10.1093/nar/gkn260. [DOI] [PMC free article] [PubMed] [Google Scholar]
- 29.Djuranovic D, Hartmann B. Biopolymers. 2004;73(3):356–368. doi: 10.1002/bip.10528. [DOI] [PubMed] [Google Scholar]
- 30.Heddi B, Foloppe N, Bouchemal N, Hantz E, Hartmann B. J Am Chem Soc. 2006;128(28):9170–9177. doi: 10.1021/ja061686j. [DOI] [PubMed] [Google Scholar]
- 31.Djuranovic D, Hartmann B. J Biomol Struct Dyn. 2003;20(6):771–788. doi: 10.1080/07391102.2003.10506894. [DOI] [PubMed] [Google Scholar]
- 32.Heddi B, Foloppe N, Hantz E, Hartmann B. J Mol Biol. 2007;368(5):1403–1411. doi: 10.1016/j.jmb.2007.03.010. [DOI] [PubMed] [Google Scholar]
- 33.Isaacs RJ, Spielmann HP. J Mol Biol. 2001;311(1):149–160. doi: 10.1006/jmbi.2001.4855. [DOI] [PubMed] [Google Scholar]
- 34.Heddi B, Foloppe N, Oguey C, Hartmann B. J Mol Biol. 2008;382(4):956–970. doi: 10.1016/j.jmb.2008.07.047. [DOI] [PubMed] [Google Scholar]
- 35.Gorenstein DG, Kar D. Biochem Biophys Res Commun. 1975;65(3):1073–1080. doi: 10.1016/s0006-291x(75)80495-5. [DOI] [PubMed] [Google Scholar]
- 36.Přecechtělová J, Munzarová ML, Vaara J, Novotný J, Dracinsky M, Sklenar V. J Chem Theory Comput. 2013;9(3):1641–1656. doi: 10.1021/ct300488y. [DOI] [PubMed] [Google Scholar]
- 37.Precechtelova J, Novak P, Munzarova ML, Kaupp M, Sklenar V. J Am Chem Soc. 2010;132(48):17139–17148. doi: 10.1021/ja104564g. [DOI] [PubMed] [Google Scholar]
- 38.Benda L, Vokacova ZS, Straka M, Sychrovsky V. J Phys Chem B. 2012;116(12):3823–3833. doi: 10.1021/jp2099043. [DOI] [PubMed] [Google Scholar]
- 39.Tian Y, Kayatta M, Shultis K, Gonzalez A, Mueller LJ, Hatcher ME. J Phys Chem B. 2009;113(9):2596–2603. doi: 10.1021/jp711203m. [DOI] [PMC free article] [PubMed] [Google Scholar]
- 40.Klamt A, Schuurmann G. J Chem Soc Perkin Trans. 1993;2(5):799–805. [Google Scholar]
- 41.Halkier A, Helgaker T, Jorgensen P, Klopper W, Koch H, Olsen J, Wilson AK. Chem Phys Lett. 1998;286(3-4):243–252. [Google Scholar]
- 42.Halkier A, Helgaker T, Jorgensen P, Klopper W, Olsen J. Chem Phys Lett. 1999;302(5-6):437–446. [Google Scholar]
- 43.Ahlrichs R, Bar M, Haser M, Horn H, Kolmel C. Chem Phys Lett. 1989;162(3):165–169. [Google Scholar]
- 44.Weigend F, Häser M. Theor Chem Acc. 1997;97(1-4):331–340. [Google Scholar]
- 45.Frisch MJ, Trucks GW, Schlegel HB, Scuseria GE, Robb MA, Cheeseman JR, Montgomery JA, J, Vreven T, Kudin KN, Burant JC, Millam JM, Iyengar SS, Tomasi J, Barone V, Mennucci B, Cossi M, Scalmani G, Rega N, Petersson GA, Nakatsuji H, Hada M, Ehara M, Toyota K, Fukuda R, Hasegawa J, Ishida M, Nakajima T, Honda Y, Kitao O, Nakai H, Klene M, Li X, Knox JE, Hratchian HP, Cross JB, Bakken V, Adamo C, Jaramillo J, Gomperts R, Stratmann RE, Yazyev O, Austin AJ, Cammi R, Pomelli C, Ochterski JW, Ayala PY, Morokuma K, Voth GA, Salvador P, Dannenberg JJ, Zakrzewski VG, Dapprich S, Daniels AD, Strain MC, Farkas O, Malick DK, Rabuck AD, Raghavachari K, Foresman JB, Ortiz JV, Cui Q, Baboul AG, Clifford S, Cioslowski J, Stefanov BB, Liu G, Liashenko A, Piskorz P, Komaromi I, Martin RL, Fox DJ, Keith T, Al-Laham MA, Peng CY, Nanayakkara A, Challacombe M, Gill PMW, Johnson B, Chen W, Wong MW, Gonzalez C, Pople JA. Gaussian 03, revision D.02. Gaussian, Inc.; Wallingford, CT: 2004. [Google Scholar]
- 46.Case DA, Cheatham TE, Darden T, Gohlke H, Luo R, Merz KM, Onufriev A, Simmerling C, Wang B, Woods RJ. J Comput Chem. 2005;26(16):1668–1688. doi: 10.1002/jcc.20290. [DOI] [PMC free article] [PubMed] [Google Scholar]
- 47.Luo R, David L, Gilson MK. J Comput Chem. 2002;23(13):1244–1253. doi: 10.1002/jcc.10120. [DOI] [PubMed] [Google Scholar]
- 48.Lu Q, Luo R. J Chem Phys. 2003;119(21):11035–11047. [Google Scholar]
- 49.Wang JM, Cieplak P, Kollman PA. J Comput Chem. 2000;21(12):1049–1074. [Google Scholar]
- 50.Drew HR, Wing RM, Takano T, Broka C, Tanaka S, Itakura K, Dickerson RE. Proc Natl Acad Sci U S A. 1981;78(4):2179–2183. doi: 10.1073/pnas.78.4.2179. [DOI] [PMC free article] [PubMed] [Google Scholar]
- 51.Bansal M, Bhattacharyya D, Ravi B. Comput Appl Biosci. 1995;11(3):281–287. doi: 10.1093/bioinformatics/11.3.281. [DOI] [PubMed] [Google Scholar]
- 52.Hays FA, Teegarden A, Jones ZJR, Harms M, Raup D, Watson J, Cavaliere E, Ho PS. Proc Natl Acad Sci U S A. 2005;102(20):7157–7162. doi: 10.1073/pnas.0409455102. [DOI] [PMC free article] [PubMed] [Google Scholar]
- 53.Woods KK, Maehigashi T, Howerton SB, Sines CC, Tannenbaum S, Williams LD. J Am Chem Soc. 2004;126(47):15330–15331. doi: 10.1021/ja045207x. [DOI] [PubMed] [Google Scholar]
- 54.Digabriele AD, Steitz TA. J Mol Biol. 1993;231(4):1024–1039. doi: 10.1006/jmbi.1993.1349. [DOI] [PubMed] [Google Scholar]
- 55.Dauter Z, Adamiak DA. Acta Crystallogr D Biol Crystallogr. 2001;57:990–995. doi: 10.1107/s0907444901006382. [DOI] [PubMed] [Google Scholar]
- 56.Klosterman PS, Shah SA, Steitz TA. Biochemistry. 1999;38(45):14784–14792. doi: 10.1021/bi9912793. [DOI] [PubMed] [Google Scholar]
- 57.Aqvist J. J Phys Chem. 1990;94(21):8021–8024. [Google Scholar]
- 58.Joung IS, Cheatham TE. J Phys Chem B. 2008;112(30):9020–9041. doi: 10.1021/jp8001614. [DOI] [PMC free article] [PubMed] [Google Scholar]
- 59.Joung IS, Cheatham TE. J Phys Chem B. 2009;113(40):13279–13290. doi: 10.1021/jp902584c. [DOI] [PMC free article] [PubMed] [Google Scholar]
- 60.Jorgensen WL, Chandrasekhar J, Madura JD, Impey RW, Klein ML. J Chem Phys. 1983;79(2):926–935. [Google Scholar]
- 61.Berendsen HJC, Grigera JR, Straatsma TP. J Phys Chem. 1987;91(24):6269–6271. [Google Scholar]
- 62.Case DA, Darden TA, Chetham TE, III, Simmerling CE, Wang J, Duke RE, Luo R, Walker RC, Zhang W, Merz KM, Roberts BP, Wang B, Hayik S, Roitberg A, Seabra G, Kolossvary I, Wong KF, Paesani F, Vanicek J, Liu J, Wu X, Brozell SR, Steinbrecher T, Gohlke H, Cai Q, Ye X, Wang J, Hsieh MJ, Cui G, Roe DR, Mathews DH, Seetin MG, Sagui C, Babin V, Luchko T, Gusarov V, Kovalenko A, Kollmann PA. AMBER. Vol. 11. University of California; San Francisco: 2010. [Google Scholar]
- 63.Gotz AW, Williamson MJ, Xu D, Poole D, Le Grand S, Walker RC. J Chem Theory Comput. 2012;8(5):1542–1555. doi: 10.1021/ct200909j. [DOI] [PMC free article] [PubMed] [Google Scholar]
- 64.Lu XJ, Olson WK. Nucleic Acids Res. 2003;31(17):5108–5121. doi: 10.1093/nar/gkg680. [DOI] [PMC free article] [PubMed] [Google Scholar]
- 65.Altona C, Sundaral M. J Am Chem Soc. 1972;94(23):8205–8212. doi: 10.1021/ja00778a043. [DOI] [PubMed] [Google Scholar]
- 66.El Hassan MA, Calladine CR. J Mol Biol. 1998;282(2):331–343. doi: 10.1006/jmbi.1998.1994. [DOI] [PubMed] [Google Scholar]
- 67.Hartmann B, Piazzola D, Lavery R. Nucleic Acids Res. 1993;21(3):561–568. doi: 10.1093/nar/21.3.561. [DOI] [PMC free article] [PubMed] [Google Scholar]
- 68.Foloppe N, MacKerell AD. J Phys Chem B. 1999;103(49):10955–10964. [Google Scholar]
- 69.Lankas F, Spackova N, Moakher M, Enkhbayar P, Sponer J. Nucleic Acids Res. 2010;38(10):3414–3422. doi: 10.1093/nar/gkq001. [DOI] [PMC free article] [PubMed] [Google Scholar]
- 70.Drsata T, Perez A, Orozco M, Morozov AV, Sponer J, Lankas F. J Chem Theory Comput. 2013;9(1):707–721. doi: 10.1021/ct300671y. [DOI] [PMC free article] [PubMed] [Google Scholar]
- 71.Sines CC, McFail-Isom L, Howerton SB, VanDerveer D, Williams LD. J Am Chem Soc. 2000;122(45):11048–11056. [Google Scholar]
- 72.Tjandra N, Tate S, Ono A, Kainosho M, Bax A. J Am Chem Soc. 2000;122(26):6190–6200. [Google Scholar]
- 73.Wu ZG, Delaglio F, Tjandra N, Zhurkin VB, Bax A. J Biomol NMR. 2003;26(4):297–315. doi: 10.1023/a:1024047103398. [DOI] [PubMed] [Google Scholar]
- 74.Dans PD, Perez A, Faustino I, Lavery R, Orozco M. Nucleic Acids Res. 2012;40(21):10668–10678. doi: 10.1093/nar/gks884. [DOI] [PMC free article] [PubMed] [Google Scholar]
- 75.Pichler A, Rudisser S, Winger RH, Liedl KR, Hallbrucker A, Mayer E. Chem Phys. 2000;258(2-3):391–404. [Google Scholar]
- 76.Wahl MC, Sundaralingam MA. DNA duplexes in the crystal. In: Neidle S, editor. Oxford handbook of nucleic acid structure. Oxford University Press; Oxford, GB: 1999. pp. 117–144. [Google Scholar]
- 77.Perez A, Noy A, Lankas F, Luque FJ, Orozco M. Nucleic Acids Res. 2004;32(20):6144–6151. doi: 10.1093/nar/gkh954. [DOI] [PMC free article] [PubMed] [Google Scholar]
- 78.Noy A, Perez A, Lankas F, Javier Luque F, Orozco M. J Mol Biol. 2004;343(3):627–638. doi: 10.1016/j.jmb.2004.07.048. [DOI] [PubMed] [Google Scholar]
- 79.Dixit SB, Ponomarev SY, Beveridge DL. J Chem Inf Model. 2006;46(3):1084–1093. doi: 10.1021/ci0504925. [DOI] [PubMed] [Google Scholar]
- 80.Lavery R, Zakrzewska K, Beveridge D, Bishop TC, Case DA, Cheatham T, Dixit S, Jayaram B, Lankas F, Laughton C, Maddocks JH, Michon A, Osman R, Orozco M, Perez A, Singh T, Spackova N, Sponer J. Nucleic Acids Res. 2010;38(1):299–313. doi: 10.1093/nar/gkp834. [DOI] [PMC free article] [PubMed] [Google Scholar]
- 81.Stefl R, Wu HH, Ravindranathan S, Sklenar V, Feigon J. Proc Natl Acad Sci U S A. 2004;101(5):1177–1182. doi: 10.1073/pnas.0308143100. [DOI] [PMC free article] [PubMed] [Google Scholar]
- 82.Haran TE, Mohanty U. Q Rev Biophys. 2009;42(1):41–81. doi: 10.1017/S0033583509004752. [DOI] [PubMed] [Google Scholar]
- 83.Rohs R, West SM, Sosinsky A, Liu P, Mann RS, Honig B. Nature. 2009;461(7268):1248–U1281. doi: 10.1038/nature08473. [DOI] [PMC free article] [PubMed] [Google Scholar]
- 84.Banas P, Mladek A, Otyepka M, Zgarbova M, Jurecka P, Svozil D, Lankas F, Sponer J. J Chem Theory Comput. 2012;8(7):2448–2460. doi: 10.1021/ct3001238. [DOI] [PubMed] [Google Scholar]
- 85.Wang AJ, Quigley GJ, Kolpak FJ, van der Marel G, van Boom JH, Rich A. Science. 1981;211(4478):171–176. doi: 10.1126/science.7444458. [DOI] [PubMed] [Google Scholar]
Associated Data
This section collects any data citations, data availability statements, or supplementary materials included in this article.