

Abstract
Identifying predictors of left ventricular hypertrophy has been an active study topic because of its association with cardiovascular morbidity and mortality. We examined the epistatic effect (gene-gene interaction) of two genes (ACE I/D; AGT -6G-A, M235T, -20A-C) in the renin-angiotension system (RAS) on left ventricular mass (LVM) among hypertensive participants in the HyperGEN study.
Included were 2156 participants aged 20–87 years (60% women, 63% African American). We employed mixed linear regression models to assess main effects of four genetic variants on echocardigraphically determined LVM (indexed for height), and ACE-by-AGT epistatic effects. There was evidence that AGT -6G-A was associated with LVM among white participants: Adjusted mean LVM (g/m2.7) increased with ‘G’ allele copy number (‘AA’:41.2, ‘AG’:42.3, ‘GG’:44.0; p=0.03). There was also evidence of an ACE I/D-by-AGT -20A-C epistatic effect among white participants (interaction p=0.03): Among ACE ‘DD’ participants, AGT -20A-C ‘C’ allele carriers had lower mean LVM than ‘AA’ homozygotes (‘DD/CC’:39.2, ‘DD/AC’:39.9, ‘DD/AA’:43.9), with no similar significant effect among ACE ‘I’ allele carriers (‘ID/CC’:47.2, ‘ID/AC’:43.4, ‘ID/AA’:42.6; ‘II/CC’: NA, ‘II/AC’:41.3, ‘II/AA’:43.1).
These findings indicate that RAS variants in at least two genes may interact to modulate LVM.
Keywords: Left ventricular mass, left ventricular hypertrophy, ACE gene, AGT gene, epistasis, hypertension
Introduction
Identifying predictors of left ventricular hypertrophy (LVH) has been an active area of study because of the association of LVH with cardiovascular disease morbidity and mortality. 1, 2 Research has provided evidence that LVH is likely under genetic control. 3, 4 Given the association of LVH with hypertension, 2 some studies have looked at candidate genes associated with blood pressure to find genetic associations with LVH. Angiotensin-converting enzyme insertion/deletion (ACE) I/D and angiotensinogen (AGT) are among the most commonly researched. 5–16 The ACE I/D variant of the ACE gene located on chromosome 17 has been shown to account for nearly half of the variance of serum ACE. Serum ACE is an enzyme that catalyzes the conversion of angiotensin I to angiotensin II, which is a vasoconstrictor and stimulator of aldosterone secretion by the adrenal gland. 17 The AGT gene located on chromosome 1 expresses the protein angiotensinogen, which is a precursor of angiotensin I. 18 Commonly studied variants within the AGT gene include a methione-to-threonine missense mutation with amino acid substitution at codon 235 (M235T), and two variants in the promoter region, -6G-A and -20A-C, which are named by their chromosomal position relative to the start of exon 1. There is evidence for functionality for these AGT variants, through their effects on basal transcription rate (-6G-A19, -20A-C 20) and plasma AGT concentration (M235T 21). Several previous studies have explored the association of ACE I/D and AGT genetic variants with LVM and/or LVH. Among the studies showing an association, generally it is the ‘D’ allele of the ACE I/D that is found to be associated with higher mean LVM and higher risk of LVH, 5, 13, 22 however many studies show no association. 6, 8, 10–12, 23, 24 Mixed results have been reported for a number of AGT variants: In two studies, the ‘TT’ genotype of the AGT M235T variant was associated with increased LVM or increased risk of LVH, 7, 25 whereas other studies show associations in particular study population sub-groups or with particular gene variant combinations. 9, 15, 26 A study of the effect of the AGT -20A-C variant on LVM among young white men found an association between the ‘AA’ genotype and increased LVM for mildly hypertensive participants.27 The Bogalusa Heart Study reported the common ‘A’ allele of the AGT -6G-A variant was associated with decreased LVM among young African and white adults. 28 Other previous studies show no associations.8 As with most complex traits, epistatic effects (gene-gene interactions) are likely to be present in the development of LVH, providing a possible explanation for disparate findings in candidate gene studies. Epistasis has been previously explored for blood pressure related traits as well as LVH in both human studies and rat models. 24, 29–32 The present study examined whether there is an observable interaction between the ACE I/D (rs4646994) polymorphism and three AGT polymorphisms: -6G-A (rs5051), M235T (rs699), and -20A-C (rs5050), affecting LV mass among 2156 hypertensive participants in the HyperGEN study. Some epistatic effects may be expressed as a synergistic effect, with two or more favorable alleles at different loci combining to create a greater-than-expected favorable outcome, or likewise, two or more unfavorable alleles combining to create a worse-than-expected unfavorable outcome. However, when previous research yields conflicting evidence for a given genetic variant (such as the ACE and AGT variants under investigation here), one may expect that epistatic effects, if present, may be expressed instead as a given allele at one locus being favorable in one background genetic context, whereas being unfavorable in a different genetic context.
Methods
Study Population
The study population was comprised of participants from the population-based Hypertension Genetic Epidemiology Network (HyperGEN). HyperGEN, part of the larger NHLBI Family Blood Pressure Program (FBPP), is a multi-center observational study designed to research the genetic predictors of blood pressure and associated traits. HyperGEN recruited participants from the following groups: a) hypertensive sibships, with at least two siblings having been diagnosed with hypertension before the age of 60 years, in the absence of type 1 diabetes or significant renal dysfunction; b) adult offspring of the hypertensive siblings who were not on antihypertensive treatment; and c) an age-matched, random, unrelated sample of participants from the source population, some of whom were also hypertensive. Hypertension was defined as systolic blood pressure (SBP) ≥140 mm Hg and/or a diastolic blood pressure (DBP) ≥90 mm Hg at two separate clinic visits or current treatment for hypertension. Participants were recruited from four field centers in Salt Lake City, UT; Birmingham, AL; Forsyth County, NC; Framingham, MA; and Minneapolis, MN. A detailed description of the HyperGEN population and study methods has been previously published. 33
Included in these analyses were white and African American hypertensive individuals who had undergone echocardiographic measurement of the outcome of interest (LV mass -LVM), as well as measurement of adjustment covariates (age, gender, field center, body mass index, systolic blood pressure, and the number of antihypertensive medications used), and had available data for at least one of the genetic variants of interest (ACE I/D, AGT -6G-A, AGT -20A-C and AGT M235T). The selection criteria described above yielded 2156 participants between the ages of 20 and 87 years, 60% of whom were women and 63% of whom were African American. Participants were members of 1096 unique families ranging in size from 1 to 7 members, with family relationships including siblings and their offspring only. This research was approved by local Institutional Review Boards, with informed consent collected from all participants.
Phenotype Measurement
The phenotype of interest in this study was LVM, which was measured by two-dimensional echocardiography performed at Field Centers using standardized methods and read at the Cornell Medical Center echocardiography laboratory using a computerized review station as per American Society of Echocardiography recommendations. The variable for LVM used in the analysis was calculated from end-diastolic LV wall thicknesses and chamber dimension using an anatomically-validated formula 34 and was indexed to height in meters2.7. 35 Three successive blood pressure measurements were obtained with participants in a seated position using automated Dinamap devices (Dinamap Model 1846 SX/P; GE Medical Systems, Waukesha, WI), and the mean of the last two measurements was used as the covariate in this analysis. Weight was measured with a balance scale, and height was measured with a vertically mounted ruler while participants stood shoeless. Gender, age, ethnicity, and medication used were all self-reported by the participants.
Genotyping Methods
Following sodium dodecylsulfate cell lysis, a salt precipitation method was used for DNA extraction and purification using commercial Puregene reagents (Gentra System, Inc., Minneapolis, MN). The method used for ACE I/D genotyping was a modification of the process described by Kim et al. 36 The AGT M235T variant, which involves a substitution of a methionine for a threonine at codon 235, was genotyped according to the method described by Russ et al.37 The AGT -6G-A polymorphism was determined with mass spectrophotometry. A whole DNA fragment between nucleotide position -6 and -20 before the transcription start site was vaporized and measured for its mass. The angiotensinogen AGT -6G-A genotypes were defined according to the change in the mass of the fragment.
Statistical Methods
STATA© version 10.0 (STATA Corporation, College Station, Texas, USA) was used for all regression, Hardy-Weinberg equilibrium (HWE) and summary analyses. Linkage disequilibrium (LD) was testing using HaploView version 4.2 (Daly Lab at the Broad Institute, Cambridge, MA, USA). HWE testing was performed in a race-specific manner using chi-square tests and including only one randomly selected member of each family to eliminate familial correlation. We used linear regression methods to test the main effects of each of the four gene variants (the independent variable) one at a time on LVM (the dependent variable), which was modeled as a continuous variable. To test for gene-gene interaction effects, we included the ACE I/D variable along with the AGT -6G-A variable and an (ACE I/D * AGT -6G-A) interaction term in the model. Likewise, we ran separate models to test the (ACE I/D * AGT -20A-C) and the (ACE I/D * AGT M235T) interactions. For each model, mixed linear methods were employed to account for phenotypic correlation between family members. The group variable used in each model was the unique family ID number, of which there were a total of 1096. To adjust for potential confounding, we included age, gender, field center, body mass index, systolic blood pressure and the number of antihypertensive medications as covariates in the models. The adjusted means and standard errors reported were generated using the STATA “adjust” post-estimation command by genotype group. Allele frequencies differed substantially by race for some variants; therefore all analyses were stratified by race (white and African American). Gene variants were modeled as three dummy coded genotype groups, with no linearity assumption for either the main-effect models or the epistatic (gene-gene interaction) models – the test of significance for each main effect was a 2 degree of freedom test whereas for each epistatic effect it was a 4 degree of freedom test. To illustrate using the ACE I/D * AGT -6G-A interaction test as an example, the statistical output would provide coefficients for the following terms (with ACE ‘DD’ and AGT -6 ‘AA’ as the referent group): 1) ACE ‘ID’, 2) ACE ‘II’, 3) AGT -6 ‘AG’, 4) AGT -6 ‘GG’, 5) ACE ‘ID’*AGT -6 ‘AG’, 6) ACE ‘ID’*AGT -6 ‘GG’, 7) ACE ‘II’*AGT -6 ‘AG’, and 8) ACE ‘II’*AGT -6 ‘GG’. The test of interaction would be Ho: all 4 interaction terms (5–8) jointly equal zero, which is a 4 degree of freedom test.
Results
Table 1 provides ethnic- and gender-specific descriptive data and genotype frequencies for the 2156 study participants. The ACE I/D, AGT -6G-A, AGT M235T and AGT -20A-C were all in HWE when tested in a race-specific manner. Table 2 provides a description of how individuals were distributed into families. LD results showed tight linkage disequilibrium between the AGT -6G-A and AGT M235T variants (r2=0.89). There was no evidence of LD between AGT -20A-C and the other AGT variants (r2=0.07 for both tests).
Table 1.
Description of study participants [mean (SD), range]
| White | African-American | |||
|---|---|---|---|---|
| Women | Men | Women | Men | |
| n | 409 | 387 | 892 | 468 |
| Age (years) | 59.3 (9.5), 28–87 | 59.4 (9.9), 20–82 | 51.1 (11.2), 21–84 | 50.7 (10.7), 21–85 |
| BMI (kg/m2) | 31.1 (7.3), 18.3–68.7 | 30.4 (4.6), 20.1–51.5 | 33.9 (7.9), 16.2–73.7 | 30.4 (6.4), 16.5–54.4 |
| SBP (mm Hg) | 129.9 (20.2), 79.5–216 | 131.8 (19.2), 83–206 | 134.1 (22.9), 80.5–231 | 137.7 (21.8), 76–221 |
| DBP (mm Hg) | 67.8 (10.2), 42.5–108 | 76.0 (10.7), 48.5–109.5 | 74.5 (11.3), 39–115.5 | 81.2 (12.3), 41.5–123.5 |
| No. Antihypertensive meds | 1.3 (0.75), 0–5 | 1.4 (0.88), 0–4 | 1.3 (0.89), 0–5 | 1.3 (0.99), 0–6 |
| LVM/ht2.7 (g/m2.7) | 42.3 (9.9), 19.7–74.7 | 42.9 (9.8), 19.5–94.7 | 45.5 (12.8), 17.6–114.0 | 44.5 (11.4), 21.6–101.7 |
| LVIDD | 5.0 (0.5), 3.9–7 | 5.4 (0.5), 4.0–7.6 | 5.1 (0.5), 3.8–8.2 | 5.4 (0.5), 4.0–7.9 |
| PWTD | 0.85 (0.10), 0.5–1.2 | 0.91 (0.09), 0.62–1.2 | 0.88 (0.12), 0.6–1.5 | 0.95 (0.12), 0.6–1.5 |
| RWT | 0.34 (0.05), 0.20–0.57 | 0.34 (0.05), 0.21–0.60 | 0.35 (0.06), 0.21–0.67 | 0.35 (0.05), 0.23–0.57 |
| ACE I/D (n, col. %) | ||||
| DD | 231 (29%) | 508 (38%) | ||
| ID | 400 (50%) | 645 (48%) | ||
| II | 163 (21%) | 187 (14%) | ||
| AGT -6G-A [n (col. %)] | ||||
| AA | 89 (18%) | 649 (74%) | ||
| AG | 240 (49%) | 202 (23%) | ||
| GG | 159 (33%) | 23 (3%) | ||
| AGT -20A-C [n (col. %)] | ||||
| AA | 307 (63%) | 657 (75%) | ||
| AC | 171 (35%) | 208 (24%) | ||
| CC | 10 (2%) | 8 (1%) | ||
| AGT M235T [n (col. %)] | ||||
| TT | 135 (17%) | 973 (72%) | ||
| TM | 389 (49%) | 344 (26%) | ||
| MM | 272 (34%) | 31 (2%) | ||
BMI=body mass index, SBP=systolic blood pressure, DBP=diastolic blood pressure, LVM=left ventricular mass, LVIDD=left ventricular diastolic dimension, PWTD=diastolic posterior wall thickness, RWT=relative wall thickness
Table 2.
Distribution of participants into families – siblings and offspring relationships only
| Family size | Number of families | Total participants |
|---|---|---|
| 1 | 382 | 382 |
| 2 | 485 | 970 |
| 3 | 147 | 441 |
| 4 | 60 | 240 |
| 5 | 12 | 60 |
| 6 | 7 | 42 |
| 7 | 3 | 21 |
| Total | 1096 | 2156 |
Main effect of variants
Table 3 presents the results from tests of the main effect of the ACE and AGT variants on LVM. There was evidence of a positive association between the ‘G’ allele and LVM among white participants for the AGT-6G-A variant. After adjusting for covariates, mean LVM increased with the number of copies of the ‘G’ allele (41.2 for ‘AA’, 42.3 for ‘AG’, and 44.0 for ‘GG’ genotype groups, p=0.03). African American participants also had increasing mean LVM with the ‘G’ allele, but to a lesser extent (44.9 for ‘AA’, 45.3 for ‘AG’ and 46.2 for ‘GG’, p=0.81). There was no evidence of association between any of the other genetic variants and LVM.
Table 3.
Main genotype effects on LVM, adjusted for age, sex, BMI, SBP, field center, number of antihypertensive medications
| White mean LVM/ht2.7 (g/m2.7) (SE), genotype frequency | P-value | African American mean LVM/ht2.7 (g/m2.7) (SE), genotype frequency | P-value | |
|---|---|---|---|---|
|
ACE I/D: DD |
42.1 (0.61), n=231 (29.1%) | 0.46 | 45.6 (0.51), n=508 (37.9%) | 0.09 |
| ID | 43.0 (0.47), n=400 (50.4%) | 44.4 (0.45), n=645 (48.1%) | ||
| II | 42.4 (0.72), n=163 (20.5%) | 45.9 (0.82), n=187 (14.0%) | ||
|
AGT -6G-A: AA |
41.2 (0.92), n=89 (18.2%) | 0.03 | 44.9 (0.45), n=649 (74.3%) | 0.81 |
| AG | 42.3 (0.56), n=240 (49.2%) | 45.3 (0.76), n=202 (23.1%) | ||
| GG | 44.0 (0.69), n=159 (32.6%) | 46.2 (2.20), n=23 (2.6%) | ||
|
AGT -20A-C: AA |
43.1 (0.51), n=307 (62.9%) | 0.39 | 45.0 (0.45), n=657 (75.3%) | 0.35 |
| AC | 41.9 (0.68), n=171 (35.0%) | 45.0 (0.75), n=208 (23.8%) | ||
| CC | 43.3 (2.70), n=10 (2.1%) | 50.5 (3.77), n=8 (0.9%) | ||
|
AGT M235T: TT |
42.1 (0.79), n=135 (17.0%) | 0.41 | 44.9 (0.38), n=973 (72.2%) | 0.40 |
| TM | 42.3 (0.47), n=389 (48.9%) | 45.3 (0.61), n=344 (25.5%) | ||
| MM | 43.2 (0.56), n=272 (34.2%) | 47.6 (2.02), n=31 (2.3%) |
Epistatic effect of variants
Table 4 shows the results from the tests of epistatic (gene-gene interaction) effects after adjustment for covariates. There was evidence of an epistatic effect between ACE I/D and AGT -20A-C on LVM for white participants (p=0.03 for interaction): Among the ACE ‘DD’ participants, those with a copy of the ‘C’ allele for AGT -20A-C had lower mean LVM than the ‘AA’ homozygotes (39.2 for ‘DD/CC’, 39.9 for ‘DD/AC’, 43.9 for ‘DD/AA’), whereas among ACE ‘ID’ and ACE ‘II’ participants there were no significant effects of the AGT -20A-C variant (47.2 for ‘ID/CC’, 43.4 for ‘ID/AC’, 42.6 for ‘ID/AA’; no observations for ‘II/CC’, 41.3 for ‘II/AC’, 43.1 for ‘II/AA’). There was no such effect observed among African American participants, nor were there any epistatic effects observed for the other AGT variants with ACE I/D. Because there were few participants with the ‘CC’ genotype at AGT -20A-C, we repeated the gene-gene interaction analysis after collapsing the ‘AC’ and ‘CC’ groups. The evidence for an epistatic effect remained (p=0.02). These data are shown in Figure 1. Participants with the ACE ‘DD’ genotype combined with a copy of the AGT -20A-C minor ‘C’ allele had a significantly lower LVM than all the groups except for the ACE ‘II’/AGT -20A-C ‘C’ allele group. There were no other differences between groups.
Table 4.
Epistatic effects on LVM*
| ACE I/D | |||
|---|---|---|---|
| DD | ID | II | |
| Whites | |||
| AGT -6G-A AA | 40.6 (1.5), n=30, ab | 41.7 (1.2), n=49, ab | 41.0 (2.7), n=10, abc |
| AG | 40.9 (1.0), n=73, a | 43.6 (0.8), n=117, bc | 41.7 (1.2), n=49, ab |
| GG | 45.8 (1.3), n=45, c | 43.0 (1.0) n=70, abc | 43.9 (1.3), n=43, abc |
| p-value for ACE*AGT--6G-A interaction=0.099 | |||
| AGT -20A-C AA | 43.9 (0.9), n=92, a | 42.6 (0.7), n=142, ab | 43.1 (1.0), n=71, a |
| AC | 39.9 (1.2), n=51, b | 43.4 (0.9), n=89, a | 41.3 (1.5), n=31, ab |
| CC | 39.2 (3.8), n=5, ab | 47.2 (3.7), n=5, ab | NA |
| p-value for ACE*AGT--20A-C interaction=0.033 | |||
| AGT M235T TT | 41.1 (1.3), n=44, a | 42.7 (1.1), n=71, a | 42.1 (2.0), n=20, a |
| TM | 41.2 (0.9), n=109, a | 43.3 (0.7), n=191, a | 41.7 (1.0), n=87, a |
| MM | 43.7 (1.0), n=78, a | 42.6 (0.8), n=138, a | 43.6 (1.2), n=56, a |
| p-value for ACE*AGT-M235T interaction=0.328 | |||
| African Americans | |||
| AGT -6G-A AA | 45.8 (0.7), n=252, a | 44.0 (0.6), n=309, b | 45.7 (1.2), n=72, ab |
| AG | 43.8 (1.2), n=78, ab | 45.8 (1.1), n=85, ab | 46.6 (1.8), n=35, ab |
| GG | 45.2 (4.2), n=6, ab | 48.8 (2.8), n=13, ab | 39.1 (5.0), n=4, ab |
| p-value for ACE*AGT--6G-A interaction=0.080 | |||
| AGT -20A-C AA | 45.5 (0.7), n=258, ab | 44.4 (0.6), n=301, a | 45.3 (1.2), n=82, ab |
| AC | 44.7 (1.2), n=73, a | 44.4 (1.0), n=103, a | 47.3 (2.0), n=28, ab |
| CC | 48.2 (4.9), n=5, ab | 59.0 (7.1), n=2, b | 43.2 (10.2), n=1, ab |
| p-value for ACE*AGT--20A-C interaction=0.464 | |||
| AGT M235T TT | 45.8 (0.6), n=376, a | 43.9 (0.5), n=462, b | 45.8 (1.0), n=128, ab |
| TM | 44.5 (1.0), n=125, ab | 45.4 (0.9), n=164, ab | 46.5 (1.5), n=53, ab |
| MM | 52.1 (4.1), n=7, a | 47.8 (2.6), n=18, ab | 42.0 (4.4), n=6, ab |
| p-value for ACE*AGT-M235T interaction=0.127 | |||
Adjusted for age, sex, BMI, SBP, number of antihypertensive medications, field center. (Mean LVM/ht2.7 in g/m2.7 (SE), n=genotype combination frequency, letters a, b and c indicate which of the 9 genotype combinations differ in their main effect on adjusted LVM from the other combinations – within each group of 9, if the groups share a letter, they do not differ at p<0.05)
Figure 1.
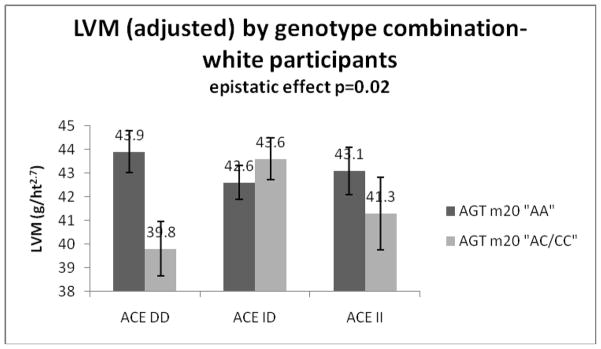
Adjusted LVM (with standard error bars) by genotype combination for white participants, AGT -20A-C collapsed into two categories
Because of the inherent limitations of the way we accounted for phenotypic correlation among family members, (i.e., not all family relationships and structures are the same - some include siblings and their offspring, some include only sibships, etc.), we repeated the analysis for the two suggestive findings (the main effect of the AGT-6G-A variant and the epistatic effect of ACE I/D and AGT -20A-C on LVM among white participants) using a subset of unrelated individuals only – one member of each family. It is encouraging that the results showed effects in the same direction and of very similar magnitude as the effects among the family members (data not shown).
Because of the influence of blood pressure on LVM, we tested whether there was a similar main effect of AGT-6G-A or ACE-AGT -20A-C interaction on systolic (SBP) or diastolic blood pressure (DBP), pulse pressure (calculated as [SBP-DBP]) or pulse pressure divided by stroke volume for white participants. We found no evidence of either the main effect or the epistatic effect for any of these blood pressure measures (data not shown).
Discussion
Using data from the HyperGEN study, an epistatic effect on LVM was observed between ACE I/D and AGT -20A-C among white, but not African American, hypertensive participants. For the white participants, being a minor ‘C’ allele carrier at the AGT -20A-C locus appears to be protective (lower mean LVM) for ACE ‘DD’ homozygotes, with no similar effect among the ACE ‘I’ allele carriers. No epistatic effects were observed for the AGT -6G-A or AGT M235T variants. There was also evidence of a main effect of the AGT -6G-A variant on LVM among white participants, with the ‘G’ allele being associated with a higher mean LVM.
LVM is influenced by many factors, with blood pressure among the most important. We questioned whether the observed main effect or epistatic effect on LVM was mediated through the blood pressure pathway. In other words, we wanted to confirm that the findings for LVM were not a proxy for a ‘true’ blood pressure association. Because we found no similar main effect or epistatic effect for any of the blood pressure measures, we conclude that the main effect of AGT -6G-A or the epistatic effect of ACE I/D and AGT -20A-C on LVM observed among white participants is not accounted for by the effects of these genes on blood pressure; therefore the effect on cardiac structure is likely mediated through some other, potentially tissue-specific, mechanistic pathway.
We are aware of two previous studies examining the epistatic effects of the ACE I/D and AGT variants on LVM, neither of which found evidence of gene-gene interactions. 8, 9 Both studies included fewer than 1000 participants; therefore it is possible that insufficient power to detect interactions may have led to non-significant findings. The HyperGEN study was not a priori powered to detect gene-gene interactions; therefore, all finding reported here must be viewed as exploratory. Because our suggestive findings were restricted to white participants predominately of northwestern European origin, the ethnicity of the participants in previous research is of interest: The two previous studies reporting no epistatic effects recruited participants from Finland, Poland, Russia and Italy.
Evidence of a main effect on LVM was limited to the AGT -6G-A variant. AGT -6G-A is a functional variant found 6 base pairs upstream from the site where transcription of AGT is initiated. The basal transcription rate of the gene is affected by the nucleotide substitution of an adenine for a guanine at this locus. 19, 38 Although the M235T variant is in tight linkage disequilibrium with -6G-A, and there was a similar trend of higher LVM with the ‘M’ allele at M235T observed, the effect was attenuated compared to the effect of -6G-A in our population. Of the four variants analyzed here, only the ACE I/D and AGT M235T were genotyped for the offspring of the hypertensive sibships. We tested whether the main effect of the -6G-A would be replicated for the M235T variant if we excluded the offspring, and it was not. It is unclear why the association found for -6G-A was not found for M235T, but it is not due to the additional offspring genotyped for M235T. Evidence of an epistatic effect was found only for ACE I/D with AGT -20A-C. The ‘D’ allele at the ACE I/D locus is generally considered to be the “higher risk” allele. However, in this study the effect of the ACE I/D variant depended upon the genotype at the AGT -20A-C locus. The AGT -20A-C variant, which involves an adenine to cytosine base change, is located 20 base pairs upstream of the transcription initiation site and has been found to be associated with plasma AGT concentration. 39 When combining the -20A-C minor allele carriers (Figure 1), those with the ACE ‘DD’ genotype and the common AGT -20A-C ‘AA’ genotype had the highest LVM, whereas those with the ACE ‘DD’ genotype and the -20A-C minor ‘C’ allele had the lowest LVM of the ACE/AGT -20A-C combinations.
The main effect and epistatic effect of these genes was observed among white, but not African American participants. The allele frequencies differed considerably between the self-reported white and African American ethnic groups, particularly for the AGT M235T and -6G-A variants. Similar differences have been observed and explored in previous studies, which have concluded that natural selection has generally favored the ‘G’ variant over the ‘A’ variant at the -6G-A locus in non-African populations. 40 However, in our study population the ‘G’ allele was associated with higher LVM for both white, and to a lesser extent African American, participants. The observed allele frequency differences in our study led to a smaller number of African American participants carrying particular allele combinations, which could have diminished our ability to detect an epistatic association.
There are several limitations to this research. The HyperGEN study was not a priori powered to detect gene-gene interactions, and therefore null findings must be interpreted with caution. We conducted multiple statistical tests without correction, and therefore cannot rule out chance as a possible explanation for suggestive findings. A conservative method of correction, such as the Bonferroni method, renders these findings non-significant. However, since our tests are not strictly independent (several variants are within the same gene), this form of correction seems overly stringent. Because our research is limited to four variants, and the ACE and AGT genes contain 26 and 5 exons respectively, this is clearly not a comprehensive examination of potential epistatic effects of these genes. We also restricted our analyses to include only hypertensive participants, therefore the results may not apply to a normotensive population.
This suggestive evidence of epistasis in the development of LVM indicates the complexity of genetic contributions to cardiac structure. It also illustrates the possibility that for complex phenotypes like LVM, it may be difficult to assign one allele the designation “favorable” or “unfavorable” without information about alleles at different loci. For example, for LVM the ‘DD’ genotype at the ACE I/D appears to be favorable if you carry the ‘C’ allele at AGT -20A-C, but unfavorable if you do not, perhaps due to the biologically diverse pathways in which genes act on phenotypes. Examining gene-gene and gene-environment interactions on complex phenotypes such as LVM is challenging work. However, a thorough examination of such interactions may help to shed light on the seemingly conflicting results often reported for single gene variant analyses. Further research into how genes influence phenotypes in the context of other genes will be necessary to move the field forward in the future, and clinically relevant genotype information for complex phenotypes will likely include panels of genes rather than single genes.
Summary Table
What is known about this topic:
|
What this study adds:
|
Acknowledgments
The authors acknowledge David R. Fermin for his preliminary work on data analysis for this project.
Funding: This work was supported by the National Heart Lung and Blood Institute at the National Institutes of Health (NHLBI R01-555673 HyperGEN: Genetics of Left Ventricular Hypertrophy).
Footnotes
Conflict of interest
The authors report no conflicts of interest in regard to this manuscript.
References
- 1.Levy D, Garrison RJ, Savage DD, Kannel WB, Castelli WP. Prognostic implications of echocardiographically determined left ventricular mass in the Framingham Heart Study. N Engl J Med. 1990;322:1561–6. doi: 10.1056/NEJM199005313222203. [DOI] [PubMed] [Google Scholar]
- 2.Savage DD, Levy D, Dannenberg AL, Garrison RJ, Castelli WP. Association of echocardiographic left ventricular mass with body size, blood pressure and physical activity (the Framingham Study) Am J Cardiol. 1990;65:371–6. doi: 10.1016/0002-9149(90)90304-j. [DOI] [PubMed] [Google Scholar]
- 3.Arnett DK, Hong Y, Bella JN, Oberman A, Kitzman DW, Hopkins PN, et al. Sibling correlation of left ventricular mass and geometry in hypertensive African Americans and whites: the HyperGEN study. Hypertension Genetic Epidemiology Network. Am J Hypertens. 2001;14:1226–30. doi: 10.1016/s0895-7061(01)02200-2. [DOI] [PubMed] [Google Scholar]
- 4.Swan L, Birnie DH, Padmanabhan S, Inglis G, Connell JM, Hillis WS. The genetic determination of left ventricular mass in healthy adults. Eur Heart J. 2003;24:577–82. doi: 10.1016/s0195-668x(02)00524-9. [DOI] [PubMed] [Google Scholar]
- 5.Gharavi AG, Lipkowitz MS, Diamond JA, Jhang JS, Phillips RA. Deletion polymorphism of the angiotensin-converting enzyme gene is independently associated with left ventricular mass and geometric remodeling in systemic hypertension. Am J Cardiol. 1996;77:1315–9. doi: 10.1016/s0002-9149(96)00198-1. [DOI] [PubMed] [Google Scholar]
- 6.Gomez-Angelats E, de la Sierra A, Enjuto M, Sierra C, Oriola J, Francino A, et al. Lack of association between ACE gene polymorphism and left ventricular hypertrophy in essential hypertension. J Hum Hypertens. 2000;14:47–9. doi: 10.1038/sj.jhh.1000941. [DOI] [PubMed] [Google Scholar]
- 7.Karjalainen J, Kujala UM, Stolt A, Mantysaari M, Viitasalo M, Kainulainen K, et al. Angiotensinogen gene M235T polymorphism predicts left ventricular hypertrophy in endurance athletes. J Am Coll Cardiol. 1999;34:494–9. doi: 10.1016/s0735-1097(99)00199-0. [DOI] [PubMed] [Google Scholar]
- 8.Kauma H, Ikaheimo M, Savolainen MJ, Kiema TR, Rantala AO, Lilja M, et al. Variants of renin-angiotensin system genes and echocardiographic left ventricular mass. Eur Heart J. 1998;19:1109–17. doi: 10.1053/euhj.1998.0155. [DOI] [PubMed] [Google Scholar]
- 9.Kuznetsova T, Staessen JA, Thijs L, Kunath C, Olszanecka A, Ryabikov A, et al. Left ventricular mass in relation to genetic variation in angiotensin II receptors, renin system genes, and sodium excretion. Circulation. 2004;110:2644–50. doi: 10.1161/01.CIR.0000145541.63406.BA. [DOI] [PubMed] [Google Scholar]
- 10.Lindpaintner K, Lee M, Larson MG, Rao VS, Pfeffer MA, Ordovas JM, et al. Absence of association or genetic linkage between the angiotensin-converting-enzyme gene and left ventricular mass. N Engl J Med. 1996;334:1023–8. doi: 10.1056/NEJM199604183341604. [DOI] [PubMed] [Google Scholar]
- 11.Mayet J, O’Kane KP, Elton R, Johnstone HA, Shahi M, Ozkor MA, et al. Left ventricular hypertrophy, blood pressure and ACE genotype in untreated hypertension. J Hum Hypertens. 1997;11:595–7. doi: 10.1038/sj.jhh.1000491. [DOI] [PubMed] [Google Scholar]
- 12.Moleda P, Majkowska L, Kaliszczak R, Safranow K, Adler G, Goracy I. Insertion/deletion polymorphism of angiotensin I converting enzyme gene and left ventricular hypertrophy in patients with type 2 diabetes mellitus. Kardiol Pol. 2006;64:959–65. discussion 966. [PubMed] [Google Scholar]
- 13.Perticone F, Ceravolo R, Cosco C, Trapasso M, Zingone A, Malatesta P, et al. Deletion polymorphism of angiotensin-converting enzyme gene and left ventricular hypertrophy in southern Italian patients. J Am Coll Cardiol. 1997;29:365–9. doi: 10.1016/s0735-1097(96)00485-8. [DOI] [PubMed] [Google Scholar]
- 14.Saeed M, Siddiqui S, Khan A, Butt ZA, Parvez SH, Frossard PM. Association of ACE polymorphisms with left ventricular hypertrophy. Neuro Endocrinol Lett. 2005;26:393–6. [PubMed] [Google Scholar]
- 15.Tang W, Devereux RB, Rao DC, Oberman A, Hopkins PN, Kitzman DW, et al. Associations between angiotensinogen gene variants and left ventricular mass and function in the HyperGEN study. Am Heart J. 2002;143:854–60. doi: 10.1067/mhj.2002.121926. [DOI] [PubMed] [Google Scholar]
- 16.West MJ, Summers KM, Wong KK, Burstow DJ. Renin-angiotensin system gene polymorphisms and left ventricular hypertrophy. The case against an association. Adv Exp Med Biol. 1997;432:117–22. doi: 10.1007/978-1-4615-5385-4_13. [DOI] [PubMed] [Google Scholar]
- 17.Rigat B, Hubert C, Alhenc-Gelas F, Cambien F, Corvol P, Soubrier F. An insertion/deletion polymorphism in the angiotensin I-converting enzyme gene accounting for half the variance of serum enzyme levels. J Clin Invest. 1990;86:1343–6. doi: 10.1172/JCI114844. [DOI] [PMC free article] [PubMed] [Google Scholar]
- 18.Gaillard-Sanchez I, Mattei MG, Clauser E, Corvol P. Assignment by in situ hybridization of the angiotensinogen gene to chromosome band 1q4, the same region as the human renin gene. Hum Genet. 1990;84:341–3. doi: 10.1007/BF00196230. [DOI] [PubMed] [Google Scholar]
- 19.Inoue I, Nakajima T, Williams CS, Quackenbush J, Puryear R, Powers M, et al. A nucleotide substitution in the promoter of human angiotensinogen is associated with essential hypertension and affects basal transcription in vitro. J Clin Invest. 1997;99:1786–97. doi: 10.1172/JCI119343. [DOI] [PMC free article] [PubMed] [Google Scholar]
- 20.Zhao YY, Zhou J, Narayanan CS, Cui Y, Kumar A. Role of C/A polymorphism at -20 on the expression of human angiotensinogen gene. Hypertension. 1999;33:108–115. doi: 10.1161/01.hyp.33.1.108. [DOI] [PubMed] [Google Scholar]
- 21.Jeunemaitre XSF, Kotelevtsev YV, Lifton RP, Williams CS, Charru A, Hunt SC, et al. Molecular basis of human hypertension: role of angiotensinogen. Cell. 1992;71:169–80. doi: 10.1016/0092-8674(92)90275-h. [DOI] [PubMed] [Google Scholar]
- 22.Kuznetsova T, Staessen JA, Wang JG, Gasowski J, Nikitin Y, Ryabikov A, et al. Antihypertensive treatment modulates the association between the D/I ACE gene polymorphism and left ventricular hypertrophy: a meta-analysis. J Hum Hypertens. 2000;14:447–54. doi: 10.1038/sj.jhh.1001055. [DOI] [PubMed] [Google Scholar]
- 23.Goracy J, Peregud-Pogorzelska M, Goracy I, Kaczmarczyk M, Kornacewicz-Jach Z, Naruszewicz M, et al. Allelic variants of genes: angiotensin I-converting enzyme (ACE), angiotensin-II type 1 receptor (AT1R), methylenetetrahydrofolate reductase and left ventricular mass in patients with myocardial infarction. Pol Arch Med Wewn. 2006;115:105–11. [PubMed] [Google Scholar]
- 24.Perkins MJ, Van Driest SL, Ellsworth EG, Will ML, Gersh BJ, Ommen SR, et al. Gene-specific modifying effects of pro-LVH polymorphisms involving the renin-angiotensin-aldosterone system among 389 unrelated patients with hypertrophic cardiomyopathy. Eur Heart J. 2005;26:2457–62. doi: 10.1093/eurheartj/ehi438. [DOI] [PubMed] [Google Scholar]
- 25.Jeng JR. Left ventricular mass, carotid wall thickness, and angiotensinogen gene polymorphism in patients with hypertension. Am J Hypertens. 1999;12:443–50. doi: 10.1016/s0895-7061(99)00006-0. [DOI] [PubMed] [Google Scholar]
- 26.Kuznetsova T, Staessen JA, Reineke T, Olszanecka A, Ryabikov A, Tikhonoff V, et al. Context-dependency of the relation between left ventricular mass and AGT gene variants. J Hum Hypertens. 2005;19:155–63. doi: 10.1038/sj.jhh.1001793. [DOI] [PubMed] [Google Scholar]
- 27.Ott CST, Hilgers KF, Kreutz R, Schlaich MP, Schmieder RE. Left-ventricular structure and function are influenced by angiotensinogen gene polymorphism (-20 A/C) in young male patients. Am J Hypertens. 2007;20:974–80. doi: 10.1016/j.amjhyper.2007.03.008. [DOI] [PubMed] [Google Scholar]
- 28.Patel DALS, Chen W, Srinivasan SR, Boerwinkle E, Berenson GS Bogalusa Heart Study. G-6A polymorphism of the angiotensinogen gene and its association with left ventricular mass in asymptomatic young adults from a biethnic community: the Bogalusa Heart Study. Am J Hypertens. 2005;18:1137–41. doi: 10.1016/j.amjhyper.2005.05.031. [DOI] [PubMed] [Google Scholar]
- 29.Bell JT, Wallace C, Dobson R, Wiltshire S, Mein C, Pembroke J, et al. Two-dimensional genome-scan identifies novel epistatic loci for essential hypertension. Hum Mol Genet. 2006;15:1365–74. doi: 10.1093/hmg/ddl058. [DOI] [PubMed] [Google Scholar]
- 30.Cicila GT, Morgan EE, Lee SJ, Farms P, Yerga-Woolwine S, Toland EJ, et al. Epistatic genetic determinants of blood pressure and mortality in a salt-sensitive hypertension model. Hypertension. 2009;53:725–32. doi: 10.1161/HYPERTENSIONAHA.108.126649. [DOI] [PMC free article] [PubMed] [Google Scholar]
- 31.Kardia SL, Bielak LF, Lange LA, Cheverud JM, Boerwinkle E, Turner ST, et al. Epistatic effects between two genes in the renin-angiotensin system and systolic blood pressure and coronary artery calcification. Med Sci Monit. 2006;12:CR150–8. [PubMed] [Google Scholar]
- 32.Palijan A, Dutil J, Deng AY. Quantitative trait loci with opposing blood pressure effects demonstrating epistasis on Dahl rat chromosome 3. Physiol Genomics. 2003;15:1–8. doi: 10.1152/physiolgenomics.00084.2003. [DOI] [PubMed] [Google Scholar]
- 33.Williams RR, Rao DC, Ellison RC, Arnett DK, Heiss G, Oberman A, et al. NHLBI family blood pressure program: methodology and recruitment in the HyperGEN network. Hypertension genetic epidemiology network. Ann Epidemiol. 2000;10:389–400. doi: 10.1016/s1047-2797(00)00063-6. [DOI] [PubMed] [Google Scholar]
- 34.Devereux RB, Lutas EM, Casale PN, Kligfield P, Eisenberg RR, Hammond IW, et al. Standardization of M-mode echocardiographic left ventricular anatomic measurements. J Am Coll Cardiol. 1984;4:1222–30. doi: 10.1016/s0735-1097(84)80141-2. [DOI] [PubMed] [Google Scholar]
- 35.de Simone G, Devereux RB, Daniels SR, Koren MJ, Meyer RA, Laragh JH. Effect of growth on variability of left ventricular mass: assessment of allometric signals in adults and children and their capacity to predict cardiovascular risk. J Am Coll Cardiol. 1995;25:1056–62. doi: 10.1016/0735-1097(94)00540-7. [DOI] [PubMed] [Google Scholar]
- 36.Kim DS, Choi SI, Lee HS, Park JK, Yi HK. Determination of human angiotensin converting enzyme (ACE) gene polymorphisms in erectile dysfunction: frequency differences of ACE gene polymorphisms according to the method of analysis. Clin Chem Lab Med. 2001;39:11–4. doi: 10.1515/CCLM.2001.004. [DOI] [PubMed] [Google Scholar]
- 37.Russ AP, Maerz W, Ruzicka V, Stein U, Gross W. Rapid detection of the hypertension-associated Met235-->Thr allele of the human angiotensinogen gene. Hum Mol Genet. 1993;2:609–10. doi: 10.1093/hmg/2.5.609. [DOI] [PubMed] [Google Scholar]
- 38.Jeunemaitre X, Inoue I, Williams C, Charru A, Tichet J, Powers M, et al. Haplotypes of angiotensinogen in essential hypertension. Am J Hum Genet. 1997;60:1448–60. doi: 10.1086/515452. [DOI] [PMC free article] [PubMed] [Google Scholar]
- 39.Ishigami T, Umemura S, Tamura K, Hibi K, Nyui N, Kihara M, et al. Essential hypertension and 5′ upstream core promoter region of human angiotensinogen gene. Hypertension. 1997;30:1325–30. doi: 10.1161/01.hyp.30.6.1325. [DOI] [PubMed] [Google Scholar]
- 40.Nakajima T, Wooding S, Sakagami T, Emi M, Tokunaga K, Tamiya G, et al. Natural selection and population history in the human angiotensinogen gene (AGT): 736 complete AGT sequences in chromosomes from around the world. Am J Hum Genet. 2004;74:898–916. doi: 10.1086/420793. [DOI] [PMC free article] [PubMed] [Google Scholar]