

Abstract
Population stratification leads to a predictable phenomenon—a reduction in the number of heterozygotes compared to that calculated assuming Hardy-Weinberg Equilibrium (HWE). We show that population stratification results in another phenomenon—an excess in the proportion of spouse-pairs with the same genotypes at all ancestrally informative markers, resulting in ancestrally related positive assortative mating. We use principal components analysis to show that there is evidence of population stratification within the Framingham Heart Study, and show that the first principal component correlates with a North-South European cline. We then show that the first principal component is highly correlated between spouses (r=0.58, p=0.0013), demonstrating that there is ancestrally related positive assortative mating among the Framingham Caucasian population. We also show that the single nucleotide polymorphisms loading most heavily on the first principal component show an excess of homozygotes within the spouses, consistent with similar ancestry-related assortative mating in the previous generation. This nonrandom mating likely affects genetic structure seen more generally in the North American population of European descent today, and decreases the rate of decay of linkage disequilibrium for ancestrally informative markers.
Keywords: population stratification, non-random mating, Hardy-Weinberg equilibrium
Introduction
It is well known that population stratification results in a deficiency of heterozygotes compared to that calculated assuming Hardy-Weinberg Equilibrium (HWE), a phenomenon known as the Wahlund Principle. The loss of heterozygosity in a stratified population is exactly 100(1_F)% of that calculated assuming HWE, where F is Wright's coefficient of inbreeding. The Hardy-Weinberg Test (HWT) can be used as a locus-specific test for population stratification by testing for this loss of heterozygosity. However, the HWT fails to differentiate population stratification from genotyping error and consequently has low power to detect population stratification [Lewontin and Hartl, 1991].
We create a multigenerational model of population stratification, and based on our model deduce how population stratification affects the observed distribution of spouse-pair mating types of trios (mother-father and child). Based on these findings, we analyzed spouse-pairs from the Framingham Heart Study (FHS) cohort with the goal of assessing whether there is any evidence of nonrandom mating that would suggest underlying population stratification. We create the Mating Type Distortion Test (MTDT) based on the altered mating type distribution seen in the presence of population stratification and investigate the performance of the MTDT in the presence of genotyping error.
Methods
Notation and Terminology
Consider a stratified population comprised of G separate subpopulations, where G, as well as the actual members of each subpopulation, are unknown (Fig. 1). We assume that there is random mating and HWE within each subpopulation, but no mating between subpopulations. Let wi be the proportion of trios (a proband and both parents) from subpopulation i in the stratified population. Consider a single nucleotide polymorphism (SNP) with alleles A and B, where the A allele is the disease risk allele, and let pi and qi be the respective frequency of the A and the B alleles in subpopulation i. The frequency of the A allele in the stratified population, p̄, is calculated as and the B allele frequency in the stratified population, q̄, is equal to 1 -p̄,. Let μaa, μab and μbb be the respective frequencies of the AA, AB and BB genotypes in the stratified population, where mAA, mAB and mBB are each calculated as , and respectively. Assume symmetry of the mating types, so that the notation AA × AB represents unions of type AA × AB and AB × AA. Let m1, m2, m3, m4, m5, m6 be the respective frequencies of the AA × AA, AA × AB, AB × AB, AB × BB, BB × BB and AA × BB mating types in the stratified population, where m1, m2, m3, m4, m5, m6 are each calculated as shown in Table I. Finally, we assume that the allele frequencies and genotype frequencies remain constant across generations.
Fig. 1.
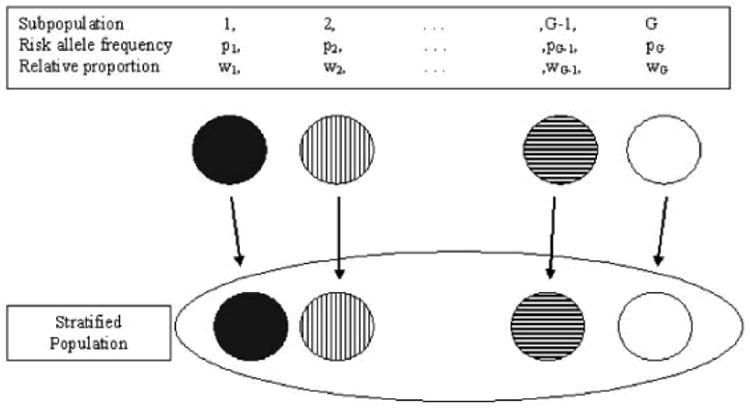
Stratified population.
Table I. Mating type frequencies in the presence of population stratification.
| Mating type | Parameter | Frequency calculated using subpopulation allele frequencies | Frequency calculated using genotypic frequencies and genotypic variances and covariances | Frequency calculated using genotypic frequencies and genotypic variances only | |||
|---|---|---|---|---|---|---|---|
| AA × AA | m1 |
|
|
|
|||
| AA × AB | m2 |
|
|
|
|||
| AB × AB | m3 |
|
|
|
|||
| AB × BB | M4 |
|
|
|
|||
| BB × BB | m5 |
|
|
|
|||
| AA × BB | m6 |
|
|
|
Population Stratification Changes the Genotype and Mating Type Distributions Compared to That Expected Under Random Mating
Change in genotype distribution in the presence of population stratification
If a population is divided into distinct subpopulations, with random mating within each subpopulation, the decrease in the proportion of heterozygotes, as compared to that occurring under random mating of the whole population, is proportional to the variance of the allele frequencies between the subpopulations, where the variance of the risk allele frequencies between subpopulations, Var(pi), is defined as . This is the Wahlund Principle [Elandt-Johnson, 1971; p 229]. We use Wright's coefficient of inbreeding, F, to describe this loss of heterozygosity [Devlin and Roeder, 1999], where F is defined as Var(pi)/p̄(1− p̄).
Change in mating type distribution in the presence of population stratification
The variance of the genotype frequency in the stratified population can be decomposed into two orthogonal variances: the variance of the genotype frequencies within subpopulations and the variance of the genotype frequencies between subpopulations. We define the variance of the AA genotype frequencies between subpopulations, Var(AAi), as , the variance of the BB genotype frequencies between subpopulations, Var(BBi), as and the variance of the AB genotype frequencies between subpopulations Var(ABi) as Var(ABi), as . We show that m1, m2, m3, m4, m5, m6 can be calculated using the genotype frequencies in the stratified population, the variance of the genotype frequencies between subpopulations and the covariance of the genotype frequencies between subpopulations (Table I).
Since Var(AAi), Var(BBi) and Var(ABi) are each greater than or equal to zero, population stratification results in another phenomenon—an increase in the proportion of AA × AA, BB × BB and AB × AB mating types compared to that occurring assuming random mating of the whole population. For example, the increase in the proportion of spouse-pairs in which both mother and father have genotypes AA compared to that calculated assuming random mating is directly proportional to the variance of the AA genotype frequencies between subpopulations. This fact applies when using any genetic markers including SNPs and microsatellites.
The variance of the AB genotype frequency between subpopulations, Var(ABi), can be written as a function of Var(pi), Var(AAi) and Var(BBi) (Supplementary Material I). Therefore m1, m2, m3, m4, m5, m6 can also be calculated using the genotype frequencies in the stratified population, the variance of the genotype frequencies between subpopulations and the variance of the allele frequency between subpopulations as shown in Table I. Four parameters are required to calculate the mating type frequencies in the presence of population stratification: p̄, F or Var(pi), Var(AAi) and Var(BBi); however, only two parameters (p̄ and F) are currently used to describe population stratification. These two parameters are insufficient to calculate the mating type frequencies in the presence of population stratification as they do not capture information present in Var(AAi) and Var(BBi). Yasuda [1968] provided an alternative means of characterizing the mating type frequencies in the presence of population stratification based on the central moments of an allele frequency at a locus, and also showed that the third and fourth central moments of the allele frequency are required for the calculation of the mating type frequencies [Yasuda, 1968]. Our parameterization allows the observer to easily appreciate that population stratification causes an increase in frequency of unions between individuals with the same genotypes compared to random mating. Our parameterization also allows for easy calculation of the maximum-likelihood estimates of Var(AAi), Var(ABi) and Var(BBi) based on the observed mating type counts as shown in Supplementary Material II.
Testing for an Excess in the Proportion of Mating Types between Individuals of the Same Genotypes
The MTDT tests for the second phenomenon seen when there is population stratification—an excess in the proportion of spouse-pairs where both individuals have the same genotypes compared to the proportion calculated assuming random mating. The MTDT tests the null hypothesis {H0:Var(AAi) + Var(ABi) + Var(BBi) = 0}, whereas the HWT tests the null hypothesis {H0:Var(pi) = 0}. These null hypotheses are equivalent because if there is no population stratification, Var(pi), Var(AAi), Var(ABi) and Var(BBi) are each equal to 0.
Consider a random sample of N′ trios (2 N′ parental genotypes, 4 N′ parental alleles) from the stratified population, where there are a′, b′, and c′ individuals in the parental generation with genotypes AA, AB and BB respectively. The maximum-likelihood estimate of the risk allele frequency, p̄′, is (2 a′+b′)/4N′. Let the observed counts of AA × AA, AA × AB, AB × AB, AB × BB, BB × BB and AA × BB mating types in the sample be and respectively, so that . The vector is a six-dimensional multi-nomially distributed random variable with parameters N′, τ1, … , τ6), where 0≤τi≤1 for 0≤i≤6 and . The values τ = (τ1, … , τ5) depend on the null hypothesis and are not equivalent for the MTDT and the HWT.
Under the MTDT null hypothesis of no population stratification, . The observed sample genotype counts are used to derive unbiased estimators of , so that E[(a′(a′ − 1)/2N′(2N′ − 1)] and E[(c′(c′ − 1)/2N′(2N′ − 1)] is .
It will now be shown that the distribution of the MTDT statistic can be approximated by a normal distribution. For this purpose, let Y′ = Y′1,…, Y′5) with Y′i = M′i/N′ for 1≤i≤5 denote the maximum-likelihood estimator of τMTDT = (τMTDT1,…, τMTDT5). It is well known that the asymptotic distribution is multivariatenormal with mean 0 and variance-covariance-matrix Σ∓, where
Let
Then the asymptotic distribution of
Is normal with mean 0 and variance
where and for I = j, and σij=τMTDTiτMTDTj for i≠j. The test statistic for the mating distortion seen in population stratification, Tmtdt, is:
This statistic has an asymptotic standard normal distribution under the null hypothesis. The appropriate test using this statistic is one-sided since we expect an excess of spouse-pairs with the same genotypes under the alternative hypothesis.
Impact of Genotyping Error on the MTDT
There are five types of genotyping errors—missing an allele, misreading an allele, jointly misreading both alleles, adding an allele and pre-gel errors. SNP genotyping error most often occurs when heterozygotes are mistakenly identified by electrophoresis as homozygotes [Leal, 2005]. The majority of these genotyping errors can be detected in trios by checking for Mendelian inheritance inconsistencies [Hosking et al., 2004; Zou et al., 2003]. For simplicity, we consider the most common scenario, where heterozygotes are misclassified as homozygotes, although our results are generalizeable to any model of genotyping error.
Consider the case where K% of heterozygotes are misclassified as homozygotes, so that genotyping error results in a decrease in the observed proportion of heterozygotes compared to that expected by HWE by exactly K%. We assume heterozygotes can be misclassified as AA homozygotes with probability θ or as BB homozygotes with probability 1-θ and that genotyping error is independent between parents. If the parent population is in HWE and randomly mating, then in the presence of genotyping error, we would expect to observe the mating type frequency distribution shown in Table II.
Table II. Population mating type frequencies in the presence of random mating with systematic genotyping error.
| Mating typo | Frequency | |
|---|---|---|
| AA × AA |
|
|
| AA × AB |
|
|
| AB × AB |
|
|
| AB × BB |
|
|
| BB × BB |
|
|
| AA × BB |
|
|
| Total |
|
K denotes the total proportion of heterozygotes that are misclassified as homozygotes. θ is the proportion of misclassified heterozygotes that are classified as AA homozygotes. 1–θ is the proportion of misclassif ied heterozygotes that are classified as BB homozygote.
Analysis of the Framingham Heart Study
All genotyped spouse-pairs in the Framingham Heart Study Affymetrix 100K dataset [Dawber et al.,1957; Cupples et al., 2007] were used to investigate whether we could demonstrate ancestrally based positive assortative mating. The X and Y chromosomes were not considered for the analysis. Principal component (PC) analysis was conducted using the EIGENSTRAT software [Price et al., 2006] on all SNPs with a minor allele frequency greater than 0.05. PCA analysis was carried out after all related individuals and their spouses were removed. In the first analysis, we included four ancestral populations from the HapMap data with African (Yoruba from Nigeria, YRI), Asian (Han Chinese from Beijing, HCB; Japanese from Tokyo, JPT) and European (CEPH trios who are North Americans of European descent from Utah, USA, CEU) to identify the presence of non-European individuals. This analysis showed that all members of the FHS clustered near the CEPH individuals, suggesting that the FHS is composed of individuals of European descent (Supplementary Fig. 1).
In the subsequent PC analyses, we focused only on the FHS cohort. In the second PC analysis, we found that eight SNPs (rs1869829, rs724326, rs10496732, rs6707591, rs961360, rs1042712, rs10496750 and rs562370) loaded heavily on the first principal component (PC1). These SNPs are located at 134.8–137.1Mb on chromosome 2 centered on the lactase (LCT) gene (136.4 -136.5 Mb). It is well known that population stratification exists in North Americans of European descent in a north-south European cline around the LCT gene [Campbell et al., 2005]. To ensure that our results were robust and not affected by this region, we removed these eight SNPs and performed a third PC analysis. The correlation between the first five principal component scores for both members of a spouse-pair was calculated to determine whether there was ancestry-related positive assortative mating (Fig. 2). For the SNPs that loaded most heavily on PC1, we performed both the MTDT for the spouse pairs and a HWT on the spouses combined.
Fig. 2.

Scatterplot of the first principal components in the Framingham Heart Study spouse-pairs.
Results
We analyzed the genotypes of 33 spouse-pairs at 112,991 SNPs in the FHS. The study participants appear to be of European descent, as all study participants clustered near the sample of North Americans of European descent from Utah. In the second PC analysis, the first principal component loaded heavily on eight SNPs on chromosome 2 in the lactase (LCT) gene. It is well known that there is a Northwest-Southeast cline in the frequency of the SNP LCT-13910C-4T within Europeans, suggesting that the first principal component is due to this Northwest-Southeast cline. We repeated the PC analysis including individuals from the HGDP project [Tian et al., 2009] to determine the European origins of the Framingham Heart Study spouse pairs. In Figure II, the subjects who are in the lower left corner, clustered with the North-central European populations and the individuals scattered towards the upper right of the plot clustered with the Middle Eastern populations. There was a strong positive correlation between the first PC values of the spouse-pairs (r50.58, p50.0013). We repeated the PCA after removal of the SNPs in the lactase gene, and found that the positive correlation between the PC1 values of the spouse-pairs persisted and remained significant (r50.56, p50.0018). There was no significant correlation between the PC2 values of the spouse-pairs (r50.17, p50.41). Similarly, the correlations of the third (r50.13, p50.49), fourth (r50.15, p50.40) and fifth (r5_0.10, p50.58) principal components between spouses were not significant.
Because of the spouse correlation of PC1, we expected that the SNPs that loaded most heavily on PC1 would also show some evidence of spouse correlation in the MTDT. We therefore identified three groups of SNPS: those 100 with the most positive loadings on PC1; those 100 with the most negative loadings on PC1; and 100 SNPs in the middle of the distribution with the weakest loadings on PC1. We expected the first two groups to show an excess of positive MTDT statistics, while the third group would act as a control and show no such excess. Our results confirmed this expectation. For the first group of 100 SNPs, the mean of the MTDT statistics was 0.23 with a standard error of 0.094. For the second group of 100 SNPs, the mean of the MTDT statistics was 0.27 with a standard error of 0.105. By contrast, for the third group of (control) SNPs, the mean of the MTDT statistics was -0.01 with a standard error of 0.100. Thus, the results of these MTDT analyses were consistent with the spouse correlation structure observed for PC1.
As noted by Haldane, the HWT is a test for random mating in the prior generation [Haldane, 1954], whereas the MTDT is a test for nonrandom mating in the current generation. We were therefore interested to see whether the same phenomenon of spouse correlation might exist in the previous generation as manifest by homozygote excess in the combined parents for the same two sets of 100 SNPs that loaded most heavily on PC1, but not for the 100 SNPs selected from the middle of the distribution as controls. Indeed, these expectations were confirmed. For the first 100 SNPs, the average value of F (standardized homozygote excess) was 0.08 with a standard error of 0.01. For the second 100 SNPs, the average value of F was 0.08 with a standard error of 0.01. By contrast, for the third (control) set of 100 SNPs, the mean value of F was 0.02 with a standard error of 0.01. Thus, as for the MTDT results, this analysis of genotypes in the parents confirms, perhaps more strongly, that the same ancestry-related assortative mating occurred in the prior generation as well. Thus, we have demonstrated two generations of consistent assortative mating related to ancestry in this population.
Systematic genotyping error (heterozygote or homozygote misclassification) resulted in no increase in the number of AA × AA, AB × AB or BB × BB mating type frequencies compared to that expected assuming random mating. Thus, the MTDT is a useful test because it is immune to systematic genotyping error. The MTDT essentially utilizes the other individual in the spouse pair as a control for genotyping error, and maintains the prespecified Type I error rate, whereas the HWT has increased Type I error rate when there is genotyping error. A large discrepancy between the MTDT and the HWT statistics should be considered indicative of genotyping error.
We also performed both the HWT on spouses combined and the MTDT on spouse pairs for all 112,991 SNPs. After correction for multiple testing, none of the SNPs retained statistical significance for either test. Thus, the power of both tests is modest for detecting population stratification without the prior knowledge of which SNPs are most strongly associated with the population structure.
Discussion
The distribution of the genetic mating type patterns observed in a population can be quite informative for geneticists and clinicians. For centuries agriculturalists have been able to create strains of livestock with certain characteristics by allowing only certain animals to reproduce, thereby affecting the mating type frequency. Observation of the phenotypes of mating unions that occur in nature and the characteristics of their progeny is not a novel concept. These observations have provided information on disease mode of inheritance such as recessive versus dominant diseases and autosomal versus sex-linked diseases in the past [Cotterman and Snyder, 1937]. Distortions in mating type distribution may identify imprinting, non-allelic heterogeneity or may be used to identify disease genes or the genes responsible for traits that individuals desire in mates. However, the mating type distribution can be distorted due to population stratification or other forms of non-random mating.
A positive MTDT statistic could be due to population stratification or could be due to positive phenotypic assortative mating. It is possible to determine the source of the nonrandom mating detected by the MTDT if large numbers of loci are evaluated; for example, from a genome-wide association study, because positive assortative mating is unlikely to involve a large number of loci, whereas population stratification would. In addition, there will be increased linkage disequilibrium (LD) between loci that show the most mating type distortion.
We have shown that population stratification exists in the Framingham population due to ancestrally related positive assortative mating. The generalizability of this finding to other populations remains to be seen. The ancestry-associated assortative mating found here may relate to the ethnic makeup of Framingham, for which the Caucasian population has substantial Italian, Irish, English and German ancestries. We anticipate that other U.S. communities may have similar or differing mating patterns based on the specific local ethnic makeup and history.
This finding has significant ramifications for statistical methods used in population genetics and human evolutionary biology. Positive assortative mating preserves the ancestral d values (where d is the difference in the ancestral allele frequencies) and the variance of ancestral admixture estimates in an admixed population [Risch et al., 2009]. Burrell and Disotell [2009] also note that ancestry-related assortative mating will potentially confound association studies by decreasing the rate of decline of LD between markers over time.
Finally, we note that our analysis was based on a small number of spouse-pairs (33 pairs on average), which strongly limits the power of the HWTand MTDT statistics, but nonetheless was sufficient to demonstrate a spouse correlation in the first principal component defining the genetic structure of Framingham. We also showed that when individual, ancestrally informative markers are obtained, for example, by PC analysis, the power of the individual SNP tests can be substantially increased. Specifically, the HW tests we performed for the top 11 SNPs for the spouses combined were statistically independent of the PC1 correlation and MTDT tests done on the spouse pairs. Those results also documented that the ancestry-related assortative mating we found in the Framingham spouse pairs existed in the prior generation giving rise to the spouse generation.
Supplementary Material
Acknowledgments
Ronnie Sebro was supported by a Howard Hughes Medical Institute Pre-Doctoral Fellowship. Thomas J. Hoffmann was supported by NIH R25CA112355 training grant. The Framingham Heart Study is conducted and supported by the National Heart, Lung, and Blood Institute (NHLBI) in collaboration with Boston University (Contract No. N01-HC-25195). This manuscript was not prepared in collaboration with investigators of the Framingham Heart Study and does not necessarily reflect the opinions or views of the Framingham Heart Study, Boston University, or NHLBI. The authors thank Dr. Nan Laird, Solandra Craig and two anonymous reviewers for their helpful comments.
Contract grant sponsor: Howard Hughes Medical Institute Pre-Doctoral Fellowship.
Footnotes
Additional Supporting Information may be found in the online version of this article.
References
- Burrell AS, Disotell TR. Panmixia postponed: ancestry-related assortative mating in contemporary human populations. Genome Biol. 2009;10:245. doi: 10.1186/gb-2009-10-11-245. [DOI] [PMC free article] [PubMed] [Google Scholar]
- Campbell CD, Ogburn EL, Lunetta KL, Lyon HN, Freedman ML, Groop LC, Altshuler D, Ardlie KG, Hirschhorn JN. 2005 doi: 10.1038/ng1607. [DOI] [PubMed] [Google Scholar]
- Demonstrating stratification in a European American population. Nat Genet. 37:868–872. doi: 10.1038/ng1607. [DOI] [PubMed] [Google Scholar]
- Cotterman CW, Snyder LH. Studies in human inheritance XVII gene frequency analysis of double recessive inheritance involving one autosomal and one sex linked gene. Genetica. 1937;19:537–552. [Google Scholar]
- Cupples LA, Arruda HT, Benjamin EJ, D'Agostino RB, Sr, Demissie S, DeStefano AL, Dupuis J, Falls KM, Fox CS, Gottlieb DJ, Govindaraju DR, Guo CY, Heard-Costa NL, Hwang SJ, Kathiresan S, Kiel DP, Laramie JM, Larson MG, Levy D, Liu CY, Lunetta KL, Mailman MD, Manning AK, Meigs JB, Murabito JM, Newton-Cheh C, GT O'Connor, O'Donnell CJ, Pandey M, Seshadri S, Vasan RS, Wang ZY, Wilk JB, Wolf PA, Yang Q, Atwood LD. The Framingham Heart Study 100K SNP genome-wide association study resource: overview of 17 phenotype working group reports. BMC Med Genet. 2007;8(1):S1. doi: 10.1186/1471-2350-8-S1-S1. [DOI] [PMC free article] [PubMed] [Google Scholar]
- Dawber TR, Moore FE, Jr, Mann GV. Coronary heart disease in the Framingham Study. Am J Public Health. 1957;47:4–24. doi: 10.2105/ajph.47.4_pt_2.4. [DOI] [PMC free article] [PubMed] [Google Scholar]
- Devlin B, Roeder K. Genomic control for association studies. Biometrics. 1999;55:997–1004. doi: 10.1111/j.0006-341x.1999.00997.x. [DOI] [PubMed] [Google Scholar]
- Elandt-Johnson RC. Probability Models and Statistical Methods in Genetics. New York: Wiley; 1971. [Google Scholar]
- Haldane JBS. An exact test for randomness of mating. J Genet. 1954;52:631–635. [Google Scholar]
- Hosking L, Lumsden S, Lewis K, Yeo A, McCarthy L, Bansal A, Riley J, Purvis I, Xu CF. Detection of genotyping errors by Hardy-Weinberg equilibrium testing. Eur J Hum Genet. 2004;12:395–399. doi: 10.1038/sj.ejhg.5201164. [DOI] [PubMed] [Google Scholar]
- Leal SM. Detection of genotyping errors and pseudo-SNPs via deviations from Hardy-Weinberg equilibrium. Genet Epidemiol. 2005;29:204–214. doi: 10.1002/gepi.20086. [DOI] [PMC free article] [PubMed] [Google Scholar]
- Lewontin RC, Hartl DL. Population genetics in forensic DNA typing. Science. 1991;254:1745–1750. doi: 10.1126/science.1845040. [DOI] [PubMed] [Google Scholar]
- Price AL, Patterson NJ, Plenge RM, Weinblatt ME, Shadick NA, Reich D. Principal components analysis corrects for stratification in genome-wide association studies. Nat Genet. 2006;38:904–909. doi: 10.1038/ng1847. [DOI] [PubMed] [Google Scholar]
- Risch N, Choudhry S, Via M, Basu A, Sebro R, Eng C, Beckman K, Thyne S, Chapela R, Rodriguez-Santana JR, Rodriguez-Cintron W, Avila PC, Ziv E, Gonzalez Burchard E. Ancestry-related assortative mating in Latino populations. Genome Biol. 2009;10:R132. doi: 10.1186/gb-2009-10-11-r132. [DOI] [PMC free article] [PubMed] [Google Scholar]
- Tian C, Plenge RM, Ransom M, Lee A, Villoslada P, Selmi C, Klareskog L, Pulver AE, Qi L, Gregersen PK, Seldin MF. Analysis and application of European genetic substructure using 300 K SNP information. PLoS Genet. 2008 Jan;4(1):e4. doi: 10.1371/journal.pgen.0040004. (2008) HYPERLINK http://www.ncbi.nlm.nih.gov/pubmed/18208329. [DOI] [PMC free article] [PubMed] [Google Scholar]
- Yasuda N. An extension of Wahlund's principle to evaluate mating type frequency. Am J Hum Genet. 1968;20:1–23. [PMC free article] [PubMed] [Google Scholar]
- Zou G, Pan D, Zhao H. Genotyping error detection through tightly linked markers. Genetics. 2003;164:1161–1173. doi: 10.1093/genetics/164.3.1161. [DOI] [PMC free article] [PubMed] [Google Scholar]
Associated Data
This section collects any data citations, data availability statements, or supplementary materials included in this article.