

Abstract
Objective:
This study assessed whether high-resolution 7 T MRI allowed direct in vivo visualization of nigrosomes, substructures of the substantia nigra pars compacta (SNpc) undergoing the greatest and earliest dopaminergic cell loss in Parkinson disease (PD), and whether any disease-specific changes could be detected in patients with PD.
Methods:
Postmortem (PM) midbrains, 2 from healthy controls (HCs) and 1 from a patient with PD, were scanned with high-resolution T2*-weighted MRI scans, sectioned, and stained for iron and neuromelanin (Perl), TH, and calbindin. To confirm the identification of nigrosomes in vivo on 7 T T2*-weighted scans, we assessed colocalization with neuromelanin-sensitive T1-weighted scans. We then assessed the ability to depict PD pathology on in vivo T2*-weighted scans by comparing data from 10 patients with PD and 8 age- and sex-matched HCs.
Results:
A hyperintense, ovoid area within the dorsolateral border of the otherwise hypointense SNpc was identified in the HC brains on in vivo and PM T2*-weighted MRI. Location, size, shape, and staining characteristics conform to nigrosome 1. Blinded assessment by 2 neuroradiologists showed consistent bilateral absence of this nigrosome feature in all 10 patients with PD, and bilateral presence in 7/8 HC.
Conclusions:
In vivo and PM MRI with histologic correlation demonstrates that high-resolution 7 T MRI can directly visualize nigrosome 1. The absence of nigrosome 1 in the SNpc on MRI scans might prove useful in developing a neuroimaging diagnostic test for PD.
Many MRI studies have reported Parkinson disease (PD)-associated changes in the substantia nigra (SN).1 However, delineating the boundaries and assessing neurodegeneration in the SN remains challenging.2 Recently developed ultra-high-field MRI systems produce very high spatial resolution T2*-weighted images providing detailed SN morphologic information. Correlation of high-resolution MRI data and histology3 may enable a more precise definition of the boundaries and substructures of the SN in vivo, and hence a more accurate demonstration of PD pathology.
The SN is divided into the pars compacta (SNpc), which is densely packed with neuromelanin-containing dopaminergic cells, and the pars reticulata (SNpr), which is formed by loose aggregations of GABAergic medium and large neurons.4 The majority of neurons in the SNpc project to the neostriatum (putamen and caudate nucleus). Five distinct subgroups of dopamine-containing neurons in calbindin-negative zones within the SNpc, nigrosomes, have been identified using immunostaining for calbindin D28K.5 The largest, nigrosome 1, is lens-shaped and situated along the rostral/caudal axis of the SN in its dorsal part, at caudal and intermediate levels (figure 8 of Damier et al.5; figure e-1 on the Neurology® Web site at www.neurology.org). Postmortem (PM) studies have shown dopaminergic neuronal loss in PD to be higher in the nigrosomes than other SN subregions, with maximal loss (98%) in nigrosome 1.6 These in vivo changes may provide a method for studying the etiology, progression, and detection of PD. Here we investigated the morphologic features of the SN by comparing in vivo 7 T MRI, PM MRI, and histochemical data to identify nigrosomes5 and assess whether they could provide a diagnostic marker to distinguish patients with PD from healthy controls (HC).
METHODS
Standard protocol approvals, registrations, and patient consents.
Subject recruitment and PM sample handling was carried out in accordance with the approval from National Research Ethics Committee and other local guidelines. Written informed consent was obtained from all patients and healthy subjects participating in the study. MRI scans were acquired on a 7 T Philips Achieva scanner using a 32-channel receiver coil, unless otherwise stated.
Three PM midbrains were obtained from the Queen's Medical Centre, Nottingham, 2 from subjects with no known neurologic conditions (HC, 67 and 46 years old) and 1 diagnosed with PD (PD, 75 years old, disease duration 6 years). They were fixed in 10% formalin, washed in 0.9% saline for 24 hours, and placed on an agar bed in a Perspex sphere, which was then filled with saline solution. High-resolution 3D fast field echo (FFE) scans were acquired with echo time (TE)/repetition time (TR) = 15/46 ms, flip angle = 15°, SENSE factor = 1, number of signal averages (NSA) = 20, field of view (FOV) = 90 × 90 × 40 mm3, and 0.3 mm isotropic resolution in 10:22 hours (the first brain was scanned with a 16-channel receiver). Subsequently, the midbrains were sectioned and Perl, TH, and calbindin stains were prepared on adjacent transverse 5-μm-thick slices and digitized using a Hamamatsu NanoZoomer. The high-resolution MRI data, TH, and calbindin maps were registered to the Perl map using a semiautomatic method (Medical Imaging NetCDF tools, Montreal Neurological Institute, Montreal, Canada). Landmark points were manually placed on both images in the corresponding locations and affine transformation was calculated using 9 degrees of freedom (3 rotations, 3 transformations, 3 scales) with additional shear to compensate for tissue deformation during sectioning. The digitized TH and calbindin maps (based on the blue channel that best separated positively and negatively stained regions) were converted from RGB to gray scale (using coefficients specified by the Rec. 601 standard7) and the Perl map was processed using color deconvolution8 to separate the blue contrast corresponding to iron from the brown contrast corresponding to neuromelanin. A mask outlining the brainstem was created, with additional manual segmentation used to remove the background, damaged tissue, small veins visible in the Perl map, and air bubble artifacts. Next, masks of regions that were high in iron, high in neuromelanin, or TH- or calbindin-positive were obtained by thresholding the stain maps and applying manual correction to remove obvious artifacts. These masks were overlaid on the high-resolution T2*-weighted images to compare the characteristics of the different regions of the SN (figure 1). The processing steps are summarized in figure e-2.
Figure 1. Comparison of the histology and postmortem MRI of the substantia nigra in healthy controls and patients with Parkinson disease.

Four samples from 3 brainstems of 2 healthy subjects and 1 parkinsonian subject (HC1, HC2, PD1) containing the substantia nigra at a level below the red nucleus. First 4 rows show pairs of superimposed masks: calbindin with TH (first), iron with TH (second), iron with calbindin (third), and iron with neuromelanin (fourth) (the colored text on the right side indicates the meanings of the colors on the masks). Slice of the 3D MRI dataset (fifth row, 0.3 × 0.3 × 0.3 mm3 voxels) and the same slice with overlapped masks represent the different regions (sixth row). All masks and images were coregistered to the Perl stain image.
To study the SN anatomy in vivo in detail, 2 healthy volunteers (49 and 29 years old) were scanned at 7 T. Volunteers were acquired by institution advertisement. High-resolution T2*-weighted scans were obtained using a 3D FFE sequence with TE/TR = 15/25 ms, flip angle = 12°, SENSE factor = 1, FOV = 180 × 160 × 15 mm3, and 0.3 mm isotropic resolution in 21 minutes. A T1-weighted fast spin echo (FSE) sequence with an off resonance magnetization transfer pre-pulse (MT-T1-weighted) at +1,100 Hz, with TE/TR = 9.0/2,582 ms, NSA = 4, FOV = 180 × 180 × 7 mm3, and 0.6 mm isotropic resolution was also acquired in 7:47 minutes; the contrast in a similar scan at 3 T has previously been ascribed to neuromelanin.9,10 Images were coregistered using FLIRT (FSL, FMRIB, Oxford, UK) and visually examined.
To investigate the possibility of visualizing nigrosome 1 at lower field, 2 healthy volunteers (31-year-old woman and 28-year-old man), acquired by institutional advertisement, were scanned at 3 T using T2*-weighted sequence analogous to the one used in 7 T: resolution 0.43 × 0.43 × 1.5 mm, TR/TE = 300/50 ms, flip angle = 42°, NSA = 5, scanning time 9:57 minutes.
To study differences between patients with PD and HC, 18 subjects (10 PD and 8 age-matched HCs, median/interquartile range: HC = 65/5 years old, PD = 64/5 years old, sex: HC = 6 F:3 M, PD = 4 F:6 M; PD duration = 3±2 years, mean total Unified Parkinson’s Disease Rating Scale on medication = 24 ± 13) were scanned (an additional HC was scanned but was lost to further analysis due to excessive movement). They were scanned using a 2D FFE sequence with TE/TR = 16/385 ms, α = 40°, FOV = 180 × 160 × 16 mm3, 0.35 × 0.35 × 1.0 mm3 resolution, 10 minutes acquisition. All patients with PD were diagnosed clinically on fulfillment of the UK PD Brain Bank clinical criteria11 and all had shown a clinically appropriate response to dopaminergic therapy at time of recruitment to this study. Patients were prospectively recruited from a single movement disorder service by N.B. over a 12-month period; controls were similarly recruited from friends/family members attending the same service. A senior neuroradiologist and neuroradiology training fellow, blinded to the clinical conditions and to each other's decisions, examined the T2*-weighted datasets to classify the subjects according to the presence or otherwise of a hyperintense ovoid substructure within the dorsal/posterior hypointense midbrain region, later identified as nigrosome 1. To classify a dataset as showing this structure, it had to be visible on both sides of the SN, be present on at least 2 adjacent axial slices, be surrounded for more than half its boundary by hypointensity, not be part of a perivascular space, and to extend below the red nucleus (RN).
RESULTS
Four histology samples containing the SN at a level below the RN were chosen (3 from HC and 1 from PD). Color-coded maps of areas of high iron, neuromelanin, TH, and calbindin were created from binary masks of the stains (figure 1). In HC samples superposition of the TH (red) and calbindin (blue) masks allowed a calbindin-negative region colocalized with dopaminergic cells (TH positive) inside a larger calbindin-positive area to be identified (figure 1, first row); a region with this staining and similar size and location was previously defined as nigrosome 1.5 The same area showed low iron (figure 1, second row: TH and iron, third row: calbindin and iron), and high neuromelanin (figure 1, fourth row: iron and neuromelanin), and corresponded to the hyperintense substructure visible in the PM T2*-weighted data, although PM MRI scans showed more laminar structure in the SN compared to the in vivo scans (figure 1, sixth row). The high iron on the Perl stain area (yellow) overlapped with the T2*-weighted hypointense regions in the lateral part of the SN (figure 1, sixth row). Regions with high neuromelanin content did not overlap with regions of high iron (comparing Perl [yellow], TH [red], and neuromelanin [purple]), or T2*-weighted hypointensity.
For the PD sample, a calbindin-negative zone corresponding to the nigrosome 1 was again present (figure 1, fourth column) and partially overlapped with a larger T2*-weighted hyperintense region, although it was neither TH-positive nor high in neuromelanin. T2*-weighted hypointense areas were similar to if slightly more diffuse than those in HC, but high iron areas based on the Perl stain were smaller. TH-positive regions were colocalized with high neuromelanin and smaller compared to HCs.
In 2 HCs, ultra-high-resolution T2*-weighted images were acquired in vivo to improve characterization of the hyperintense ovoid substructure (nigrosome 1) (figure 2, left). This substructure corresponded to a region of hyperintensity on MT-T1-weighted FSE images (figure 2, right and left coregistered).
Figure 2. Nigrosome 1 in vivo in iron- (T2*-weighted) and neuromelanin- (MT-T1-weighted) sensitive 7 T MRI.
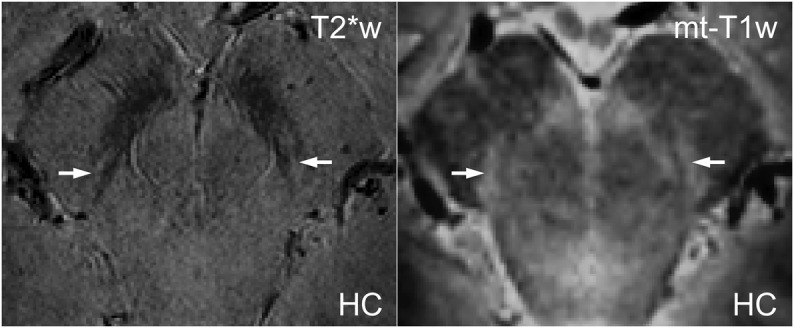
Example of 2 coregistered, high-resolution, in vivo images of a healthy control (HC) (49 years old) shows the substantia nigra and nigrosome 1 (white arrows). In the T2*-weighted image (left, 0.3 × 0.3 × 0.3 mm3 voxels), the nigrosome is hyperintense due to its low iron content; in the MT-T1-weighted sequence (right, 0.6 × 0.6 × 0.6 mm3 voxels), the nigrosome is hyperintense due to its high neuromelanin content.
In vivo high-resolution T2*-weighted images of HCs at 7 T clearly showed a hyperintense ovoid substructure within the dorsal hypointense midbrain region, medial to the cerebral peduncles (figure 3). This feature could also be seen on 3 T images acquired at slightly lower resolution and substantially lower signal-to-noise ratio.
Figure 3. Nigrosome 1 in high-resolution T2*-weighted in vivo MRI: 7 T vs 3 T.
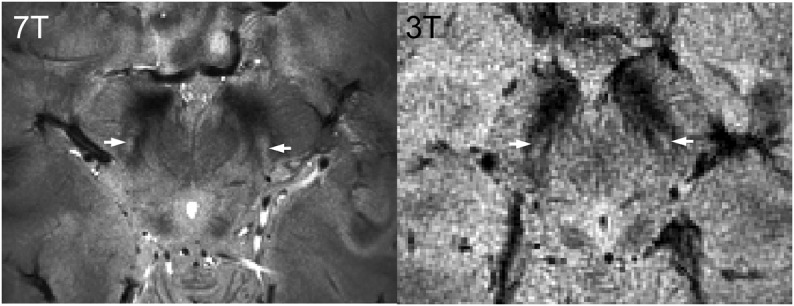
T2*-weighted images obtained in 7 T (0.35 × 0.35 × 1.00 mm3 voxels, left, 65 years old) and 3 T (0.43 × 0.43 × 1.5 mm3 voxels, right, 31 years old) on a healthy subject show the hyperintense structure that we have identified as nigrosome 1 (white arrows) within the hypointense region of the midbrain.
The hyperintense substructure in the dorsal SN corresponding to nigrosome 1 could generally be detected in vivo in HCs using 7 T high-resolution (0.35 × 0.35 × 1.0 mm3) T2*-weighted images acquired in a clinically feasible imaging time (figure 4, top row; figure e-1). Neuroradiologists blinded to the clinical status of the subjects were able to independently correctly classify 7/8 HC and 10/10 PD on the basis of the presence or absence of nigrosome 1 (one dataset not of diagnostic quality due to subject motion).
Figure 4. Substantia nigra in in vivo T2*-weighted 7 T MRI, nigrosome 1: Present in healthy controls, absent in Parkinson disease.

Example slices taken from the in vivo T2*-weighted scans (0.35 × 0.35 × 1.00 mm3 voxels) show the substantia nigra in healthy controls (HC, top row) and patients with Parkinson disease (PD, bottom row). Nigrosome 1 (white arrow) is visible in all HC, but no patients with PD.
DISCUSSION
This study unequivocally identified an ovoid, hyperintense feature, embedded within the dorsal, hypointense, midbrain region of the SN on high-resolution in vivo T2*-weighted 7 T MRI scans of HCs as nigrosome 1. This MRI feature was recently reported by another group, who speculated that it might correspond to a nigrosome.12 We coregistered PM MRI and histology data to show that this substructure has high TH, high neuromelanin, and low calbindin content, thus fulfilling the definition by Damier et al.5 of nigrosome 1. In the PD sample, this calbindin-low region was not high in neuromelanin or TH-positive, confirming the loss of neuromelanin-containing cells in nigrosome 1 as presented previously.6 Importantly, in a small clinical study, we demonstrated the consistent absence of this MRI feature in patients with PD in vivo, which could be a consequence of neuronal cell loss, a neuromelanin loss, an increase in iron content within the nigrosome, a change in iron oxidation state, or a combination of these effects. This could be investigated by studying other patient groups who show iron accumulation without dopaminergic cell loss in this area. The HC misclassified by both raters as “probable PD” may have elevated iron due to other factors or may have presymptomatic PD; in a similar manner, about 10% of elderly HCs show alterations of echogenicity in transcranial sonography consistent with PD.13 The consistent loss of the nigrosomal T2* hyperintensity in all studied patients with PD suggests that this might potentially provide clinically useful diagnostic accuracy; larger studies are needed to confirm this.
The literature on the change of iron content in the SN in PD is inconsistent. Some PM studies reported greater age-related increases in iron content in PD than HC for ferritin-bound iron,14 total iron, and iron (III).15 Mössbauer spectroscopy and colorimetry-based studies found total iron concentration to be unchanged or lower in PD, with a possible increase in non-ferritin-bound iron.16 In vivo MRI studies tend to suggest iron accumulation in the SN with age17 and in PD,18,19 but without distinguishing the form of iron; since it is known that the relaxivity of iron (III) ferric ions is about 10 times greater than that of iron (II),20 changes in T2* could simply reflect changes in the oxidation state of iron. The lower iron content in the Perl stain of the PD sample found here may be due to the fixation time being longer for the PD sample compared to the HC samples (≈2 vs 1 year).21,22 The mismatch between the hypointensity observed on the T2*-weighted MRI and Perl stains is interesting. Since the Perl stain is sensitive only to iron (III), this could be due to higher iron (II) content in PD brains, which could relate to the fixation process, but would also be consistent with increased oxidative stress due to ferrous iron in PD.16
Motion was not a major problem in this study, affecting data only from 1/19 subjects. If the T2*-weighted scan was the primary outcome of a scanning session then the protocol could be modified to reduce the effects of motion, for instance by motion tracking or by over acquiring the data.23
T2*-weighted MRI provides excellent contrast in the midbrain due to its high iron content.24–26 Previous magnetic resonance work has focused mostly on localizing and measuring characteristics of the whole SN26–28 or distinguishing the SNpc and SNpr,28,29 although there has been some inconsistency in the definition of boundaries and subareas of the SN in both the magnetic resonance and histologic literature. In many previous MRI studies, the boundaries of the SN and changes in PD have often been defined with reference to the high-iron, T2*-weighted hypointense region.12,26,29 Our comparison of the Perl stain and PM T2*-weighted scan in HC confirmed the expected sensitivity of T2*-weighted MRI to iron, but closer inspection of the histology data shows that the high-iron region cannot be used to delineate the SN boundary. This does not affect the validity of previous MRI results regarding changes in the size, shape, or intensity of the high-iron region in PD, but questions its interpretation as corresponding to the SN.
In HC, the SNpc is mainly depicted as T2*-weighted hypointense, MT-T1-weighted hyperintense, high iron, low TH, and high calbindin region, but incorporating a dorsal T2*-weighted hyperintense, low iron, high TH, and low calbindin subregion (nigrosome 15). As far as we are aware this is the first study to determine that nigrosome 1 is a low iron structure. The SNpr, located lateral to the SNpc, overlapped with high iron, T2*-weighted hypointense region, but information about the neuronal projections, from diffusion tensor MRI, is needed to exactly define its boundaries.27,28 The signal characteristics of nigrosome were similar to an area ascribed to the ventral tegmental area (VTA) and depicted as a T2*-weighted hyperintense, TH-positive, iron-negative region lying adjacent to the RN (VTA, A1030). This area is also hyperintense on T2*-weighted and MT-T1-weighted scans in vivo, and lies medial to the SNpc. The subthalamic nucleus was not analyzed since the area studied was limited to the levels below the RN.
The PM characteristics of the SN in the PD sample differed in 2 ways. First, the region of nigrosome 1 was TH-negative and low in neuromelanin, consistent with loss of neuromelanin-containing dopaminergic cells. Second, the iron content in the Perl stain was surprisingly low, which is probably an artifact of the longer fixation time of the PD sample.20,21 The T2*-weighted hypointensity was somewhat larger than the Perl stain region, but this loss of iron may also explain why the region including nigrosome 1 was hyperintense on PM MRI in PD, in contrast to results observed in vivo.
Visual comparison of the TH stain, neuromelanin-containing cells in the Perl stain, and the MT-T1-weighted and T2*-weighted high-resolution in vivo scans provides further evidence that the MT-T1-weighted scan is indeed sensitive to neuromelanin.9,10 The 7 T scan used here is less specific to neuromelanin than previously reported at 3 T since it shows hyperintensity in the CSF, probably due to enhanced inflow effects due to the smaller slab thickness (8 mm, 5 slices). The reason why the neuromelanin-rich region is hyperintense on MT-T1-weighted scans is unclear, but possibly neuromelanin directly shortens the T1 of both the bound and free proton pools leading to rapid recovery of MT saturation and an increase in T1-weighted signal.
This study had several limitations. First, the sample size is small and these results will need to be tested in clinical populations who are being investigated for possible PD. Second, further quantitative analyses are necessary to determine whether the nigrosome could provide a noninvasive biomarker of PD progression, which might be useful in future therapeutic trials, or for distinguishing idiopathic PD from other parkinsonian conditions. Third, the low iron content in the Perl stain of the PD sample was paradoxical and indicates that future studies should use PM samples with similar fixation times.21,22,31 Finally, it was difficult to distinguish between the SNpc and VTA, as both contain dopaminergic, neuromelanin-pigmented cells, but they can be separated based on the anatomical location, cell density (which is lower in VTA), or using the issuing fibers of the third cranial nerve as landmarks for VTA.
This study identifies the substructure of the SNpc that is visible on 7 T T2*-weighted images12 as nigrosome 1.5 This feature is not observed in patients with PD, suggesting that it could potentially provide a simple, sensitive, and specific diagnostic tool for PD, but future longitudinal, quantitative studies are needed to show whether it can provide a disease progression biomarker.
Supplementary Material
Acknowledgment
The authors thank Carly Thorp and Katherine Fowkes for help with the histology preparations, and the Medical Research Council and Engineering and Physical Sciences Research Council for funding this work.
GLOSSARY
- FFE
fast field echo
- FOV
field of view
- FSE
fast spin echo
- HC
healthy controls
- MT
magnetization transfer
- NSA
number of signal averages
- PD
Parkinson disease
- PM
postmortem
- RN
red nucleus
- SN
substantia nigra
- SNpc
substantia nigra pars compacta
- SNpr
substantia nigra pars reticulata
- TE
echo time
- TR
repetition time
- VTA
ventral tegmental area
Footnotes
Supplemental data at www.neurology.org
AUTHOR CONTRIBUTIONS
Anna I. Blazejewska: study design, literature search, data collection, data analysis, interpretation of results, figures, and writing the paper. Stefan T. Shwarz: patient recruitment, interpretation of results, and writing the paper. Alain Pitiot: data analysis. Mary C. Stephenson: data collection. James Lowe: histology and interpretation of results. Nin Bajaj: patient recruitment and interpretation of results. Dorothee P. Auer: study design, patient recruitment, interpretation of results, and writing the paper. Richard W. Bowtell: interpretation of results. Penny A. Gowland: study design, data collection, data analysis, interpretation of results, and writing the paper. Guarantor: Penny A. Gowland.
STUDY FUNDING
Supported by Medical Research Council and Engineering and Physical Sciences Research Council (grant number: RA27EY).
DISCLOSURE
The authors report no disclosures relevant to the manuscript. Go to Neurology.org for full disclosures.
REFERENCES
- 1.Lehéricy S, Sharman MA, Santos CLD, Paquin R, Gallea C. Magnetic resonance imaging of the substantia nigra in Parkinson's disease. Mov Disord 2012;27:822–830 [DOI] [PubMed] [Google Scholar]
- 2.Auer DP. In vivo imaging markers of neurodegeneration of the substantia nigra. Exp Gerontol 2009;44:4–9 [DOI] [PubMed] [Google Scholar]
- 3.Massey LA, Yousry TA. Anatomy of the substantia nigra and subthalamic nucleus on MR imaging. Neuroimaging Clin N Am 2010;20:7–27 [DOI] [PubMed] [Google Scholar]
- 4.Haines DE. Fundamental Neuroscience for Basic and Clinical Applications. Philadelphia: Churchill Livingstone Elsevier; 2006 [Google Scholar]
- 5.Damier P, Hirsch EC, Agid Y, Graybiel AM. The substantia nigra of the human brain I: nigrosomes and the nigral matrix, a compartmental organization based on calbindin D 28K immunohistochemistry. Brain 1999;122:1421–1436 [DOI] [PubMed] [Google Scholar]
- 6.Damier P, Hirsch EC, Agid Y, Graybiel AM. The substantia nigra of the human brain II: patterns of loss of dopamine-containing neurons in Parkinson's disease. Brain 1999;122:1437–1448 [DOI] [PubMed] [Google Scholar]
- 7.Baron S, Wood D. Rec. 601—the origins of the 4:2:2 DTV standard. In: EBU Technical Review. Grand-Saconnex, Switzerland: European Broadcasting Union; 2005:1–11 [Google Scholar]
- 8.Ruifrok AC, Johnston DA. Quantification of histochemical staining by color deconvolution. Anal Quant Cytol Histol 2001;23:291–299 [PubMed] [Google Scholar]
- 9.Sasaki M, Shibata E, Kudo K, Tohyama K. Neuromelanin-sensitive MRI. Clin Neuroradiol 2008;18:147–153 [Google Scholar]
- 10.Schwarz ST, Rittman T, Gontu V, Morgan PS, Bajaj N, Auer DP. T1-weighted MRI shows stage-dependent substantia nigra signal loss in Parkinson's disease. Move Disord 2011;26:1633–1638 [DOI] [PubMed] [Google Scholar]
- 11.Huges AJ, Daniel SE, Kilford L, Lees AJ. Accuracy of clinical diagnosis of idiopathic Parkinson's disease: a clinico-pathological study of 100 cases. J Neurol Neurosurg Psychiatry 1992;5:181–184 [DOI] [PMC free article] [PubMed] [Google Scholar]
- 12.Kwon DH, Kim JM, Oh SH, et al. Seven-Tesla magnetic resonance images of the substantia nigra in Parkinson disease. Ann Neurol 2012;71:267–277 [DOI] [PubMed] [Google Scholar]
- 13.Berg D. Hyperechogenicity of the substantia nigra: pitfalls in assessment and specificity for Parkinson's disease. J Neural Transm 2011;118:453–461 [DOI] [PubMed] [Google Scholar]
- 14.Griffiths PD, Dobson BR, Jones GR, Clarke DT. Iron in the basal ganglia in Parkinson's disease: an in vitro study using extended X-ray absorption fine structure and cryo-electron microscopy. Brain 1999;122:667–673 [DOI] [PubMed] [Google Scholar]
- 15.Sofic E, Riederer P, Heinsen H, et al. Increased iron (III) and total iron content in post mortem substantia nigra of parkinsonian brain. J Neural Transm 1988;74:199–205 [DOI] [PubMed] [Google Scholar]
- 16.Friedman A, Galazka-Friedman J, Koziorowski D. Iron as a cause of Parkinson disease: a myth or a well established hypothesis? Parkinsonism Relat Disord 2009;15(suppl 3):212–214 [DOI] [PubMed] [Google Scholar]
- 17.Haacke EM, Cheng NYC, House MJ, et al. Imaging iron stores in the brain using magnetic resonance imaging. Magn Reson Imaging 2005;23:1–25 [DOI] [PubMed] [Google Scholar]
- 18.Minati L, Grisoli M, Carella F, Simone TD, Bruzzone MG, Savoiardo M. Imaging degeneration of the substantia nigra in Parkinson disease with inversion-recovery. AJNR Am J Neuroradiol 2007;28:309–313 [PMC free article] [PubMed] [Google Scholar]
- 19.Lotfipour AK, Wharton S, Schwarz ST, et al. High resolution magnetic susceptibility mapping of the substantia nigra in Parkinson's disease. J Magn Reson Imaging 2012;35:48–55 [DOI] [PubMed] [Google Scholar]
- 20.Gore JC, Kang YS, Schulz RJ. Measurement of radiation dose distributions by nuclear magnetic resonance (NMR) imaging. Phys Med Biol 1984;29:1189–1197 [DOI] [PubMed] [Google Scholar]
- 21.Scharg M, Dickson A, Jiffry A, Kirsch D, Vinters HV, Kirsh W. The effect of formalin fixation on the levels of brain transition metals in archived samples. Biometals 2010;23:1123–1127 [DOI] [PMC free article] [PubMed] [Google Scholar]
- 22.Gellein K, Flaten TP, Erikson KM, Aschner M, Syversen T. Leaching of trace elements from biological tissue by formalin fixation. Biol Trace Elem Res 2008;121:221–225 [DOI] [PubMed] [Google Scholar]
- 23.Maclaren J, Lee KJ, Luengviriya C, Speck O, Zaitsev M. Combined prospective and retrospective motion correction to relax navigator requirements. Magn Reson Med 2011;65:1724–1732 [DOI] [PubMed] [Google Scholar]
- 24.Ordidge RJ, Gorell JM, Deniau JC, Knight RA, Helpern JA. Assessment of relative brain iron concentrations using T2-weighted and T2*-weighted MRI at 3 Tesla. Magn Reson Med 1994;32:335–341 [DOI] [PubMed] [Google Scholar]
- 25.Cho Z, Kim Y, Han J, et al. New brain atlas: mapping the human brain in vivo with 7.0 T MRI and comparison with Postmortem histology: will these images change modern medicine? Int J Imaging Syst Technol 2008;18:2–8 [Google Scholar]
- 26.Cho Z, Oh S, Kim J. Direct Visualization of Parkinson's disease by in vivo human brain imaging using 7.0T magnetic resonance imaging. Move Disord 2011;26:713–755 [DOI] [PubMed] [Google Scholar]
- 27.Menke RA, Scholz J, Miller KL, et al. MRI characteristics of the substantia nigra in Parkinson's disease: a combined quantitative T1 and DTI study. Neuroimage 2009;47:435–441 [DOI] [PubMed] [Google Scholar]
- 28.Menke RA, Jbabdi S, Miller KL, Matthews PM, Zarei M. Connectivity-based segmentation of the substantia nigra in human and its implications in Parkinson's disease. Neuroimage 2010;52:1175–1180 [DOI] [PubMed] [Google Scholar]
- 29.Eapen M, Zald DH, Gatenby JC, Ding Z, Gore JC. Using high-resolution MR imaging at 7T to evaluate the anatomy of the midbrain. AJNR Am J Neuroradiol 2011;32:688–694 [DOI] [PMC free article] [PubMed] [Google Scholar]
- 30.Mai JK, George P. The Human Nervous System, 2nd ed Philadelphia: Elsevier; 2004 [Google Scholar]
- 31.Bagnato F, Hametner S, Yao B, et al. Tracking iron in multiple sclerosis: a combined imaging and histopathological study at 7 Tesla. Brain 2011;134:3602–3615 [DOI] [PMC free article] [PubMed] [Google Scholar]
Associated Data
This section collects any data citations, data availability statements, or supplementary materials included in this article.