

Summary
Purpose
Electrical stimulation (ES) is used during intracranial electroencephalography (EEG) investigations to delineate epileptogenic areas and seizure-onset zones (SOZs) by provoking afterdischarges (ADs) or patients’ typical seizure. High frequency oscillations (HFOs—ripples, 80–250 Hz; fast ripples, 250–500 Hz) are linked to seizure onset. This study investigates whether interictal HFOs are more frequent in areas with a low threshold to provoke ADs or seizures.
Methods
Intracranial EEG studies were filtered at 500 Hz and sampled at 2,000 Hz. HFOs were visually identified. Twenty patients underwent ES, with gradually increasing currents. Results were interpreted as agreeing or disagreeing with the intracranial study (clinical-EEG seizure onset defined the SOZ). Current thresholds provoking an AD or seizure were correlated with the rate of HFOs of each channel.
Results
ES provoked a seizure in 12 and ADs in 19 patients. Sixteen patients showed an ES response inside the SOZ, and 10 had additional areas with ADs. The response was more specific for mesiotemporal than for neocortical channels. HFO rates were negatively correlated with thresholds for ES responses; especially in neo-cortical regions; areas with low threshold and high HFO rate were colocalized even outside the SOZ.
Discussion
Areas showing epileptic HFOs colocalize with those reacting to ES. HFOs may represent a pathologic correlate of regions showing an ES response; both phenomena suggest a more widespread epileptogenicity.
Keywords: Ripple, Fast ripple, Electrical stimulation, Seizure-onset zone
Despite advances in drug therapy, 20–40% of epileptic patients develop medically refractory epilepsy. In patients with focal epilepsy, surgery aiming to remove the area of seizure onset can lead to a seizure-free condition. Inconclusive presurgical evaluation of the localization of the seizure-onset zone (SOZ) may, however, require investigation with intracranial electroencephalography (iEEG) to determine the surgical area (Diehl & Lüders, 2000).
During intracranial investigation, electrical stimulation (ES) is used for two purposes: first, to map critical cortical functional areas, and, second, to delineate epileptogenic areas (Penfield & Jasper, 1954; Gloor, 1975). For the latter, identifying areas of low afterdischarge (AD) thresholds and inducing a patient’s habitual aura or seizure help to determine which structures are part of the seizure-generating network (Penfield & Jasper, 1954; Wieser, 1983; Bernier et al., 1987). The value of ES in presurgical assessment is not universally recognized. Some studies have established a clear concordance between spontaneous and electrically induced seizures (Cherlow et al., 1977; Wieser et al., 1979) or showed the value of ES in predicting surgical outcome (Bernier et al., 1990; Schulz et al., 1997). Other studies, however, have demonstrated that evoked clinical events do not always originate from the SOZ (Halgren, 1982) or that threshold for ADs could be higher in the diseased hippocampus than in the healthy one (Cherlow et al., 1977). In addition, ADs, especially those with propagation, often occur remotely from the SOZ and might localize it inaccurately (Blume et al., 2004). In general it was observed that lower stimulation currents are needed when stimulating mesial temporal than neocortical structures, as the hippocampus shows responses at lower current (Bernier et al., 1990; Blume et al., 2004). This may be related to the susceptibility of the mesial temporal structures to develop seizures.
In our presurgical intracranial investigations we use ES to gain additional information on the extent of the SOZ; the findings often corroborate the rest of the investigation, but remote responses to ES and contradictory results occur and their relevance remains unclear.
High frequency oscillations (HFOs) recorded from iEEG, have recently attracted the attention of epileptologists. First described in mesial temporal structures and recorded with microwires (Bragin et al., 1999, 2002), these fast oscillations have also been recorded in neocortical structures and with macroelectrodes (Urrestarazu et al., 2007; Jacobs et al., 2008a). Two types of events are distinguished: ripples (80–250 Hz) and fast ripples (FRs, 250–500 Hz). Ripples occur during physiologic processes such as memory consolidation (Draguhn et al., 2000), but occurrence of both ripples and FRs were clearly linked to pathologic epileptogenic tissue (Bragin et al., 2002, 2004; Jacobs et al., 2008a); They are more frequent in the SOZ (Bragin et al., 2002; Jirsch et al., 2006) but can be linked to epileptogenic lesions (Staba et al., 2007; Jacobs et al., 2008b). Measuring HFOs is a promising way to localize the SOZ, especially for patients showing poorly defined epileptogenicity during iEEG.
This study aimed to correlate clinical and electrical responses to ES with interictal HFOs. For this purpose, we first analyzed the different types of stimulation responses and their correlation with the SOZ. Areas in which the stimulation response overlapped the SOZ and areas where no concordance was found were examined in regard to their HFO rates. We hypothesized that HFOs occur more frequently in areas with low stimulation threshold for triggering ADs and habitual seizures, independent of the overlap of these areas with the SOZ. The presence of HFOs and stimulation responses in areas distinct from the SOZ might reveal other epileptogenic areas.
Methods
Patient selection
Between September 2004 and March 2008, 47 patients underwent iEEG in our institution. The decision to perform ES was taken independent of this study by the clinical neurophysiologist investigating the patient. Exclusion criteria for ES were usually the following: technical problems with electrodes and inability of the patient to describe evoked responses due to cognitive impairment or to participate in the study due to anxiety or acute illness. As a result of these criteria, 20 patients underwent intracranial ES and all were included in this study.
This study was approved by the Montreal Neurological Institute and Hospital Research Ethics Committee and all patients signed an informed consent.
Recording methods
Electrodes were implanted stereotactically using an image-guidance system (SSN Neuronavigation System, Mississauga, Ontario, Canada). Depth electrodes were placed according to the methods of Olivier et al. (1994). Intracranial depth electrodes were manufactured on site from stainless steel wires. A 10/1,000-inch wire was used as a central core and wrapped with a 3/1,000-inch steel wire. Each electrode strand had nine contacts, with the deepest contact (contact 1) consisting of the unwrapped tip of the steel core. This contact had an uninsulated length of 1 mm, whereas all other contacts (2–9) were formed from stripped sections of the marginal wire that was tightly wound to create 0.5-mm–long coils. The effective surface area for contact 1 was 0.80 mm2 and 0.85 mm2 for contacts 2–9. Depth contacts were constructed independent of the target structure, and the measured impedances were similar in all brain structures, below 10 kOhm. iEEG was recorded using Harmonie (Stellate, Montreal, Canada), low-pass filtered at 500 Hz and sampled at 2,000 Hz. We recorded electrooculography (EOG) and electromyography (EMG) to facilitate sleep staging. The recording was performed referentially with an epidural reference electrode placed in the parietal lobe of the hemisphere least likely to include the main focus. Analyses were performed on bipolar montages.
Channels selection and sampling
All electrode contacts without any prolonged artifacts and clearly located within the brain were retained. We analyzed interictal samples of slow-wave sleep lasting 5–10 min (Zelmann et al., 2009). Sleep stages were determined using EEG, EOG, and EMG: We calculated spectral trends with a 30-s resolution in the delta band in iEEG channels with no or minimal epileptic activity, and the power of the chin EMG. EEG sections with high delta and low EMG power were reviewed to confirm that they were slow wave sleep, defined by at least 25% delta activity by visual inspection of 30-s epochs. To reduce the influence of seizures, segments were selected if they were at least 6 h before and after a seizure.
Marking spikes and HFOs
We selected and visually marked 5 min of slow wave sleep in all patients. The first minute of EEG of each patient was marked by two reviewers (JJ and MZ) separately, and the concordance between marked events was assessed using Cohen’s kappa coefficient for each channel. The concordance between reviewers was calculated for spikes, ripples, and FRs separately. Both observers jointly reviewed the events in channels with kappa below 0.5 (Landis & Koch, 1977) and established a consensus on which events to retain. Based on this consensus, the remaining 4 min of EEG were marked by one of the reviewers. Those 5 min were considered to provide a stable rate of HFOs if shorter intervals provided the same relative information as the 5-min intervals and if the ranking of channels with respect to HFO rates remained stable. The difference in information gain was measured by the Jensen-Shannon divergence, and the change in the ranking of channels was assessed by a ranking distance algorithm (Zelmann et al., 2009). In patients for whom a steady rate was not reached during 5 min, 10 min were marked.
For identifying HFOs, channels were displayed with the maximum time resolution of the computer monitor (0.6 s, 1,200 samples of a signal sampled at 2,000 Hz). The display was split vertically with an 80-Hz high-pass filter on one side and a 250-Hz high-pass filter on the other side, using a finite impulse response (FIR) filter to eliminate ringing. A ripple was marked if an event, between 80 and 250 Hz, was clearly visible on the side of the 80-Hz filter and did not occur or show the same shape on the side of the 250-Hz filter. An event was regarded as a FR if it was visible in the 250-Hz filter. Only events containing at least four consecutive oscillations were regarded as HFOs, and two events were considered distinct when separated by at least two non-HFO oscillations.
Electrical Stimulation
ES was performed with continuous EEG-video monitoring during one or two sessions that lasted 2–4 h, usually at the end of the iEEG investigation and after antiepileptic medication was reinstituted. The aim of ES was to evoke ADs or elicit the patient’s habitual seizures. Six types of responses are observed: AD (including all types of AD, also those confined to the stimulated contact), AD with discharge propagation, AD with clinical manifestations (with or without discharge propagation), auras, and typical and atypical seizures. All contacts were stimulated, except those outside the brain, when they showed extended periods of artifact or when impedances were abnormal, or when stimulation was painful (close to the meninges).
ES was performed using a bipolar montage and applying a biphasic 60-Hz stimulus (pulse width = 0.5 ms) over 3–4 s. This was according to parameters shown to be safe and not causing damage to the brain (Lüders et al., 1987; Gordon et al., 1990). Electrical currents were gradually increased from 0.2–2 mA in mesial temporal and 0.8–10 mA in neocortical regions. Stimulations were repeated every 30–60 s after baseline activity resumed in the EEG, and ES was ended at a pair of contacts if it induced a seizure or if the maximum was reached (2 or 10 mA). All ADs, auras, seizures and any subjective sensations described by the patient, were noted. In the event of a seizure or aura, patients and relatives were asked whether it resembled the habitual clinical events. If the event was typical for the patient it was classified as aura or typical seizure. Ictal events that were unlike the patient’s habitual seizure were named atypical seizure. Subjective unspecific feelings without EEG changes were not included in the present analysis. The category “AD” in the results included all ADs independent of their other features (clinical or propagation); this could overlap with ADs of the categories “AD plus propagation” and “AD plus clinic,” thus resulting in some ADs being evaluated twice as they propagated and were accompanied by clinical manifestations. If different current intensities evoked different types of response at the same contact pair, these were analyzed accordingly. For instance, one pair could have three current thresholds if a low current evoked a simple AD, a higher current an AD plus propagation, and an even higher current an AD plus clinic. The clinical neurophysiologist judged whether the stimulations results agreed or disagreed with the rest of the intracranial study and the localization of the SOZ.
Statistical analysis
All responses and the current threshold needed to induce them were analyzed. Thresholds to evoke ADs with and without propagation, seizures, and auras were correlated with the rates of ripples and FRs in the channels showing the response (Spearman coefficient, p < 0.05). This was performed over the entire patient group for all channels together and after separating mesiotemporal from neocortical channels to account for the different electrical currents applied to these areas. Channels, which were stimulated but showed no stimulation response after the maximum current, were given a current threshold of 40 mA for statistical analysis.
In the next step, all electrode contacts were classified into four groups (Fig. 1) according to their location inside or outside the SOZ and to the presence of a stimulation response:
Figure 1.

This figure demonstrates the concept of the four different groups of channels used for statistical comparison. On the left, a situation that would have been rated as complete agreement; and on the right, one with partial disagreement.
Epilepsia © ILAE
Group 1: contacts in SOZ with stimulation response (agreement).
Group 2: contacts in SOZ without stimulation response (disagreement).
Group 3: contacts outside SOZ without stimulation response (agreement).
Group 4: contacts outside SOZ with stimulation response (disagreement).
The SOZ was defined as the contacts showing the first ictal activity either preceding, or at the onset of, clinical ictal symptoms during the intracranial EEG recordings. The SOZ was marked independent of the present study by the clinical neurophysiologist. In patients with seizures from different locations, all contacts within the separate SOZs were classified as SOZ contacts. This classification was undertaken because stimulation responses and HFOs are more frequent in the SOZ. We expected a high rate of HFOs in areas of low threshold for stimulation response, which does not answer the question of whether there is a true relationship between stimulation response and HFO rate. Therefore, we studied if this relation also existed in areas of disagreement between SOZ and stimulation response.
For groups 1 and 4, with a stimulation response, we calculated the correlation between the current threshold and HFO rates. For all four groups, rates of HFOs were then compared by Wilcoxon rank-sum tests to evaluate whether significant differences in HFO rate distributions could be found between groups (significance level, p < 0.05). Given the lack of normality of the data, we used nonparametric tests and report median values of rates for all the analyses.
Results
We present first the results of the ES study and their correlation with the SOZ. Then, rates of HFOs and their location are presented. Finally, correlation between ES responses and HFOs are described in two steps, first by looking at all evaluated contacts and then only those with disagreement between SOZ and stimulation response.
Patients and stimulation responses (Table 1)
Table 1.
Electrode positions, SOZ, and ES responses in 20 patients
| Pts. | Electrode positions | No. of electrodes | Ictal onset (SOZ) | AD | Clinical response (seizure or aura) |
|---|---|---|---|---|---|
| 1 | L HC, A, PHC, TP | 4 | L HC, A, PHC | Several AD + P over L-A, HC and PHC; one response over L TP | TS/L PHC |
| 2 | L PHC, OF, C | 3 | Middle cont. L-PHC | AD middle cont. L-OF and L-C | Aura/inner cont. L-C |
| 3 | L-OF, L-C, L-Le1, L-Le2, R-OF, R-C | 6 | Inner cont of L-Le1 and L-Le2 | AD + P in inner cont of L-Le1 | Aura L-Le1 |
| 4 | L-PHC, L-OT | 2 | Middle cont L-PHC and L-T | AD middle cont L-PHC and L-T | None |
| 5 | L-AC, L-PC, L-OF, R-AC, R-PC, R-OF, R-Le | 7 | Middle cont. of R-OF | AD + P over inner cont. of R-OF | TS/inner cont. R-OF |
| 6 | L-A, L-HC, L-PHC, R-A, R-HC, R-PHC | 6 | L-A, L-HC, L-PHC, R-A, R-HC, R-PHC | AD + P R-HC and R-PH | TS/R-HC |
| 7 | R-A, R-HC, R-PHC, R-OT 1, R-OT 2 | 5 | R-A, R-HC, R-PHC | None | TS/R-A |
| 8 | L-SM, L-IM, L-SPC, L-IPC | 4 | Inner cont. of L-IM and L-SM | AD + P over inner cont. of L-SM | TS/inner cont. of L-IPC |
| 9 | L-A, L-HC, L-infracalcarine, L-supracalcarine | 4 | External cont. L-infracalcarine L-supracalcarine | AD + P Inner cont. L-infracalcarine | Aura/inner cont. L-infracalcarine |
| 10 | L-A, L-HC, L-OF, L-C, L-SMA, R-A, R-HC, R-OF, R-C, R-SMA | 11 | L-A, L-HC, R-A, R-HC | AD + P over L-A AD over L-HC, L-C, R-C |
TS/R-A |
| 11 | L-PHC, L-AG, L-Heschl, L-OT | 4 | Inner cont. L-Heschl | AD + P inner cont of L-Heschl, L-PHC and L-OT | Aura/Inner cont. L-Heschl |
| 12 | R-A, R-HC, R-PHC, R-Heschl gyrus | 4 | R-HC, R-A, R-PHC | AD + P over R-A, R-HC, R-PH | TS/R-PH |
| 13 | L-PH, L-OT, L-PC, L-AC | 4 | Inner cont. of L-SMA and middle cont. of L-PC | Widespread AD + P | Electrographic seizure L-SMA |
| 14 | L-A, L-HC, L-PHC, L-OF, L-AC, L-F(superiorgyrus) | 6 | L-A, L-PHC, L-HC | AD + P over L-A and L-HC | Aura/L-HC |
| 15 | L-A, L-HC, R-A, R-HC, L-OF, L-C, R-OF, R-C | 9 | Inner cont of L-OF | AD + P over R-HC and L-OF | TS inner cont./L-OF |
| 16 | R-A, R-HC, R-PHC, R-anterior nodule, R-posterior nodule | 5 | R-A, R-HC, R-PHC | Widespread AD + P | TS/R-A |
| 17 | L-A, L-HC, L-PHC, R-A, R-HC, R-PHC | 6 | L-A, L-HC, L-PHC, R-A, R-HC, R-PHC | AD + P over inner contacts of R-HC, L-HC | TS/R-HC Aura/L-HC |
| 18 | L-OF, L-C, L-F (2nd gyrus) R-OF, R-C, R-F (2nd gyrus) |
6 | Inner cont. of L-OF and L-F | None | None |
| 19 | L-A, L-HC, L-O, L-OT, R-A, R-HC, R-PHC, R-OT | 8 | L-A, L-HC, L-PHC, R-A, R-HC, R-PHC | AD + P in L-A, L-HC, R-A, R-HC, R-PHC | TS/L-A Aura/R-HC |
| 20 | R-A, R-HC, R-PHC, R-OT, R-O, R-inferior parietal | 6 | R-A, R-HC and inner cont. of R-inferior parietal | Widespread AD + P | Aura/R-HC |
All electrodes were depth contacts. Those electrodes, which were aiming at the mesiotemporal structures, were implanted in a lateral approach.
L, left; R, right; Le, lesion; O, occipital; PC, posterior cingulate; AC, anterior cingulated; F, frontal; AG, angular gyrus; HC, hippocampus; A, amygdala; PHC, para-hippocampus; TP, temporal pole; AD, afterdischarge; AD + P, afterdischarge with propagation; SMA, supplementary motor area; C, cingulate gyrus; OF, orbito-frontal; SM, superior motor; IM, inferior motor; SPC, superior postcentral; IPC, inferior postcentral; TS, typical seizure; cont., contacts; bold indicates the more common SOZ in cases where they was more than one SOZ; AC, anterior cingulate; PC, posterior cingulate; AG, angular gyrus; OT, occipitotemporal junction.
Eleven patients had mesiotemporal SOZ and nine had neocortical, temporal, or extratemporal SOZ, three of which had two independent SOZs (patients 6, 17, and 19). One patient showed no response to ES (patient 18), six only responses in the SOZ, therefore, completely agreeing with the iEEG study, and two only responses outside the SOZ (patients 2 and 5). Eleven patients showed responses inside and outside the SOZ. In total, 100 mesiotemporal channels were stimulated, 63 being inside and 37 outside the SOZ. Of the 482 stimulated neocortical channels, 49 were within the SOZ Forty-three mesiotemporal (43%)and 66 neocortical (13.7%) channels showed a response of any kind.
The most frequent responses were ADs, with those showing propagation more frequent than localized ADs. The occurrence of specific response types and the current threshold that induced the response is shown in Fig. 2 for neocortical and mesiotemporal channels. As expected, the current required to induce a response was lower in the latter. This, however, also may have resulted in more atypical seizures in neocortex, as these occurred with higher currents.
Figure 2.
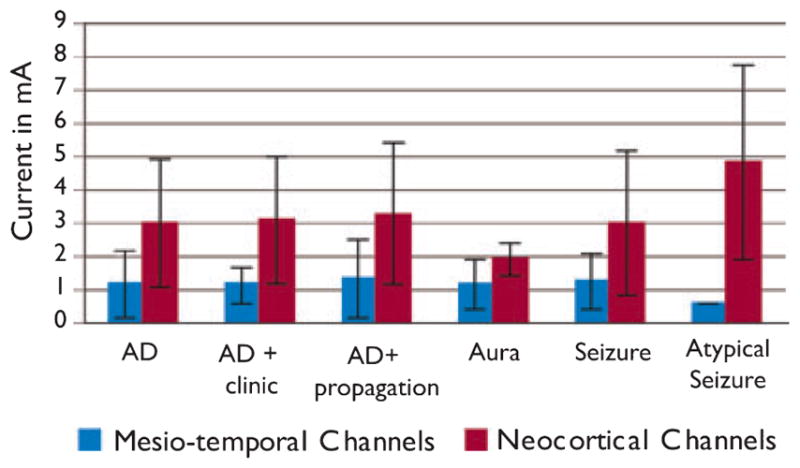
Current thresholds to evoke the different stimulation response types (AD, afterdischarge) in mesiotemporal (blue) and neo-cortical (red) channels. AD gives the results for all ADs together, AD + propagation and AD + clinic are included in this category. Some ADs may be shown in all three categories, as they showed propagation as well as clinical symptoms. In general, larger currents were needed to induce a response in neo-cortical areas.
Epilepsia © ILAE
Correlation between SOZ and stimulation response
Stimulation responses were most frequently observed in the SOZ, independent of the type of response (non-SOZ channels were in the majority, as the SOZ is usually focal and limited to few channels). Figure 3 gives the percentage of SOZ and non-SOZ channels showing a specific type of response. In mesiotemporal channels, a higher percentage of SOZ channels show responses than non-SOZ channels.
Figure 3.
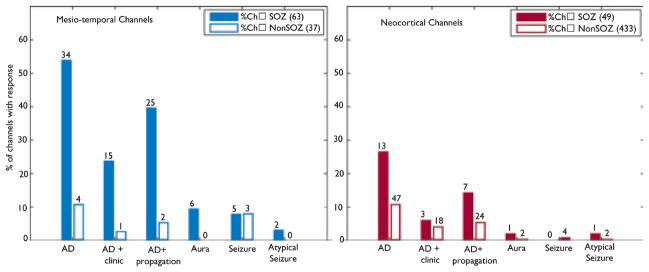
Percentage of channels showing a certain response type (AD, afterdischarge) within the seizure-onset zone (SOZ) (solid bars) and outside the SOZ (open bars). Mesiotemporal channels (left) showed higher percentages and, therefore, a larger overlap between SOZ and stimulation response than neocortical channels (right). Numbers on each bar give the actual number of responses that occurred for each response type.
Epilepsia © ILAE
Neocortical channels also more frequently showed responses in the SOZ than outside. In comparison with mesiotemporal channels, however, the percentage of neo-cortical SOZ channels showing a response was lower. In addition, the absolute number of responses in non-SOZ channels was higher in neocortex than in mesiotemporal regions.
Rates of HFOs
The rate of ripples and FRs was significantly higher in the mesiotemporal than neocortical areas (median rate—ripples: 24.8/min vs. 0.3/min, p < 0.001, FRs: 0.3/min vs. 0/min, p < 0.001; mean rate—ripples: 21.6 ± 47.5 vs. 7.1 ± 20.1/min, p < 0.001, FRs: 3.9 ± 14.7 vs. 0.5 ± 5.1/min, p < 0.001). Both event types were more frequent in the SOZ than outside when looking at neocortical and mesio-temporal structures together (median rate—ripples: 13.3/min vs. 0.3/min, p < 0.001, FRs: 0.2/min vs. 0/min, p < 0.001; mean rate—ripples: 47.4 ± 66.3 vs. 7.1 ± 21.1/min, p < 0.001, FRs: 8.2 ± 20.6 vs. 1 ± 7.1/min, p < 0.001). The difference between SOZ and non-SOZ channels was also significant when looking at mesiotemporal and neocortical structures separately.
There was also a significant difference in event rates between the channels that showed any stimulation response and those that did not (median rate—ripples: 15 vs. 0.3/min, p < 0.001, FRs: 0.1/min vs. 0/min, p < 0.001; mean rate—ripples: 42.9 ± 52.1 vs. 8.3 ± 27.6/min, p < 0.001, FRs: 9.1 ± 22.2 vs. 0.9 ± 5.6/min, p < 0.001). Figure 4 shows an example of interictal HFOs in channels with a stimulation response. These differences were also seen for mesiotemporal and neocortical channels separately.
Figure 4.

An example of channels showing both a stimulation response and interictal high frequency oscillations (HFOs). (A) Electroencephalography (EEG) section after electrical stimulation (ES) of channel LP1-2 (green), with an afterdischarge (AD) plus propagation (orange) to the left hippocampus (LH) and parahippocampus (LP) and to a lesser extend to the left amygdala (LA). (B) Interictal EEG of the same patient at normal time scale. (C) The gray section in B is extended to show the same EEG segment with no filter (left), 80-Hz high-pass filter (middle), and 250-Hz high-pass filter (right). Ripples and fast ripples are visible in the channels with stimulation response (orange).
Epilepsia © ILAE
Correlation between rates of HFOs and stimulation thresholds
There was a negative correlation between the rates of HFOs and current thresholds necessary to evoke a response (Table S1), suggesting that areas producing a high number of HFOs are likely to show a response at low current intensity. This may be expected, since HFOs and stimulation responses are more likely to occur in SOZ channels. Analyzing the data with channels grouped according to their relationship to the SOZ and their stimulation response (Fig. 1) revealed, however, different findings for neocortical and mesiotemporal channels.
Mesiotemporal channels showed a significant negative correlation in group 1 (SOZ/stimulation response), but not for group 4 (non-SOZ/stimulation response) (Table S2A). This correlation was seen between rates of ripples and FRs, and the threshold needed to provoke an AD with or without propagation. On the other hand, neocortical channels showed significant negative correlation for groups 1 and 4, indicating that HFOs are frequent in neocortical areas showing stimulation responses even if they are not part of the SOZ (Table S2B). For group 1, the correlation was observed between ripple rates and the threshold for ADs with propagation and between FR rates and the threshold to evoke seizures. In group 4, rates of ripples and FRs were negatively correlated with the threshold needed for ADs with propagation. Rates of FRs were also negatively correlated with the threshold for auras and seizures.
Rates of HFOs in all channel groups
In this comparison, rates of ripples and FRs of all four groups were compared and an overview of the results is given in Fig. S1. In mesiotemporal lobe channels, ripples and FRs were highest in group 1 (SOZ/stimulation response). They were significantly different than group 3 (non-SOZ/no-response), and were also significantly different in SOZ channels with a response compared to those without (group 1 vs. group 2). FR rates were also significantly different in group 1 compared to group 4 and in group 2 compared to group 3.
Neocortical channels showed a slightly different distribution. Ripples were most frequent in group 1 (SOZ/stimulation response), but group 2 (SOZ/no-response) and group 4 (non-SOZ/response) also showed significantly different rate distribution than group 3 (non-SOZ/no-response). There was no difference between groups 2 and 4. Therefore, no conclusion could be drawn regarding whether high ripple rates indicate the likelihood of a stimulation response or the SOZ. FR rates were significantly different in group 2 compared to group 3 and in group 4 compared to group 3, even though the median was zero for all these groups.
Conclusion
We first observed that there is a good agreement between areas of seizure onset and stimulation responses; this was true for evoked seizures and for ADs. This agreement was stronger for mesiotemporal than for neocortical channels. Secondly, we found that HFOs were negatively correlated with thresholds for stimulation responses, a correlation partly explained by the colocalization between stimulation response and SOZ. In areas outside the SOZ but showing a stimulation response, we also observed a strong negative correlation between FR rates and thresholds for stimulation responses in neocortical channels.
Discussion
This study revealed a reasonably good correlation between the spontaneous SOZ areas and ES responses, whether they consisted of ADs or seizures; this correlation appeared tighter in the mesiotemporal structures compared to neocortex. We also found that rates of HFOs were higher in regions showing a low threshold to ES, which could be in part explained by the colocalization between the SOZ and ES responses, since HFOs are more frequent in the SOZ (Jacobs et al., 2008b). In neocortex, when looking at areas with no overlap between SOZ and ES response, we observed, however, a strong relationship between high FR rates and low threshold for ES. The fact that both phenomena coexist in the same non-SOZ areas may indicate more widespread epileptogenicity.
There has been a controversy over the value of ES in pre-surgical evaluations over the last decades. Although some centers use ES routinely in every iEEG study (Lüders et al., 1987; Bernier et al., 1990; Schulz & Lüders, 2000), in others it is believed that ES provides few significant results and is time-consuming (Halgren et al., 1983; Blume et al., 2004). ES parameters can vary widely. High frequencies at 50–60 Hz are often used with impulse duration between 0.5 and 2 ms and current intensity between 0.25 and 10 mA (Penfield & Jasper, 1954; Bernier et al., 1990; Blume et al., 2004). We use a similar ES protocol for the identification of the SOZ and for functional mapping. We confirmed that evoked seizures during ES resemble spontaneous seizures and are helpful in localizing the SOZ (Penfield & Jasper, 1954; Schulz et al., 1997). Other investigators believe that high-frequency stimulations over long periods change the responses of neuronal networks, as the latter cannot return to resting state between the stimuli, and suggest single-pulse (or low frequency) stimulation instead (Valentín et al., 2005a,b).
Our study shows that the sensitivity of ES to delineate the SOZ seems reasonably high, as only 3 (15%) of 20 patients showed no stimulation response within the SOZ. The absence of a response in these three patients may be related either to the localization of the electrodes or to properties of the neuronal networks. Bernier and coworkers hypothesized that a high correspondence between SOZ and stimulation response depends highly on the type and localization of the electrodes (1990). Others suggested that a large extent of pathologic tissue changes may prevent stimulation responses (Cherlow et al., 1977). The one patient (Patient 18) who did not have any response in this study had electrodes in very gliotic tissue posterior to a surgical cavity. A second patient (Patient 2) showed ADs only at very high threshold outside the SOZ; the SOZ was within gliotic tissue resulting from an anterior temporal resection. The third patient (Patient 5) with no stimulation response within the SOZ had a frontal focal cortical dysplasia and showed ADs only in lesional areas neighboring the SOZ.
In regard to specificity, our stimulation results are harder to interpret. Many patients showed responses outside the SOZ. Both mesiotemporal and neocortical structures had responses in a significantly larger percentage of SOZ than non-SOZ channels, but this difference was lower in the neo-cortex, indicating a lower specificity for these areas. There are different explanations for this phenomenon. First, a healthy neocortex may be more likely to show a stimulation response. This, however, has not been reported, and neocortical stimulation in general requires higher current intensity to provoke a response (Gloor, 1975; Burchiel et al., 1989; Luciano et al., 1993). Secondly, this higher neocortical current may result in false-positive responses (Catapele & Comair, 2000), and responses outside the SOZ may, therefore, simply be the result of the application of higher currents. Nevertheless, many neocortical channels received low current stimulation at the beginning of the study, as often the temporal and neocortical contacts were stimulated consecutively starting with the mesiotemporal contacts and at low currents, and we observed neocortical responses outside the SOZ even with these low intensities. Thirdly, placement of neocortical electrodes is less standardized and spatially restricted than mesiotemporal ones. The SOZ can also be more difficult to define in neocortical areas. It may, therefore, be more difficult to exactly place an electrode within a neocortical SOZ, and to define SOZ contacts in neocortical electrodes. One may conclude that the stimulation responses outside the SOZ in the neocortex resulted from epileptogenic changes.
What can we learn from the additional evaluation of HFOs? Studies in animal models suggested that HFOs, especially FRs, are closely linked to epileptogenic tissue and seizure generation (Bragin et al., 2002, 2004), and in humans both ripples and FRs proved to be predictive of the SOZ (Jacobs et al., 2008a,b). FRs are also linked to lesional changes in patients with hippocampal sclerosis (Staba et al., 2007), although there is evidence that HFOs are not indicative of lesional changes themselves but of the epileptogenic potential of the tissue (Jacobs et al., 2008b). Ripples, however, are also described in healthy hippocampal tissue during memory consolidation (Buzsaki, 2006), and their role in identification of SOZ areas is, therefore, the subject of discussions (Urrestarazu et al., 2007; Engel et al., 2008). In neocortical areas, physiological HFOs have only been described after somatosensory stimulation.
In this study, we first raised the question of whether high rates of HFOs are indicative of the SOZ or of areas reacting to ES and, second, whether additional epileptogenic areas could be delineated by the combination of ES and HFOs. Results for mesiotemporal structures were inconclusive, findings that may be explained by the small number of channels outside the SOZ showing a stimulation response (i.e., group 4). On the other hand, HFOs in the neocortex showed not only high rates in areas where seizure onset and stimulation response overlapped (i.e., group 1) but also in areas with stimulation responses outside the SOZ. As expected, a strong negative correlation exists between rates of HFOs inside SOZ and the threshold to evoke a stimulation response. More interestingly, a similar negative correlation was observed in areas where stimulation responses were found outside the SOZ. Whether this reflects potentially epileptogenic areas cannot yet be answered.
It may also be that one phenomenon, the stimulation response, may directly result from the presence of HFOs. Fast oscillations are hypothesized to result in an imbalance between excitatory and inhibitory interneurons within epileptic tissue. They increase in rate and duration after applying γ-aminobutyric acid (GABA)–receptor antagonists (Bragin et al., 2002; Jones & Barth, 2002). Similar changes in inhibitory circuits may facilitate responses as they do for spontaneous seizures. The final answer to this question may only be given by looking at the long-term postsurgical follow-up of these patients. Nevertheless, the strong spatial overlap between stimulation responses and HFO rates and their negative correlation suggest that these two phenomena result from the same changes in neuronal interaction and epileptic vulnerability of the underlying tissue.
Another important finding in this study is that seizures are not the only response to ES that can identify the SOZ. ADs, in particular those with propagation, showed a higher specificity to the SOZ than did induced seizures, confirming findings in earlier studies (Wieser et al., 1979; Bernier et al., 1990). In addition, in mesiotemporal structures, all induced auras originated from the SOZ, contradicting the findings of Halgren et al. (1978, 1983), who could not observe any correlation between the SOZ and aura-like phenomena. This discrepancy may be related to methodologic differences between the studies, with the cited study using different stimulation parameters with a 10-Hz biphasic pulse, shorter intervals between stimulations, and higher currents to provoke functional responses. As discussed earlier, neocortex generally showed less-specific responses and, in particular, induced-seizures clearly did not locate the SOZ well. In many studies, ADs are classified according to their timing, propagation, and shape (Jasper, 1954; Blume et al., 2004). We did not subdivide ADs in this regard, as this would have reduced the statistical power of each analyzed group and because we did not have any a priori evidence that HFO rates would be dependent on these features. However, we distinguished ADs with propagation from those without, as there has been conflicting evidence regarding ADs, with propagation being more or less accurate in indicating the SOZ (Wyler & Ward, 1981; Blume et al., 2004). The value of ADs has also been questioned, as some patients with bilateral temporal lobe implantations have shown lower thresholds in the less-diseased temporal lobe (Cherlow et al., 1977). We did not find evidence for these observations, and areas of lowest threshold in most cases corresponded well with the SOZ. Again, additional ADs outside the SOZ were often correlated with areas of high HFO rates and may actually provide evidence for underlying pathologic structures.
In conclusion, our findings suggest that ES may add information to the presurgical investigation, but this can only be confirmed by correlation with the postsurgical outcome. In the neocortex, however, widespread stimulation responses suggest epileptogenicity beyond the SOZ. Moreover, areas showing epileptic HFOs colocalize with those reacting to ES. Therefore, both may be independent indicators of similar tissue changes leading to epileptogenicity, or the occurrence of ES responses may actually result from HFOs. Combining the information obtained from ES and measure of HFOs may allow delineating additional epileptogenic areas.
Supplementary Material
Acknowledgments
This project was supported by grant MOP-10189 from the Canadian Institutes of Health Research. JJ received the Preston Robb Fellowship of the MNI. MZ was supported by the NOW, AGIKO-grant no. 92003481, the University Medical Center Utrecht (internationalization grant), and the “Stichting de drie lichten”.
Footnotes
We confirm that we have read the Journal’s position on issues involved in ethical publication and affirm that this article is consistent with those guidelines.
Disclosure: None of the authors has any conflict of interest to disclose.
Additional supporting information may be found in the online version of this article:
Figure S1. (A) Rates of high frequency oscillations (HFOs) in mesiotemporal (left) and neocortical (right) channels for the four different electrode contact groups for ripples (striped color) and fast ripples (solid color). As a result of a large number of channels showing no fast ripples, the median for fast ripples was frequently zero, which is illustrated by the thin line of solid color for fast ripples. Means are given in the results section of this article. (B) Significant differences are shown for temporal (left) and neocortical (right) channels in the form of arrows. The direction of the arrow indicates a larger median value.
Table S1. Correlation between rates of high frequency oscillations (HFOs) and current threshold to evoke a stimulation response. In contrast to Table S2, this table includes all channels that were stimulated. Channels that were not showing any response were given a fixed current threshold of 40 mA.
Table S2A. Correlation between rates of high frequency oscillations (HFOs) and responses in mesiotemporal channels inside and outside seizure-onset zone (SOZ).
Table S2B. Correlation between rates of high frequency oscillations (HFOs) and responses in neocortical channels inside and outside the seizure-onset zone (SOZ).
Please note: Wiley-Blackwell is not responsible for the content or functionality of any supporting materials supplied by the authors. Any queries (other than missing material) should be directed to the corresponding author for the article.
References
- Bernier GP, Saint-Hilaire JM, Giard N, Bouvier G, Mercier M. Commentary: intracranial electrical stimulation. In: Engel J Jr, editor. Surgical treatment of epilepsy. Raven press; New York: 1987. pp. 232–334. [Google Scholar]
- Bernier GP, Richer F, Giard N, Bouvier G, Mercier M, Turmel A, Saint-Hilaire JM. Electrical stimulation of the human brain in epilepsy. Epilepsia. 1990;31:513–520. doi: 10.1111/j.1528-1157.1990.tb06099.x. [DOI] [PubMed] [Google Scholar]
- Blume WT, Jones DC, Pathak P. Properties of after-discharges from cortical electrical stimulation in focal epilepsies. Clin Neurophysiol. 2004;115:982–989. doi: 10.1016/j.clinph.2003.11.023. [DOI] [PubMed] [Google Scholar]
- Bragin A, Engel J, Jr, Wilson CL, Fried I, Mathern GW. Hippocampal and entorhinal cortex high-frequency oscillations (100–500 Hz) in human epileptic brain and in kainic acid-treated rats with chronic seizures. Epilepsia. 1999;40:127–137. doi: 10.1111/j.1528-1157.1999.tb02065.x. [DOI] [PubMed] [Google Scholar]
- Bragin A, Wilson CL, Staba RJ, Reddick M, Fried I, Engel J., Jr Interictal high-frequency oscillations (80–500 Hz) in the human epileptic brain: entorhinal cortex. Ann Neurol. 2002;52:407–415. doi: 10.1002/ana.10291. [DOI] [PubMed] [Google Scholar]
- Bragin A, Wilson CL, Almajano J, Mody I, Engel J., Jr High-frequency oscillations after status epilepticus: epileptogenesis and seizure genesis. Epilepsia. 2004;45:1017–1023. doi: 10.1111/j.0013-9580.2004.17004.x. [DOI] [PubMed] [Google Scholar]
- Bragin A, Azizyan A, Almajano J, Wilson CL, Engel J., Jr Analysis of chronic seizure onsets after intrahippocampal kainic acid injection in freely moving rats. Epilepsia. 2005;46:1592–1598. doi: 10.1111/j.1528-1167.2005.00268.x. [DOI] [PubMed] [Google Scholar]
- Burchiel KJ, Clarke H, Ojemann GA, Dacey RG, Winn HJ. Use of stimulation mapping and corticography in the excision of arteriovenous malformations in sensorimotor and language-related neocortex. Neurosurgery. 1989;24:322–327. doi: 10.1227/00006123-198903000-00002. [DOI] [PubMed] [Google Scholar]
- Buzsaki G. Rhythms of the brain. Oxford University Press; New York: 2006. [Google Scholar]
- Catapele O, Comair YG. Intrasurgical cortical electrical stimulation. In: Lueders HO, Noachtar S, editors. Epileptic seizures: pathophysiology and clinical semiology. Churchill Livingstone; New York: 2000. pp. 172–176. [Google Scholar]
- Cherlow DG, Dymond AM, Crandall PH, Walter RD. Evoked responses and after-discharge thresholds to electrical stimulation in temporal lobe epilepsies. Arch Neurol. 1977;34:527–531. doi: 10.1001/archneur.1977.00500210029003. [DOI] [PubMed] [Google Scholar]
- Diehl B, Lüders HO. Temporal lobe epilepsy: when are invasive recordings needed? Epilepsia. 2000;41(suppl 3):S61–S74. doi: 10.1111/j.1528-1157.2000.tb01536.x. [DOI] [PubMed] [Google Scholar]
- Draguhn A, Traub RD, Bibbig A, Schmitz D. Ripple (approximately 200–Hz) oscillations in temporal structures. J Clin Neurophysiol. 2000;17:361–376. doi: 10.1097/00004691-200007000-00003. [DOI] [PubMed] [Google Scholar]
- Engel J, Bragin A, Staba R, Mody I. High-frequency oscillations: What is normal and what is not? Epilepsia. 2008 doi: 10.1111/j.1528-1167.2008.01917.x. Published online: 2-Dec-2008. [DOI] [PubMed] [Google Scholar]
- Gloor P. Contributions of electroencephalography and electrocorticography to the neurosurgical treatment of the epilepsies. Adv Neurol. 1975;8:59–105. [PubMed] [Google Scholar]
- Gordon B, Lesser RP, Rance NE, Hart J, Jr, Webber R, Uematsu S, Fisher RS. Parameters for direct cortical electrical stimulation in the human: histopathologic confirmation. Electroencephalogr Clin Neurophysiol. 1990;75:371–377. doi: 10.1016/0013-4694(90)90082-u. [DOI] [PubMed] [Google Scholar]
- Halgren E, Walter RD, Cherlow DG, Crandall PH. Mental phenomena evoked by electrical stimulation of the human hippocampal formation and amygdala. Brain. 1978;101:83–117. doi: 10.1093/brain/101.1.83. [DOI] [PubMed] [Google Scholar]
- Halgren E. Mental phenomena induced by stimulation in the limbic system. Hum Neurobiol. 1982;1:251–260. [PubMed] [Google Scholar]
- Halgren E, Walter RD, Crandall PH. Experiential phenomena of temporal epilepsy. Ann Neurol. 1983;14:93–94. doi: 10.1002/ana.410140121. [DOI] [PubMed] [Google Scholar]
- Jacobs J, Levan P, Chander R, Hall J, Dubeau F, Gotman J. Interictal high-frequency oscillations (80–500 Hz) are an indicator of seizure onset areas independent of spikes in the human epileptic brain. Epilepsia. 2008a;49:1893–1907. doi: 10.1111/j.1528-1167.2008.01656.x. [DOI] [PMC free article] [PubMed] [Google Scholar]
- Jacobs J, LeVan P, Châtillon CE, Olivier A, Dubeau F, Gotman J. High Frequency Oscillations in intracranial EEGs mark epileptogenicity rather than lesion type. Brain. 2008b doi: 10.1093/brain/awn351. in press. [DOI] [PMC free article] [PubMed] [Google Scholar]
- Jasper H. Electrocorticography. In: Penfield W, Jasper H, editors. Epilepsy and the functional anatomy of the human brain. Little Brown; Boston, MA: 1954. pp. 692–738. [Google Scholar]
- Jirsch JD, Urrestarazu E, LeVan P, Olivier A, Dubeau F, Gotman J. High-frequency oscillations during human focal seizures. Brain. 2006;129:1593–1608. doi: 10.1093/brain/awl085. [DOI] [PubMed] [Google Scholar]
- Jones MS, Barth DS. Effects of bicuculline methiodide on fast (>200 Hz) electrical oscillations in rat somatosensory cortex. J Neurophysiol. 2002;88:1016–1025. doi: 10.1152/jn.2002.88.2.1016. [DOI] [PubMed] [Google Scholar]
- Landis JR, Koch GG. An application of hierarchical kappa-type statistics in the assessment of majority agreement among multiple observers. Biometrics. 1977;33:363–374. [PubMed] [Google Scholar]
- Luciano D, Devnisky O, Pannizzo F. ECOG during cortical stimulation. In: Devnisky O, Beric A, Dogali M, editors. Stimulation of the brain and spinal cord. Raven Press; New York: 1993. p. 89. [Google Scholar]
- Lüders H, Lesser RP, Dinner DS. Commentary: chronic intracranial recording and stimulation with subdural electrodes. In: Engel J, editor. Surgical treatment of the epilepsies. Raven Press; New York: 1987. pp. 297–321. [Google Scholar]
- Olivier A, Germano IM, Cukiert A, Peters T. Frameless stereotaxy for surgery of the epilepsies: preliminary experience. Technical note. J Neurosurg. 1994;81:629–633. doi: 10.3171/jns.1994.81.4.0629. [DOI] [PubMed] [Google Scholar]
- Penfield W, Jasper H. Epilepsy and the functional anatomy of the brain. Little Brown; Boston: 1954. [Google Scholar]
- Schulz R, Lüders HO. Auras elicited by electrical stimulation. In: Lueders HO, Noachtar S, editors. Epileptic seizures: pathophysiology and clinical semiology. Churchill Livingstone; New York: 2000. pp. 254–259. [Google Scholar]
- Schulz R, Lüders HO, Tuxhorn I, Ebner A, Holthausen H, Hoppe M, Noachtar S, Pannek H, May T, Wolf P. Localization of epileptic auras induced on stimulation by subdural electrodes. Epilepsia. 1997;38:1321–1329. doi: 10.1111/j.1528-1157.1997.tb00070.x. [DOI] [PubMed] [Google Scholar]
- Staba RJ, Frighetto L, Behnke EJ, Mathern GW, Fields T, Bragin A, Ogren J, Fried I, Wilson CL, Engel J., Jr Increased fast ripple to ripple ratios correlate with reduced hippocampal volumes and neuron loss in temporal lobe epilepsy patients. Epilepsia. 2007;48:2130–2138. doi: 10.1111/j.1528-1167.2007.01225.x. [DOI] [PubMed] [Google Scholar]
- Urrestarazu E, Chander R, Dubeau F, Gotman J. Interictal high-frequency oscillations (100–500 Hz) in the intracerebral EEG of epileptic patients. Brain. 2007;130:2354–2366. doi: 10.1093/brain/awm149. [DOI] [PubMed] [Google Scholar]
- Valentín A, Alarcón G, Honavar M, García Seoane JJ, Selway RP, Polkey CE, Binnie CD. Single pulse electrical stimulation for identification of structural abnormalities and prediction of seizure outcome after epilepsy surgery: a prospective study. Lancet Neurol. 2005a;4:718–726. doi: 10.1016/S1474-4422(05)70200-3. [DOI] [PubMed] [Google Scholar]
- Valentín A, Alarcón G, García-Seoane JJ, Lacruz ME, Nayak SD, Honavar M, Selway RP, Binnie CD, Polkey CE. Single-pulse electrical stimulation identifies epileptogenic frontal cortex in the human brain. Neurology. 2005b;65:426–435. doi: 10.1212/01.wnl.0000171340.73078.c1. [DOI] [PubMed] [Google Scholar]
- Wieser HG, Bancoud J, Talairach J, Bonis A, Szikla G. Comparative value of spontaneous and electrically induced seizures in establishing the lateralization of temporal seizures. Epilepsia. 1979;20:47–59. doi: 10.1111/j.1528-1157.1979.tb04775.x. [DOI] [PubMed] [Google Scholar]
- Wieser HG. Electroclinical features of the psychomotor seizure. Butterworth; New York: 1983. [Google Scholar]
- Wyler AR, Ward AA. Neurons in human epileptogenic cortex. J Neurosurg. 1981;55:904. doi: 10.3171/jns.1981.55.6.0904. [DOI] [PubMed] [Google Scholar]
- Zelmann R, Zijlmans M, Jacobs J, Chatillon C, Gotman J. Improving the identification of High Frequency Oscillations. Clin Neurophysiol. 2009;120:1457–1464. doi: 10.1016/j.clinph.2009.05.029. [DOI] [PMC free article] [PubMed] [Google Scholar]
Associated Data
This section collects any data citations, data availability statements, or supplementary materials included in this article.