Abstract
A standard dried-droplet preparation using 2,5-dihydroxybenzoic acid (2,5-DHBA) as the matrix results in a large variation in signal intensity and poor shot-to-shot reproducibility in matrix-assisted laser desorption/ionization (MALDI). We expected that the differences can be attributed to the nature of the crystal structures in the region of the “sweet spot” within the MALDI samples. 2,5-DHBA crystals with and without analytes on a target plate obtained by means of a dried-droplet preparation contain two polymorphs, which can be distinguished by Raman spectra. In comparing the Raman image with the MS image, a clear correlation between the signal distribution of glycopeptides and hydrophilic peptides and the specific crystal form of 2,5-DHBA could be made. The ionization of hydrophobic peptides appears to proceed in both types of polymorphic crystals. In addition, the derivatization of glycopeptides with a pyrene group enabled us to detect glycopeptides regardless the crystal form. As the result, the number of sweet spots increased and MS spectra with a high signal intensity were obtained. The results suggest that the introduction of a hydrophobic/aromatic moiety to glycopeptides results in a more successful MALDI analysis due to the effective incorporation of the analyte into matrix crystals.
Keywords: MALDI, sweet spot, matrix crystal, polymorphism
Introduction
Many areas of matrix-assisted laser desorption/ionization (MALDI) are poorly understood, despite its widespread use. A successful MALDI analysis highly depends on the choice of an appropriate matrix and the sample preparation technique. However, this choice is largely empirical. Solid matrices, especially 2,5-dihydroxybenzoic acid (2,5-DHBA), have been in widespread use for a long time.1) MALDI analyses of glycans and glycopeptides, which are biologically important molecules in the area of post-proteomics, has been mostly performed using 2,5-DHBA as a matrix, due to its “cool” nature and good ionization efficiency.2–6)
In the process of preparing a dried-droplet sample using solid matrices, complex processes such as drying of the solvent, moving of the droplet and crystallization of the matrix occur on the MALDI target plate. In these processes, many factors, including surface tension, lead to an inhomogeneous distribution of the individual crystal size near the rim of the preparations. In general, the quality of a MALDI mass spectrum is highly dependent on the spot that is irradiated by the laser. In other words, MALDI possesses an inherently disadvantageous feature of poor shot-to-shot reproducibility. Signal heterogeneity, which refers to variations in intensity depending on the location of the laser irradiation, forces us to find the so-called “sweet spot” for the acquisition of high quality mass spectra. The cause of the sweet spot has been the subject of discussion and it appears to be the result of an inhomogeneous incorporation of analyte within the crystals of the matrix.7) However, Horneffer et al., using confocal laser scanning microscopy (CLSM), concluded that a fluorescent labeled analyte is homogeneously distributed in the 2,5-DHBA crystals.8) On the other hand, to the contrary, several mass spectrometric imaging studies have clearly demonstrated the inhomogeneous distribution of analyte molecules in 2,5-DHBA crystals.9–12) In particular, Bouschen & Spengler11) and Qiao et al.12) used MALDI imaging at better than a 10 µm spatial resolution to investigate analyte distribution and showed that analytes were segregated in small DHBA crystals in dried-droplet preparations. Such an uneven distribution of analyte would be directly related to the observed signal inhomogeneity. They showed that the segregation correlates with the physico-chemical properties of the analyte, such as hydrophobicity. In addition, the speed of crystallization of the matrix was considered to be key parameter for the appearance and the degree of analyte segregation.
The MALDI technique involves the ionization of an analyte from the crystals of matrix compounds. Hence many attempts have been made to control matrix activity by crystal properties. Such studies have provided important insights about MALDI fundamentals. Most of these studies focused on analyte-matrix interactions8,13–17) because the interaction in the crystals should affect subsequent events, such as the excitation and ionization of analyte molecules. Currently no reliable method exists for distinguishing a crystal with sweet spots from heterogeneous crystals obtained by drying.
In this study, we clearly demonstrate that signal inhomogeneity is highly related to both the crystal structures of 2,5-DHBA and the physico-chemical properties of the analyte. In an attempt to determine the location of sweet spots for glycopeptides in 2,5-DHBA, we noticed that two different crystal forms of 2,5-DHBA are concomitantly generated on the MALDI target plate when the Raman imaging technique is used. Interestingly, the sweet spots for hydrophilic peptides, including hydrophilic glycopeptides, were mostly located on particular dimorphic crystal of 2,5-DHBA. We also demonstrate that the formation of dimorphic crystals of 2,5-DHBA is one of the factors that contribute to the signal inhomogeneity and poor shot-to-shot reproducibility associated with the technique.
Experimental
Materials
The MALDI matrix chemicals, purified 2,5-DHBA was purchased from Shimadzu-biotech (Kyoto, Japan). ACTH fragment 18–39, human serum albumin was purchased from Sigma-Aldrich (Steinheim, Germany). Trypsin Gold (Mass Spectrometry Grade) was purchased from Promega (Madison, WI). The water used in all experiments was purified by using a NANOpure DIAMOND Ultrapure Water Systems from Barnstead (Boston, MA, USA). All other reagents were used without further purification.
Preparation of glycopeptides
The sialylglycopeptide A2-KVANKT (Fig. 1) was prepared from hen’s egg yolk.18) A2-KVANKT was then converted to NA2-IRNKS (Fig. 1) as described previously.19) The stable isotope labeling of NA2-IRNKS was done by β-galactosidase digestion followed by incubation with β-galactosyltrasferase (Takara Bio, 0.8 mU) and UDP-[1,2,3,4,5,6]13C-Galactose (1 nmol) in a sodium phosphate buffer, pH 7.0, overnight.20)
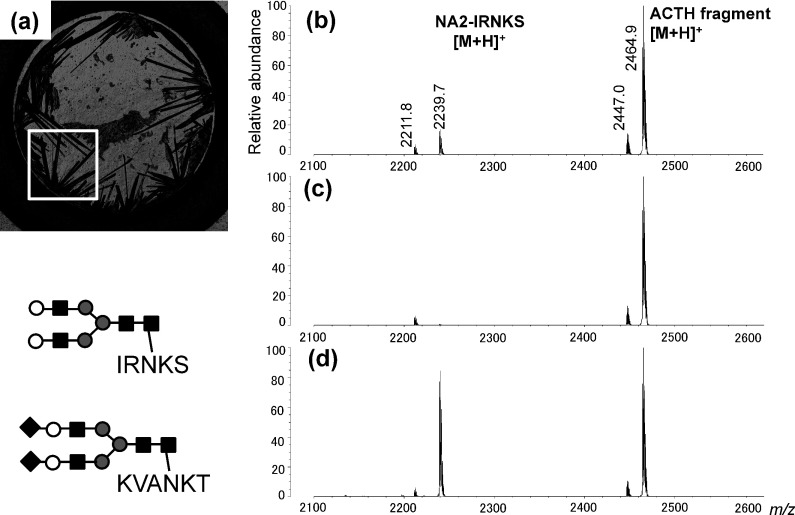
Fig. 1. (a) Confocal laser microscopy image of a sample containing NA2-IRNKS and ACTH fragment 18–39 using 2,5-DHBA as a matrix prepared by the dried-drop method. (b)–(d) Positive-ion mass spectra obtained at three different points in the sample (a). The m/z values of mono-isotopic ions are indicated. The structures of A2-KVANKT and NA2-IRNKS (Mw 2238.9) are shown. Black diamond, N-acetylneuraminic acid; white circle, galactose; black square, N-acetyglucosamine; gray circle, mannose.
Digestion of the protein
Albumin was denatured using RapiGest SF (Waters, Milford, MA) added to a final concentration of 0.1% in 10 mM ammonium bicarbonate containing 10 mM dithiothreitol. The mixture was heated at 100°C for 5 min, and was incubated at 55°C for 45 min. After cooling, 5 µL of 135 mM iodoacetamide was added to the mixture, which was then kept in the dark for 45 min. The mixture was then incubated with 1 µg of trypsin at 37°C overnight. The tryptic digest of albumin was desalted using a PepCleanTM C-18 Spin Column (Pierce, Rockford, IL). The fraction was dried on a Speed Vac.
MALDI sample preparation
Samples for MALDI-TOF MS were prepared using the standard dried-droplet technique. The analyte solution was first deposited on a mirror-polished stainless-steel MALDI target. Pyrene derivatization was then performed as described below, if necessary. Subsequently, 0.5 µL of 2,5-DHBA matrix in a 60% acetonitrile solution (10 mg/mL) was applied to the target and the sample left to dry without active air flow. All the above procedures were done in a clean room, where the temperature (23 degrees) and humidity (50%) are controlled. Before the MS measurements, the samples on the target plate were observed using a LEXT OLS3100 (Olympus, Tokyo, Japan) confocal laser microscope (405 nm) with a ×50 objective.
Pyrene derivatization on the target plate
Dried sample on a target plate was directly derivatized by 1-pyrenyldiazomethane (PDAM, Molecular Probes, Inc., Eugene, OR) as described previously.19) A fresh solution of PDAM at a concentration of 10 nmol/µL in dimethyl sulfoxide was added to the dried sample, and the plate was incubated at 70°C. The plate was rinsed with xylene to remove excess PDAM and dried.
Raman imaging
Raman imaging experiments of MALDI samples before the MS measurements were acquired with the Renishaw inVia Reflex micro-Raman spectrometer operating at a 532 nm excitation wavelength. The line focus laser with 150 mW power directed through a ×20 objective lens at the sample. The spectra were collected at 52 µm steps with exposure times of 2 s.
Mass spectrometry and MS imaging
MALDI-TOF MS spectra were acquired using an AXIMA-QIT instrument consisting of a quadruple ion trap and reflector time-of-flight analyzer (Shimadzu Biotech, Manchester, U.K.). A nitrogen laser (337 nm) was used to irradiate the sample for ionization. Spectra were obtained in the positive-ion mode. The samples were scanned by successive 10 laser shots with a spot-to-spot center distance of 25 µm in each direction to obtain the MS image. The MS data was converted to comma-separated values (CSV) and were visualized as an MS image using the BioMap software. Using BioMap software, the MS image of an analyte was created by selecting the mass range including isotopic peaks (usually, between the m/z at mono-isotopic ion and the m/z plus 4). Black area indicates no analyte signal, whereas the colored areas (blue, red, or white dots) indicate the detection of the analyte signal. The signal intensity of the laser irradiation spot is visualized with a continual scale which makes a dot where the signal is highest brightest.
Results and Discussion
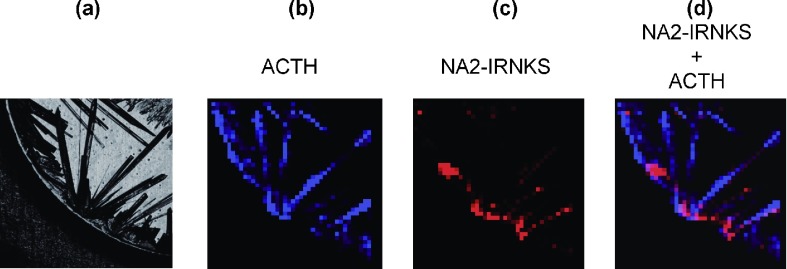
The location of the sweet spot depends on the analyte. Figure 1 shows a typical example of variations in the sweet spot location in the case of a glycopeptide having a hydrophilic peptide and a hydrophobic peptide. Generally, 2,5-DHBA matrix crystals prepared by the dried-droplet method appear at many points around the rim at separate timings and results in a heterogeneous size distribution on the target plate, similar to Fig. 1a. Three mass spectra obtained from three different points in a sample are shown in Figs. 1b–d. The signal heights of the glycopeptide NA2-IRNKS ion at m/z 2239.7 are significantly different between the three mass spectra although the peptide ACTH ion at m/z 2464.9 shows an even signal height on the three points. In the mass spectrum of Fig. 1d, a strong signal was detected for the glycopeptide NA2-IRNKS, but, in Fig. 1c, the signal intensity is less. More detailed MS images are shown in Fig. 2. The signal for protonated ACTH (Fig. 2b) was detected at all locations in the 2,5-DHBA crystals (Fig. 2a). On the other hand, the glycopeptide NA2-IRNKS was detected in more restricted locations on the crystals (Fig. 2c). The sweet spots for the glycopeptide NA2-IRNKS were localized on the rim of crystallized 2,5-DHBA, which was the starting point for crystal formation. Therefore, the number of sweet spots for the glycopeptide NA2-IRNKS is limited compared with that for ACTH (Fig. 2d). The limited signal distribution of NA2-IRNKS appears to be not only due to the presence of ACTH. Even in the case of only NA2-IRNKS without suppression by ACTH, the MS image of NA2-IRNKS was found to have the same characteristics (data not shown). The signal for another glycopeptide NA2-KVANKT that contains a hydrophilic peptide also showed a distribution that was limited to the rim of the crystalized 2,5-DHBA (data not shown). We already found that, in the mixture of glycopeptides, sweet spots were not common between them and the signal distribution was determined by their peptide sequences, while the glycan structure was the same.21) The key issue is that the properties of the peptide are a major factor in signal distribution, whether it contains a glycan or not.
Fig. 2. (a) Enlarged confocal laser microscopy image of the area surrounded with the white line in Fig. 1a. (b) MS image (m/z 2464.9) of a protonated ACTH fragment 18–39 in the same area. The black area indicates no signal and a blue dot with a stronger signal is shown more brightened. (c) MS image (m/z 2239.7) of protonated NA2-IRNKS in the same area. The black area indicates no signal and a red dot with a stronger signal is shown more brightened. (d) The overlay images b and c.
This suggests that hydrophilic glycopeptides must be incorporated into DHBA crystals at a very early process of crystallization because these glycopeptide signals are exclusively localized on the rim of MALDI samples. 2,5-DHBA and the glycopeptide accumulate on the rim by a Marangoni effect, caused by differences in surface activities during evaporation.22) Because the incorporation or adsorption of the ACTH peptide to 2,5-DHBA seems to continue during crystal growth, signals can be detected along extended crystals (Fig. 2b).
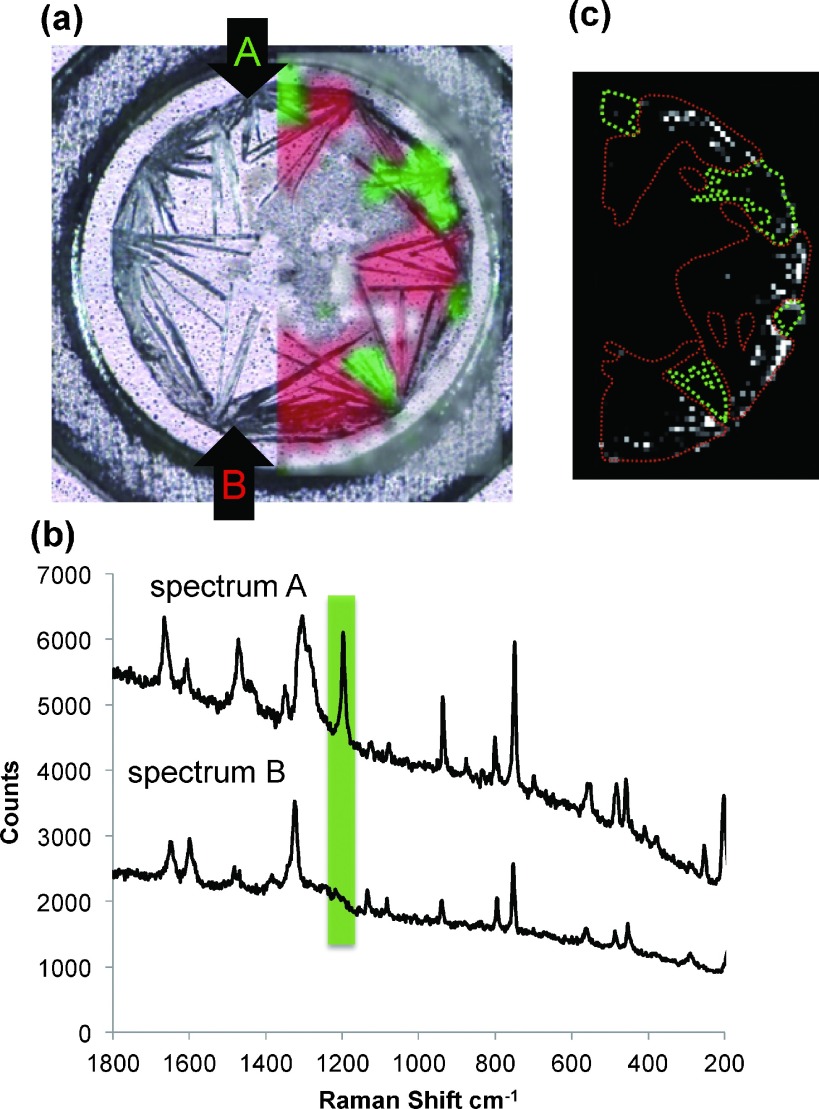
In order to investigate the properties of sweet spots of hydrophilic glycopeptides in dried-droplet preparations in more detail, we performed various nondestructive analyses, including Raman imaging of the MALDI sample. An interesting result was obtained from a model experiment using NA2-IRNKS as a sample. The MALDI sample of NA2-IRNKS consisted of two different types of 2,5-DHBA crystals with distinct Raman spectra, implying the simultaneous formation of dimorphic forms of 2,5-DHBA on the MALDI plate. MALDI samples were scanned by Raman microscopy and a detailed analysis revealed that the obtained Raman spectra could be divided into two types, Raman spectrum A and Raman spectrum B. These typical Raman spectra are shown in Fig. 3b. A major difference between the two Raman spectra is the presence of the peak at 1198 cm−1 that is colored in green. To discriminate between these two types of crystals the regions with Raman spectrum A are colored green on the optical image of the MALDI sample in Fig. 3a. The other crystals with the Raman spectrum B are colored red. The concomitant formation of dimorphic forms would not be driven by the nature of the analyte samples. Without analytes, a dried-droplet preparation using 2,5-DHBA also results in the formation of both crystal forms (data not shown). More interestingly, the red region of Raman spectrum B is directly related to the location of sweet spots for the glycopeptide NA2-IRNKS. This indicates that laser irradiation of the green regions of Raman spectrum A give low levels of or no ions for the glycopeptide, while the red region of Raman spectrum B produces abundant glycopeptide ions since many white dots are there (Figs. 3a and c). Thus non-destructive Raman imaging technique is effective for locating the sweet spots on a sample plate.
Fig. 3. (a) Confocal laser microscopy image of a sample containing NA2-IRNKS using 2,5-DHBA as a matrix. Raman spectra from every point were obtained by scanning the crystals and the crystals were divided into two types, denoted as Raman spectrum A (green) or Raman spectrum B (red). The same areas are shown in Fig. 3c. (b) Raman spectrum A or B obtained from the point A or B in Fig. 3a. (c) MS image (m/z 2239.7) of protonated NA2-IRNKS and Raman image of crystals. The black area indicates no signal and a dot with stronger signal is shown more whitened. The area surrounded with the green line corresponds to the crystal with Raman spectrum A. The area surrounded with the red line corresponds to the crystal with Raman spectrum B.
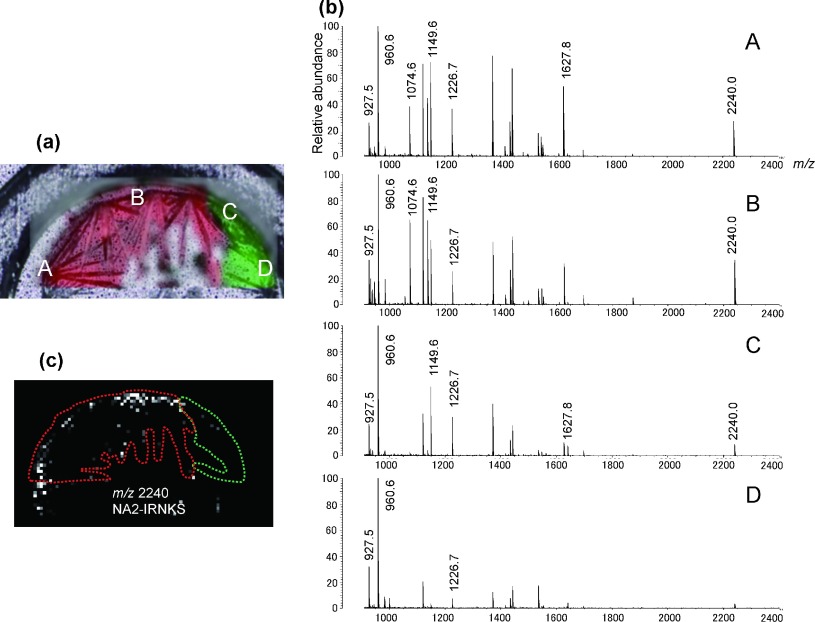
To confirm the correlation between crystal forms and the sweet spot locations of various peptides, a scan by Raman spectrometry was performed prior to the MALDI analysis for the sample containing the glycopeptide NA2-IRNKS and peptides from albumin obtained by trypsin digestion. The matrix crystals were divided into the two polymorphs and the regions are colored green and red (Fig. 4a). In Fig. 4a, positions A and B in the red region showed Raman spectrum B, while positions C and D in the green region showed Raman spectrum A. MS spectra at each point are shown in Fig. 4b. As expected, positions A and B but not positions C and D gave intense MS signal for the glycopeptide NA2-IRNKS ion at m/z 2240.0 (Fig. 4b). The MS image of NA2-IRNKS on this sample (Fig. 4c) demonstrates that white dots are exclusively present in the red region with Raman spectrum B. This indicates that there is a correlation between crystals with Raman spectrum B and the sweet spot location of the glycopeptide in the presence of peptides. This pre-scan Raman imaging may be useful for predicting the sweet spots of hydrophilic glycopeptides that are usually difficult to find within a sample.
Fig. 4. (a) Confocal laser microscopy image and Raman microscopy image of a sample containing NA2-IRNKS and tryptic digest of albumin using 2,5-DHBA as a matrix. The crystal enclosed green area shows Raman spectrum A and the red area shows Raman spectrum B showed in Fig. 3b. The same areas are shown in Fig. 4c. (b) Positive-ion mass spectra of the sample. Four spectra A–D were obtained from the corresponding points shown in microscopy image Fig. 4a. The m/z values of mono-isotopic ions are indicated. (c) MS image (m/z 2240.0) of protonated NA2-IRNKS in the sample. The black area indicates no signal and an area in which a signal was detected is shown as a whitened dot. The dot with strongest signal is shown as white. The area surrounded with the green line corresponds to the crystal with Raman spectrum A. The area surrounded with the red line corresponds to the crystal with Raman spectrum B.
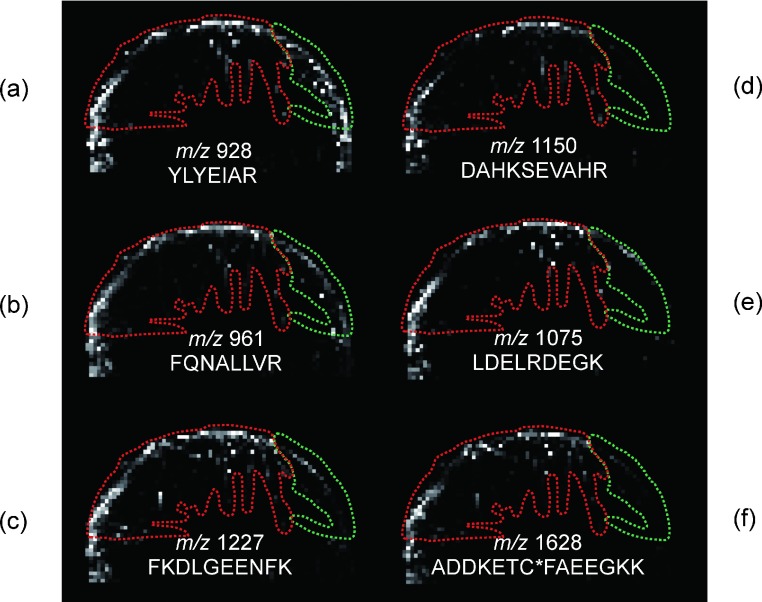
The MS images of six peptides from the trypsin-digested albumin on the same MALDI sample are shown in Fig. 5, respectively. Compared with the resulting Raman image given in Fig. 4a, the YLYEIAR ion at m/z 927.5 (Fig. 5a) and the FQNALLVR ion at m/z 960.6 (Fig. 5b) were well detected in all locations, regardless of the crystal forms because white dots exist in both the red and green regions. Because these two peptides with a B and B index26) −4150 and −2410 commonly possess both aromatic and aliphatic amino acids, they can be considered to be hydrophobic peptides. On the other hand, the ADDKETC*FAEEGKK ion at m/z 1627.8 (Fig. 5f), DAHKSEVAHR ion at m/z 1149.6 (Fig. 5d) and the LDELRDEGK ion at m/z 1074.6 (Fig. 5e) were dominantly detected from the red region of crystal with Raman spectrum B, and only a few dots were found in the green region of crystal with Raman spectrum A. Although they contain long chains, they are rich in polar and hydrophilic properties.
Fig. 5. MS images of protonated peptides from tryptic digest of albumin in the sample in Fig. 4a: m/z 927.5 for peptide YLYEIAR, m/z 960.6 for peptide FQNALLVR, m/z 1226.7 for peptide FKDLGEENFK, m/z 1149.6 for peptide DAHKSEVAHR, m/z 1074.6 for peptide LDELRDEGK, m/z 1627.8 for peptide ADDKETC*FAEEGKK (C* means carbamidemethylated cysteine). The black area indicates no signal and an area which signal was detected is shown as a whitened dot. The dot with strongest signal is shown as white. The hydrophobicity of peptides decreases in order of (a) to (f). The area surrounded with the green line corresponds to the crystal with Raman spectrum A. The area surrounded with the red line corresponds to the crystal with Raman spectrum B.
Of course, it is difficult to consider the hydrophobicity of peptide molecule only from the B and B value of each amino acid because the values for peptides are calculated without taking into consideration the secondary structures of peptides. Hydrophobic analytes are considered to have an advantage for interacting with matrix molecules. Thus, hydrophilic peptides with and without glycans have a tendency to be detected from regions showing Raman spectrum B, whereas hydrophobic peptides can be detected regardless of the crystal form of the matrix.
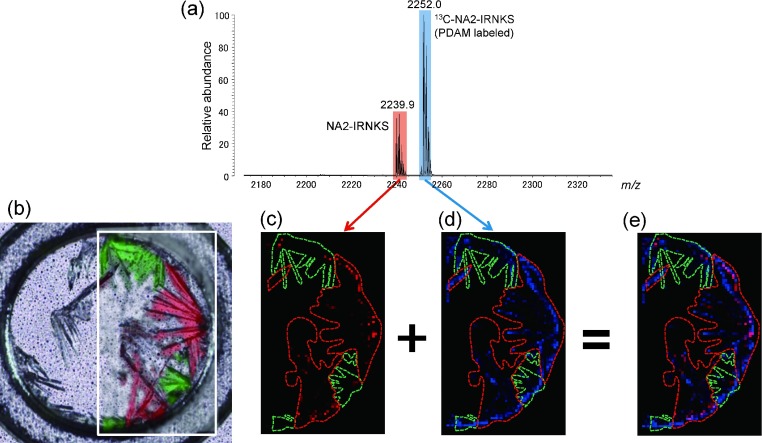
In MALDI analysis, various derivatization methods are frequently used to enhance the sensitivity of analytes such as a glycopeptide or a glycan. Most derivatization techniques confer hydrophobic properties to an analyte. Therefore there is an interest in the effect of derivatization on signal distribution. We compared the signal distribution between intact and derivatized glycopeptides using a method developed by us. In a previous report, we described a simple derivatization procedure using PDAM for the ionization enhancement of glycopeptides, in pyrene groups are easily introduced into the C-terminal.19) The introduced pyrene groups are easily released from glycopeptides during ionization when 2,5-DHBA is used as a matrix. It should be noted that glycopeptides contain a pyrene group during DHBA crystallization. To discriminate the ions from underivatized and derivatized glycopeptides in the mixture we used NA2-IRNKS and PDAM derivatized 13C-NA2-IRNKS as a mixed analyte. Thus, 13C-NA2-IRNKS was first derivatized with PDAM on the MALDI target plate, and NA2-IRNKS and a 2,5-DHBA matrix solution were then added to the plate, which was then left to dry. Figure 6a shows the resulting mass spectrum. PDAM derivatized 13C-NA2-IRNKS is detected at m/z 2252.0 after the release of the pyrene group while the protonated NA2-IRNKS peak is at m/z 2239.9. The Raman image of the sample of the glycopeptide mixture is shown in Fig. 6b, and the MS images of each glycopeptide are shown in Figs. 6c–d. As a result, the underivatized glycopeptide was dominantly detected from the red region, corresponding to Raman spectrum B, as expected, while the PDAM-derivatized glycopeptide gave abundant signals throughout the crystallized matrix. This confirms that the number of sweet spots for the glycopeptide are clearly increased by the derivatization with PDAM. This result raises the possibility that this derivatization critically alters the inherent property of the peptide portion and increases the interaction between the glycopeptide and matrix crystals. We previously demonstrated that a mixture of glycopeptides that had different peptide sequences showed nearly the same signal distribution around the sample after PDAM derivatization. This indicates that all glycopeptides with a pyrene group are distributed in the same way, although glycopeptides without a pyrene group act independently. Because many sweet spots can be generated regardless of the crystals, it is possible to obtain good quality mass spectra with minimal effort in terms of the location of the sweet spot.
Fig. 6. (a) Mass spectrum of a sample containing NA2-IRNKS and PDAM-derivatized 13C-NA2-IRNKS. (b) Confocal laser microscopy image and Raman microscopy image of the sample. Enclosed green area indicates the crystal with a Raman spectrum A and red area is the crystal with a Raman spectrum B. The same areas are shown in MS images of Figs. 6c–e. The area surrounded with the green line corresponds to the crystal with Raman spectrum A. The area surrounded with the red line corresponds to the crystal with Raman spectrum B. (c) MS image of protonated NA2-IRNKS (m/z 2239.9). The black area indicates no signal and a red dot with stronger signal is shown more brightened. (d) MS image of protonated 13C-NA2-IRNKS (m/z 2252.0). The black area indicates no signal and a blue dot with stronger signal is shown more brightened. (e) The overlay images c and d.
The formation of dimorphic forms of 2,5-DHBA has been reported in the literatures.23–25) Originally, Haisa et al. reported that 2,5-DHBA give dimorphic crystals, namely ordered and disordered.23) They obtained ordered crystal of 2,5-DHBA in water, and disordered crystals from a 3 : 1 ratio of chloroform and acetone. However, many studies attempting to find a correlation between ionization efficiency and matrix property have not taken the issue of crystal polymorphism into consideration.14,15) Williams et al. showed that disordered crystals are formed by active drying on a MALDI plate and the disordered form is advantageous for ion formation of carbohydrates.24) They confirmed the formation of disordered forms by X-ray powder diffraction, but concomitant dimorphic formation in the same MALDI sample was not mentioned. Cohen et al. showed that dimorphic forms of 2,5-DHBA precipitated from solution containing methyl red dye.25) They referred to them a Form II and a Form I and showed reference Raman spectra of both forms.26) Form II and the ordered form are the same, while there are some differences in crystal structures by X-ray diffraction analysis between Form I and the disordered form. In fact, the crystal structure of our crystal with Raman spectrum B by X-ray diffraction analysis was in agreement with that for the disordered form rather than Form I (our unpublished observations). Although the Raman spectrum B obtained in this study appears to be similar to that of Form I, the detailed crystal structures may be different.
The mechanistic aspects for the correlation between crystal form and signal distributions of the analyte are not obvious at present, but one plausible explanation may be the difference in analyte incorporation ability. In particular, the ionization of hydrophilic peptides tends to be difficult, thus it is necessary for it to be incorporated into matrix crystal lattice. On the basis of our results, hydrophilic peptides with and without glycans are present at least in the crystal form showing Raman spectrum B. The Raman spectrum B polymorph seems to be a disordered crystal and has a less rigid structure than the ordered one.23) Incorporation of molecules with weak hydrophobic interactions into disordered crystals should be easier than that for an ordered one. Horneffer et al.15) demonstrated the successful ionization of a protein using 2,6-DHBA matrix, which is known as a non-incorporative matrix, by using thin layer technique-like preparation. The incorporation of hydrophobic analytes into the matrix crystal is not a prerequisite for MALDI. However, there would be no doubt that regarding the incorporation of hydrophilic analytes into the matrix crystal is advantageous for ionization in standard dried-droplet preparations.
We also demonstrated that glycopeptides seem to be easily incorporated into a matrix crystal at the initiation of crystallization. The disordered crystal is meta-stable and is generated more rapidly than the ordered one in MALDI sample solution. At the same time, the flow occurs from the droplet center toward the edge due to a Marangoni effect during drying and DHBA crystal nuclei are conveyed to the rim of the droplet. Glycopeptides interact with crystal nuclei and become deposited there. This condensation process plays an important role in the generation of a sweet spot. At the late stage of crystallization, exclusion rather than inclusion should occur for crystal growth. There is considered to be only hydrophobic interactions with the surface of crystals.
Conclusion
In the current study, we performed Raman imaging followed by MS imaging of 2,5-DHBA crystals prepared by the dried-droplet method on the MALDI target plate. Raman imaging revealed the simultaneous formation of dimorphic crystals of 2,5-DHBA. The correlation between the crystal forms and analyte signal distribution was determined. The ions produced by hydrophobic peptides by the laser irradiation were detected in all types of crystals. In contrast, hydrophilic peptides including glycopeptides were dominantly ionized by laser irradiation of the specific polymorph showing Raman spectrum B, which is easily generated at the early stages of crystallization. A comparative analysis of MS imaging of glycopeptide and pyrene-derivatized glycopeptides showed that the pyrene group has a critical role on enlarging the sweet spots for a glycopeptide. Pyrene derivatization ionization efficiency is independent of the matrix crystal. Hydrophobicity of analyte appears to be a key parameter governing the interaction between analyte molecules and crystallizing 2,5-DHBA during a dried-droplet preparation.
To our knowledge, this is the first report showing a correlation between the distribution of sweet spots and the crystal forms of 2,5-DHBA. The finding also indicates that two distinct crystal forms of 2,5-DHBA are simultaneously formed and is one of the factors causing MS signal heterogeneity. However, Raman imaging as pre-scanning strategy is applicable for searching for sweet spots of hydrophilic glycopeptides without destruction. As a result it is possible to more easily obtain high quality MS spectra.
Acknowledgments
This work is supported in part by SENTAN, JST (Japan Science and Technology Agency). We thank Noriaki Ishizawa (Renishaw KK) for the measurement of Raman imaging.
References
- 1) K. Strupat, M. Karas, F. Fillenkamp. Int. J. Mass Spectrom. Ion Process. 111: 89–102, 1991 [Google Scholar]
- 2) D. J. Harvey. Mass Spectrom. Rev. 18: 349–450, 1999 [DOI] [PubMed] [Google Scholar]
- 3) D. J. Harvey. Mass Spectrom. Rev. 25: 595–662, 2006 [DOI] [PubMed] [Google Scholar]
- 4) D. J. Harvey. Mass Spectrom. Rev. 27: 125–201, 2008 [DOI] [PubMed] [Google Scholar]
- 5) D. J. Harvey. Mass Spectrom. Rev. 28: 273–361, 2009 [DOI] [PMC free article] [PubMed] [Google Scholar]
- 6) D. J. Harvey. Mass Spectrom. Rev. 30: 1–100, 2011 [DOI] [PubMed] [Google Scholar]
- 7) Y. Dai, R. M. Whittal, L. Li. Anal. Chem. 68: 2494–2500, 1996 [DOI] [PubMed] [Google Scholar]
- 8) V. Horneffer, A. Forsmann, K. Strupat, F. Hillenkamp, U. Kubitscheck. Anal. Chem. 73: 1016–1022, 2001 [DOI] [PubMed] [Google Scholar]
- 9) R. W. Garden, J. V. Sweedler. Anal. Chem. 72: 30–36, 2000 [DOI] [PubMed] [Google Scholar]
- 10) S. L. Luxembourg, L. A. McDonnell, M. C. Duursma, X. Guo, R. M. A. Heeren. Anal. Chem. 75: 2333–2341, 2003 [DOI] [PubMed] [Google Scholar]
- 11) W. Bouschen, B. Spengler. Int. J. Mass Spectrom. 266: 129–137, 2007 [Google Scholar]
- 12) H. Qiao, G. Piyadasa, V. Spicer, W. Ens. Int. J. Mass Spectrom. 281: 41–51, 2009 [Google Scholar]
- 13) J. Kampmeier, K. Dreisewerd, M. Schürenberg, K. Strupat. Int. J. Mass Spectrom. Ion Process. 169: 31–41, 1997 [Google Scholar]
- 14) K. Strupat, J. Kampmeier, V. Horneffer. Int. J. Mass Spectrom. Ion Process. 169: 43–50, 1997 [Google Scholar]
- 15) V. Horneffer, K. Dreisewerd, H.-C. Lüdemann, F. Hillenkamp, M. Läge, K. Strupat. Int. J. Mass Spectrom. 185: 859–870, 1999 [Google Scholar]
- 16) M. Glückmann, A. Pfenninger, R. Krüger, M. Thierolf, M. Karas, V. Horneffer, F. Hillenkamp, K. Strupat. Int. J. Mass Spectrom. 210: 121–132, 2001 [Google Scholar]
- 17) R. Krüger, A. Pfenninger, I. Fournier, M. Glückmann, M. Karas. Anal. Chem. 73: 5812–5821, 2001 [DOI] [PubMed] [Google Scholar]
- 18) A. Seko, M. Koketsu, M. Nishizono, Y. Enoki, H. R. Ibrahim, L. R. Juneja, M. Kim, T. Yamamoto. Biochim. Biophys. Acta 1335: 23–32, 1997 [DOI] [PubMed] [Google Scholar]
- 19) J. Amano, T. Nishikaze, F. Tougasaki, H. Jinmei, I. Sugimoto, S. Sugawara, M. Fujita, K. Osumi, M. Mizuno. Anal. Chem. 82: 8738–8743, 2010 [DOI] [PubMed] [Google Scholar]
- 20) J. Amano, D. Sugahara, K. Osumi, K. Tanaka. Glycobiology 19: 592–600, 2009 [DOI] [PubMed] [Google Scholar]
- 21) T. Nishikaze, H. Okumura, H. Jinmei, J. Amano. Int. J. Mass Spectrom. in press. [DOI] [PMC free article] [PubMed] [Google Scholar]
- 22) F. M. L. Amado, P. Domingues, M. G. Santana-Marques, A. J. Ferrer-Correia, K. B. Tomer. Rapid Commun. Mass Spectrom. 11: 1347–1352, 1997 [Google Scholar]
- 23) M. Haisa, S. Kashino, S. I. Hanada, K. Tanaka, S. Okazaki, M. Shibagai. Acta Crystallogr. B 38: 1480–1485, 1982 [Google Scholar]
- 24) T. I. Williams, D. A. Saggese, R. J. Wilcox, J. D. Martin, D. C. Muddiman. Rapid Commun. Mass Spectrom. 21: 807–811, 2007 [DOI] [PubMed] [Google Scholar]
- 25) D. E. Cohen, J. B. Benedict, B. Morlan, D. T. Chiu, B. Kahr. Cryst. Growth Des. 7: 492–495, 2007 [Google Scholar]
- 26) D. E. Cohen, T. Schneider, M. Wang, D. T. Chiu. Anal. Chem. 82: 5707–5717, 2010 [DOI] [PMC free article] [PubMed] [Google Scholar]


