

Abstract
A number of experimental issues in the measurement of multi-component T2 and T1ρ relaxations in native and enzymatically digested articular cartilage were investigated by microscopic MRI (μMRI). The issues included the bath solutions (physiological saline and phosphate buffered saline (PBS)), the imaging resolution (35 to 140 μm), the specimen orientations (0° and 55°), and the strength of spin-lock frequencies (0.5 to 2 kHz) in the T1ρ experiments. In addition to cartilage, the samples of agar gel and doped water solution were also used in the investigation. Two imaging sequences were used: CPMG-SE and MSME. All raw data were analyzed by the non-negative least square (NNLS) method. The MSME sequence was shown to result in the observation of multi-component T2, even in the gel and liquid samples, demonstrating the artificial uncleanness of this sequence in the multi-component measurements. The soaking of cartilage in PBS reduced the observable T2 components to one at both 0° and 55°, suggesting the effect of phosphate ions on proton exchange between different pools of water molecules. The cartilage orientation with respect to the external magnetic field and the spin-lock strengths in the T1ρ experiment both affected the quantification of the multi-component relaxation. The transitions between a mono-component and multi-components in cartilage under various experimental conditions call for the extra caution in interpreting the relaxation results.
Keywords: cartilage, T2 relaxation, T1ρ relaxation, multi-component, MRI, PBS, chemical exchange
INTRODUCTION
The anisotropic properties (experimental dependence of the measurement on the orientation of the specimen to the magnetic field B0) of connective tissues, such as tendon, nasal cartilage, and articular cartilage, have been well studied by NMR spectroscopic and imaging techniques [1–9], where the phenomena are commonly attributed to the dipolar interaction between the water protons and the collagen fibril structure. The existence of multiple pools of water molecules (e.g., macromolecule-bound vs. free) can in principle result in the measurement of multi-component relaxation [10; 11]. For example, the tendon sample has consistently been confirmed to have multi-component T2 relaxations [1; 12–14]. Recently, after the discovery of the anisotropy in nasal cartilage by μMRI and polarized light microscopy [9], the residual fibril orientation in nasal cartilage was found to be able to modulate the number of the relaxation components in nasal cartilage: both T2 and T1ρ at the spin-lock strength of 500 Hz having two relaxation components when the fibril orientation was 0°, but reducing to one component for both T2 and T1ρ when the fibril orientation was 55° (the magic angle) [8].
Articular artilage has a similar mlecular composit in tendon and asal cartilage, namely, the negatively charged proteoglycans, collagen fibrils, and water. However, articular cartilage has a more complex morphological structure [15; 16], where the thickness of the tissue is commonly sub-divided conceptually into three sub-structural zones, the superficial zone (SZ) at the top, the transition zone (TZ) in the middle, and the radial zone (RZ) that anchors the tissue to the underlining bone [17]. These structural zones have different thicknesses (both absolute and relative), depending upon the joint type and animal species. The orientation of collagen fibrils in these zones is depth-dependent, resulting in a laminar appearance in MRI of cartilage, when the axis of cartilage surface is parallel with B0 [18]. The disappearing of the laminar appearance and higher signal intensity, due to the minimization of the dipolar interaction when the axis is about 55° to B0, is called the “magic-angle effect” in MRI of cartilage [3].
The discovery of the anisotropy of the multi-component relaxation in nasal cartilage clearly indicates the experimental complication of the multi-component relaxation in articular cartilage by any imaging method, because the size of the imaging voxel now becomes another critical factor in the measurement. The two MRI parameters of particular concern in this project are T2 and T1ρ, both having been shown to be sensitive to the interactions between water molecules and local macromolecular environments in connective tissues. The limited imaging reports on the topic so far contained inconsistent results. For example, Keinan-Adamsky et al noticed two T2 components in a deep portion of porcine articular cartilage [19]. Reiter et al also showed two T2 components in both fresh and trypsin degraded articular cartilage [20]. However, Zheng et al. observed only a single component of T2 in articular cartilage, as long as the resolution was sufficiently high in μMRI [14]. Since many experimental parameters can subtlety affect the outcomes of the measurement, comparing the results among the published reports, each only dealing with a subset of the experimental parameters, is often not conclusive.
This μMRI project aimed to systematically investigate the influences of several experimental factors on the multi-component T2 and T1ρ relaxation in articular cartilage. These experimental factors included the resolution of MRI experiments (35 μm to 140 μm), the effect of different bath solutions (saline and PBS), the influence of the specimen orientations (0°, 55°), the effect of the different pulse sequences (MSME and CPMG-SE), and the strengths of the spin-lock frequencies in T1ρ experiments (0.5 kHz to 2 kHz). We aimed to provide a coherent baseline for the complex and convoluted factors that can subtly influence the measurement of multi-component relaxation in an organized biological tissue.
MATERIALS AND METHODS
Solutions of Saline and PBS
All solutions of saline and PBS used in the experiments were prepared in the laboratory. A saline solution refers simply to physiological saline (154 mM NaCl in deionized water). A PBS (phosphate buffered saline) solution was prepared as follows. First, 276 gram s of sodium phosphate monobasic (monohydrate) (Sigma, Missouri) were added to deionized water. The volume of the phosphate buffer was then brought to one liter after adjusting the pH value to 7.3 by NaOH (Sigma, Missouri). Then nine grams of NaCl was added to 50 ml of the phosphate buffer and diluted to one liter with deionized water. The final PBS solution contained a phosphate concentration of 100 mM, and had a pH corresponding to ~ 7.4 [21].
Artificial Specimens of Agar Gel and Gd Solution
Two kinds of artificial samples were made in the lab. The first kind was several gel samples, made by dissolving two grams of agar powder (Flinn Scientific, Batavia, IL) in 100 grams of heated deionized water. The cooling of the agar solution was under two different conditions: (a) the liquid was stirred for five minutes at 100 °C and (b) the liquid was occasionally stirred during the process. The cold gels were sealed in glass tubes and kept at room temperature before the experiment. The second kind of artificial specimen was simply a small glass tube filled with 1 mM Gd(DTPA)2− solution (Magnevist, Berlex, NJ).
Cartilage Specimens
Canine humeral heads were harvested shortly after the sacrifice of three mature (1 – 2 years old) and skeletally healthy dogs that were used for an unrelated biomedical research (ongoing for more than 10 years at a neighboring institution). For each of the three dogs, three adjacent blocks consisting of the full thickness of the articular cartilage (1.8 × 1.6 × 6 mm3) were obtained from the central part of a humeral head. Before the MRI measurement, three blocks were immersed in saline solution and another three blocks were soaked in PBS solution for stabilization. The final three blocks were soaked in 10 μg/ml trypsin (Sigma, Missouri) solution for more than eight hours to digest proteoglycans [22] and then soaked in saline to remove excess trypsin before MRI experiments. All specimens were never frozen.
NMR and Microscopic MRI (μMRI) Protocols
All experiments were conducted at room temperature on a Bruker AVANCE II NMR spectrometer equipped with a 7-Tesla/89-mm vertical-bore superconducting magnet and microimaging accessory (Billerica, MA). A homemade 5-mm solenoid coil was used for the experiments. The orientation of the cartilage specimens with respect to B0 was set at 0° and 55° (the magic angle) for the MRI experiments, respectively. T2 imaging experiments were performed using a commercial multi-slice, multi-echo (MSME) pulse sequence (only one slice was used in this project) from Bruker, as well as a Carr-Purcell-Meiboom-Gill (CPMG) magnetization-prepared spin-echo imaging sequence (termed as the CPMG-SE in this report) [6]. The echo spacing in the CPMG T2-weighting segment was 1 ms. The number of echo times was 50, resulting in 50 delays from 2 to 600 ms. The T1ρ imaging sequence was nearly identical to the T2 imaging sequence, except that it was led by a T1ρ-weighting segment, which had a 90° radio-frequency (rf) pulse followed by a spin-lock pulse. The frequency of the spin-lock pulse varied from 0.5 to 2 kHz. The strength of the spin-lock frequency was calibrated by the strength of the 90° rf pulse, which had a typical length of 6.5 μs. The lengths of the spin-lock pulses were equal to the 50 echo times in the T2 imaging experiments.
The 2D imaging parameters were consistent for both T2 and T1 experiments: the echo time and repetition time was 3.0 ms and 2 s respectively; the number of scans was 16; the number of the dummy scans was 2; and the field of view (FOV) was 4.5 mm×4.5 mm. T2 experiments were acquired at three different transverse pixel resolutions (140 μm, 70 μm, and 35 μm). The slice thickness was 1 mm. The MSME experiments were also performed for each cartilage block and agar specimens using the identical imaging parameters as in the CPMG-SE experiments, except for the following: the number of images was 64; and the repetition time was 3 s.
NMR spectroscopy experiments for the two kinds of gels (homogeneous and inhomogeneous) were conducted on the same instrument. The T2 relaxation time was measured by the standard CPMG spectroscopy sequence, which is similar to the CPMG-SE imaging sequence except without the imaging pulses. Seventy data points were acquired with 1 ms echo spacing. The repetition time was 10 s; the number of scans was 8; the number of dummy scans was 4. Other details have been documented previously in the literature [23].
Multi-component T2 and T1ρ relaxation analysis
The non-negative-least-squares (NNLS) method was implemented in the Matlab codes (Mathworks, Natick, MA) and used to calculate the distribution profiles of T2 and T1ρ relaxation times [24; 25]. In the MRI data analysis, a rectangular region-of-interest (ROI) with a width of 10 contiguous columns were averaged from the 2D images to improve the signal-to-noise ratio of the 1D profiles. The ROI was selected from the region of the tissue with no visible variation. In the NNLS analysis of the T2 and T1ρ spectrum, any T2 or T1ρ component with a value below or above two constant thresholds (1.5 ms and 250 ms) was ignored to eliminate the dependence of the calculation on the experimental noises [26–28]. The use of the NNLS method meant that the results in the experiments were calculated without a priori assumptions about the number of T2 and T1ρ components and any initial guesses of the solution.
RESULTS
T2 Relaxations of Agar Gel and 1mM Gd Solution by NMR Spectroscopy and μMRI
Fig 1 summarizes the multi-component T2 relaxation results by NMR spectroscopy in two agar gel phantoms, one homogeneous sample (after sufficient stirring) and the other inhomogeneous sample (with occasional stirring, hence the specimen was visibly un-uniform and also contained many small air bubbles in the gel). A convenient way of visualizing the multi-component relaxation decay is to plot the image intensity in the natural log scale, as shown in Fig 1a. The relaxation profiles of the same data by the NNLS analysis procedure are shown in Fig 1b. Compared to just one T2 component in the homogeneous gel, two distinct T2 components were clearly observed in the inhomogeneous gel.
Fig 1.

(a) The normalized signals in NMR spectroscopy experiment of the two different kinds of the gel specimens in the natural log scale. (b) The T2 distribution profiles of the gel samples by the NNLS calculat.
Fig 2a summarizes the multi-component T2 relaxation results by μMRI in the agar gel phantoms, which were imaged by both MSME and CPMG-SE sequences at three different resolutions (140 μm, 70 μm, 35 μm). It is clear that the intensities of the CPMG-SE images decayed slower than those of the MSME images (at the same TE, slower the decay, brighter the image), which suggests a longer T2 relaxation. The natural log plot of Fig 2b shows clearly the resolution dependency of the T2 decays in the MSME experiments. Fig 2c is the results of the multi-component profiles of the gel samples, which were also quantified in Table 1.
Fig 2.
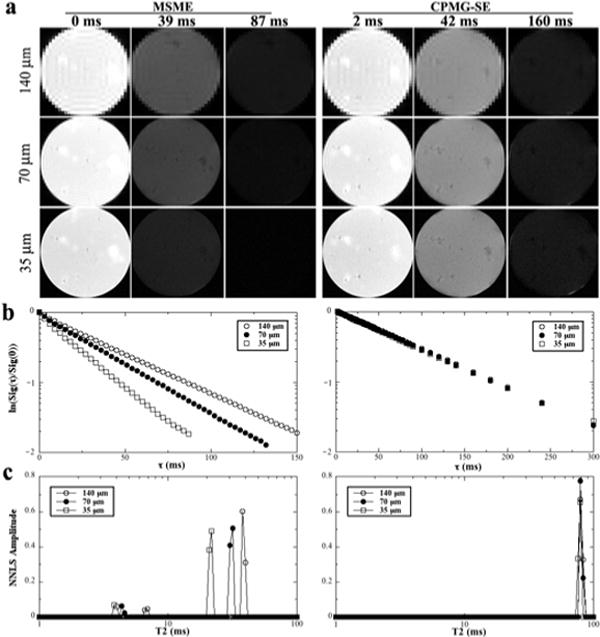
(a) Selected proton-intensity images of agar gel at different resolutions by the MSME (left) and CPMG-SE (right) sequences, where each specimen had 64 and 50 T2 weighting images (each at a different echo time) respectively. All intensity images were displayed using the same maximum (32767) and minimum (0) values on the usual gray scale. The direction of the external magnetic field B0 was vertically up. (b) The normalized signals of the gel imaging data in the natural log scale. (c) The T2 distribution profiles of the gel samples by the NNLS calculation. The central region of 5 pixels by 5 pixels in (a) was averaged to improve the signal-to-noise ratio
Table 1.
T2 imaging results of gel and 1mM Gd(DTPA)2− solution at different imaging resolutions
| Sample | Pulse Sequence | Imaging Resolution | |||||
|---|---|---|---|---|---|---|---|
| 140 μm | 70 μm | 35 μm | |||||
| T2 (ms) | % | T2 (ms) | % | T2 (ms) | % | ||
| Gel | MSME | 6.8 ± 1.3 | 7.9 ± 3.1 | 4.5 ± 0.9 | 8.4 ± 4.1 | 3.9 ± 0.6 | 13.2±4.6 |
| 39.4±2.8 | 92.1±3.4 | 31.3±1.8 | 91.6±5.3 | 21.5±3.0 | 86.8±5.8 | ||
| CPMG-SE | 78.4±4.0 | 100 | 78.0±3.7 | 100 | 77.9±4.6 | 100 | |
| 1mM Gd | MSME | 7.1±1.9 | 5.0±2.3 | 5.5±2.1 | 7.6±3.7 | 4.0±1.2 | 13.9±3.1 |
| 52.3±3.3 | 95.0±5.1 | 39.8±3.4 | 92.4±5.8 | 22.8±3.6 | 86.1±5.2 | ||
| CPMG-SE | 173.3±7.4 | 100 | 172.6±7.8 | 100 | 169.4±6.9 | 100 | |
While T2 is a single component (centered at ~ 78 ms) in all CPMG-SE experiments of the agar gel at three different resolutions, two T2 components are clearly visible in the MSME experiments of the gel. In addition, while the T2 values in the CPMG-SE experiments are independent of the imaging resolutions, the values of the two T2 components in the MSME experiments decrease as the resolution increased, where the values of the long component were only ~ 1/2 of the CPMG-SE values. Furthermore, the relative populations of the short T2 components in MSME depend on the imaging resolution — the population of the short component becoming larger when the resolution becoming higher. Table 1 contains not only the summary of the gel data but also the summary of the T2 data from a tube of 1 mM Gd(DTPA)2− solution, where the images and plots were similar to the gel samples (not shown). This set of gel and solution data demonstrates unmistakably the artificial uncleanness of the MSME sequence in the multi-component relaxation measurements.
T2 of Native Cartilage in Saline and PBS
Fig 3 is representative of the intensity images of native articular cartilage when they were soaked in PBS and saline, and measured by CPMG-SE and MSME sequences at 0° and 55° respectively. Similar to the agar gel results, the intensity of the cartilage images depends strongly on the image resolution (140 μm, 70 μm, 35 μm) in MSME (the comparisons were not shown). In addition, in contrast to a clear laminar appearance of articular cartilage in saline, the laminar appearance of the tissue was less noticeable when the specimen was soaked in PBS (e.g., comparing the first and third images in the first row in Fig 3a).
Fig 3.

Selected proton-intensity images of the native cartilage soaked in PBS (left) and saline (right) solutions by both MSME and CPMG-SE sequences at 0° and 55°. All images were displayed using the same minimum and maximum values.
Fig 4a – 4d show the T2 relaxation results of cartilage when the tissue was soaked in saline, where the results were the bulk data, by averaging the entire thickness of the tissue including all structural zones. Several features could be noted from these bulk T2 data. First, T2 at 0° showed two components by MSME and three components by CPMG-SE. Second, T2 at 55° showed two components by MSME and one component by CPMG-SE. Third, the T2 values by CPMG-SE were independent of the image resolutions, while the T2 values by MSME decreased when the imaging resolution increased, no matter whether the specimen was oriented at 0° or the magic angle. Finally, the relative population of the short T2 component varied significantly as the specimen orientation – around 50% at 0° and 10–20% at the magic angle.
Fig 4.

The T2 relaxation distributions in the bulk cartilage samples (combined SZ, TZ, and RZ together) at both 0° and 55° by NNLS analysis, when the specimens were in saline (a – d) and PBS (e – h).
Fig 4e – 4h show the T2 relaxation results of cartilage when the tissue was soaked in PBS. When the tissue was imaged by CPMG-SE, only a single T2 component was observed at both 0° and 55° at all resolutions, with the T2 values at 55° higher than at the T2 values at 0°. When imaged by MSME, two T2 components were observed at both 0° and 55° at all resolutions. Similar to the gel results and the cartilage saline results, higher resolutions in MSME resulted in shorter values of the T2 components, as well as higher relative populations of the shorter components. All T2 results of native cartilage were summarized in Table 2.
Table 2.
T2 imaging results of native cartilage at different soaking solutions
| Solution | Pulse Sequence | Angle | Imaging Resolution | |||||
|---|---|---|---|---|---|---|---|---|
| 140 μm | 70 μm | 35 μm | ||||||
| T2 (ms) | % | T2 (ms) | % | T2 (ms) | % | |||
| Saline | MSME | 0° | 6.8 ± 1.4 | 45.9±5.6 | 5.4±1.2 | 53.0±4.6 | 3.9±1.0 | 51.2±4.1 |
| 29.8±3.4 | 54.1±4.3 | 23.3±2.8 | 47.0±4.2 | 17.2±3.3 | 48.8±4.9 | |||
| 55° | 18.5±2.2 | 12.5±4.6 | 12.7±1.6 | 12.0±3.8 | 11.5±2.0 | 23.4±5.2 | ||
| 40.7±3.5 | 87.5±4.1 | 36.8±3.0 | 88.0±5.0 | 27.1±2.9 | 76.6±5.0 | |||
| CPMG-SE | 0° | 2.7±0.9 | 24.1±3.9 | 2.8±1.1 | 24.4±4.1 | 2.9±1.3 | 23.8±4.3 | |
| 7.8±1.6 | 35.8±4.2 | 7.7±1.4 | 35.6±5.3 | 7.7±1.4 | 35.5±5.5 | |||
| 33.0±2.6 | 40.1±5.2 | 32.1±3.5 | 40.0±4.7 | 32.6±3.9 | 40.7±5.1 | |||
| 55° | 54.0±3.9 | 100 | 54.8±3.6 | 100 | 54.3±3.6 | 100 | ||
| PBS | MSME | 0° | 6.7 ± 1.3 | 8.9 ± 2.5 | 4.8±1.2 | 9.6±2.6 | 4.1±1.0 | 15.2±4.1 |
| 23.8±2.4 | 91.1±4.3 | 22.9±2.7 | 90.4±4.2 | 19.2±3.2 | 84.8±4.7 | |||
| 55° | 7.6 ± 2.8 | 4.3 ± 3.6 | 6.0 ± 1.8 | 9.8 ± 3.3 | 5.5 ± 1.4 | 20.4±3.5 | ||
| 27.5±3.6 | 95.7±3.8 | 25.0±3.1 | 90.2±5.1 | 19.8±2.9 | 79.6±4.4 | |||
| CPMG-SE | 0° | 29.2±3.2 | 100 | 28.8±3.1 | 100 | 28.5±3.3 | 100 | |
| 55° | 41.8±3.9 | 100 | 41.2±3.8 | 100 | 41.9±3.3 | 100 | ||
T2 and T1ρ of Native and Degraded Cartilage
The dependence of the T1ρ values on the spin-lock frequency (or field) is known as the T1ρ dispersion in the MRI literature, which can also absorb the T2 data as the T1ρ data at the zero spin-lock frequency. This phenomenon in the context of the multi-component measurement was investigated in this project using both native and degraded cartilage. Fig 5 shows the representative images of both native and degraded cartilage, where all specimens were in saline and measured by the CPMG-SE sequence. At the 0° orientation, the laminar appearance of the tissue could be seen clearly in the T2 images (two white arrows shown in the Fig 5a), but less clear in the T1ρ images. At the magic angle, both T2 and T1ρ images appeared relatively uniform.
Fig 5.
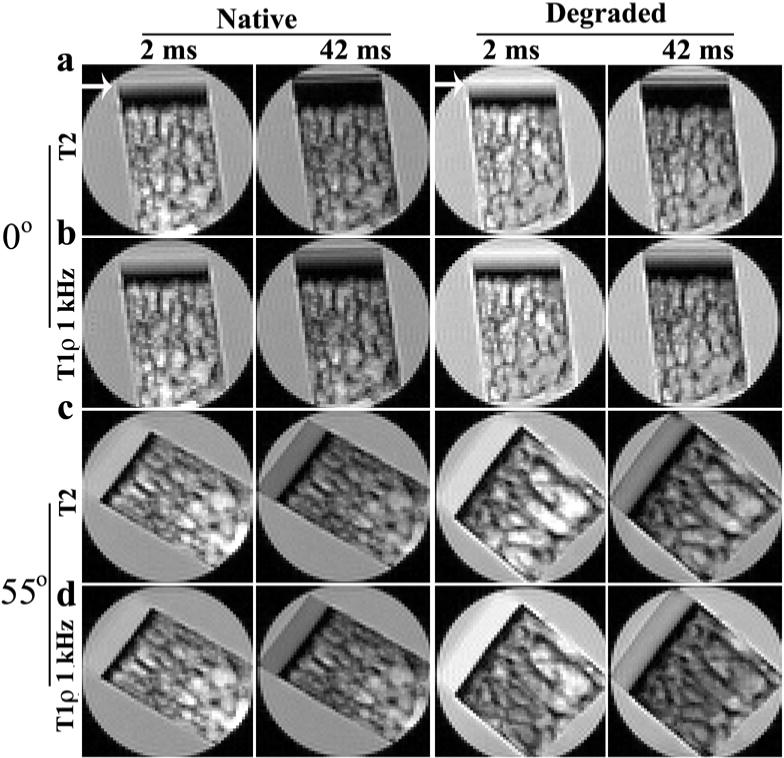
Selected proton-intensity images of the native tissues (left) and degraded tissue (right) where each specimen was imaged 50 times, each at a different T2 or T1ρ (1 kHz) weighting. All intensity images were displayed using the same maximum and minimum values on the usual gray scale. All the images in this figure were at the 70 μm resolution. (The similar images at two different resolutions (35 μm, 140 μm) were not shown.) The laminar appearance of T2 images at 0° for both native and degraded tissue is marked by two white arrows.
T1ρ measurements at 1 kHz were performed at three different image resolutions (140 μm, 70 μm, 35 μm); additional T1ρ experiments at 0.5 and 2 kHz were acquired at 140 μm image resolution (since the T1ρ experiment is not sensitive to the image resolution). These images were analyzed for their bulk multi-component characteristics, which were summarized in Table 3, and illustrated in Fig 6 using the T2 data and T1ρ data when the spin-lock frequency was at 1 kHz. Several conclusions can be reached. (1) At the 0° orientation, a lower spin-lock frequency resulted in more relaxation components (Table 3). (2) The number of the relaxation components at any particular spin-lock field was identical and orientational dependent for both native and degraded tissues (Table 3). At the 0° orientation, the tissues had three components for T2, two components at T1ρ at 0.5 kHz, and a single component when the spin-lock frequency was 1 kHz or higher. At the magic angle by comparison, both T2 and T1ρ showed a single component. (3) The T2 and T1ρ values of the degraded tissue were consistently higher than those of native tissue; and the T1ρ values were consistently higher than the T2 values regardless of native or degraded tissue. (4) T1ρ value increased more significantly after the tissue was degraded (Fig 6c and 6d). (5) T1ρ dispersion occurred in both native and degraded tissue, and at both 0° and 55°. (6) The number and the fractional concentration of the relaxation components were related to the spin-lock frequency, rather than the imaging resolution.
Table 3.
T1ρ dispersion results of native and degraded cartilage at different spin-lock fields (the specimens were soaked in saline and imaged by CPMG-SE)
| Specimen Angle | Spin-lock Field (Hz) | Tissue | Imaging Resolution | |||||
|---|---|---|---|---|---|---|---|---|
| 140 μm | 70 μm | 35 μm | ||||||
| T1ρ (ms) | % | T1ρ (ms) | % | T1ρ (ms) | % | |||
| 0° | 0 | Native | 2.7±0.9 | 24.1±3.9 | 2.8±1.1 | 24.4±4.1 | 2.9±1.3 | 23.8±4.3 |
| 7.8±1.6 | 35.8±4.2 | 7.7±1.4 | 35.6±5.3 | 7.7± 1.4 | 35.5±5.5 | |||
| 33.0±2.6 | 40.1±5.2 | 32.1±3.5 | 40.0±4.7 | 32.6±3.9 | 40.7±5.1 | |||
| Degraded | 2.8±0.8 | 24.0±3.7 | 2.9±1.0 | 23.3±3.9 | 2.9±1.7 | 23.6±3.4 | ||
| 8.1±1.9 | 34.4±4.4 | 10.1±2.4 | 35.2±4.2 | 9.4±3.2 | 34.1±4.1 | |||
| 40.6±2.8 | 41.6±5.3 | 41.9±4.4 | 41.5±5.0 | 42.3±4.9 | 42.3±5.2 | |||
| 500 | Native | 9.2±2.1 | 35.6±3.7 | |||||
| 46.5±3.9 | 64.4±5.3 | |||||||
| Degraded | 11.1±2.3 | 36.5±3.9 | ||||||
| 64.0±3.5 | 63.5±5.5 | |||||||
| 1000 | Native | 53.6±2.7 | 100 | 53.4±2.9 | 100 | 53.2±2.5 | 100 | |
| Degraded | 88.5±4.9 | 100 | 88.4±4.5 | 100 | 88.2±4.8 | 100 | ||
| 2000 | Native | 69.1±3.8 | 100 | |||||
| Degraded | 112.0±5.9 | 100 | ||||||
| 55° | 0 | Native | 54.0±3.9 | 100 | 54.8±3.6 | 100 | 54.3±3.6 | 100 |
| Degraded | 70.1±5.2 | 100 | 70.0±4.8 | 100 | 70.6±5.0 | 100 | ||
| 1000 | Native | 70.2±3.8 | 100 | 69.3±4.1 | 100 | 70.6±4.3 | 100 | |
| Degraded | 100.6±5.1 | 100 | 100.5±5.2 | 100 | 100.0±4.8 | 100 | ||
For the ease of comparison, the native tissue (in saline by CPMG-SE) results in Table 2 were duplicated here as the T1ρ results at the zero spin-lock field.
Fig 6.
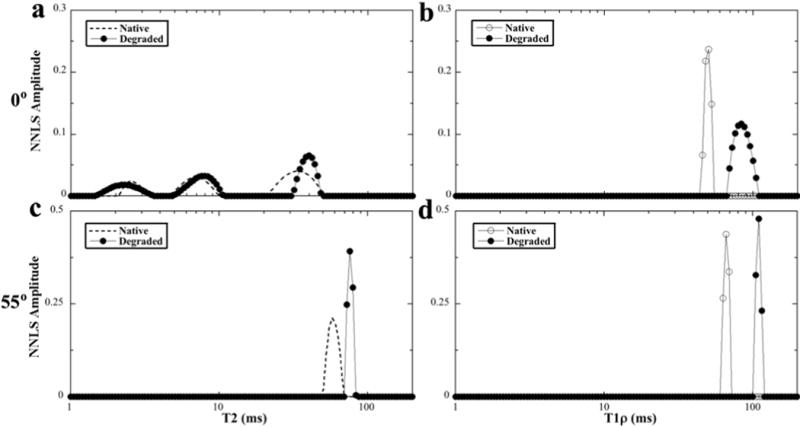
The T2 and T1ρ at 1 kHz results of the native and degraded tissues at 0° and 55°. (The T2 plots of the native cartilage (shown as the dash lines without the individual data points) were duplicated from the plots of Fig 4, for the ease of comparison.)
Zonal Differences of T2 in Native and Degraded Cartilage
Since articular cartilage has a depth-dependent zonal structure, the high-resolution images of articular cartilage are commonly sub-divided into multiple zones [17]. For the high-resolution results in this project (70 μm, 35 μm), the full-thickness cartilage contained sufficient number of pixels to be sub-divided into the three zones based on the established zonal division criteria [17]. For the 140-μm-resolution data, the entire tissue had approximately three reliable pixels (since the canine humeral cartilage is about 550–600μm in the total thickness). Therefore these three pixels from the tissue surface to bone were named as the surface, middle, and deep zones, and analyzed individually in each zone by the NNLS method.
Table 4 summarized the T2 zonal results at different image resolutions when the specimen was oriented at 0°. (To simplify the labels, the three zones were named as the surface, middle, and deep zones in the table, regardless of the imaging resolution.) Several distinct characteristics can be identified in these complex relaxation results. (1) T2 relaxation at the deep zone always showed a single component, centered at ~ 2.8 ms regardless of degradation or imaging resolution. (2) T2 had multi-components at the surface zone and the middle zone when the resolution was lower (70 μm and 140μm). In contrast, no multi T2 component was noticed when the imaging resolution was increased to 35 μm (where the voxel size was 35 μm × 35 μm × 1 mm = 12.25 × 10⁻⁴ mm3). Hence the number of relaxation components depended upon the imaging resolution. (3) The value of the long T2 components has the largest increase after the tissue degradation.
Table 4.
T2 imaging results of cartilage with the zone divisions (in saline, at 0°)
| Tissue | Zone | Imaging Resolution | |||||
|---|---|---|---|---|---|---|---|
| 140 μm | 70 μm | 35 μm | |||||
| T2 (ms) | % | T2 (ms) | % | T2 (ms) | % | ||
| Native | SZ | 9.1±2.9 | 15.5±3.8 | 9.0 ± 2.1 | 58.2±4.9 | 12.0±3.5 | 100 |
| 34.9±3.8 | 84.5±5.9 | 38.8±4.4 | 41.8±4.2 | ||||
| MZ | 7.7±2.3 | 55.0±4.9 | 9.3±3.2 | 24.1±4.9 | 36.9±4.4 | 100 | |
| 32.2±3.8 | 45.0±4.6 | 36.4±5.8 | 75.9±6.2 | ||||
| DZ | 3.0±1.4 | 100 | 2.9±1.5 | 100 | 2.8±1.1 | 100 | |
| Degraded | SZ | 10.6±3.3 | 35.0±4.8 | 10.4±3.1 | 44.2±4.9 | 11.4±3.8 | 100 |
| 50.1±5.8 | 65.0±5.6 | 45.1±5.4 | 55.8±5.2 | ||||
| MZ | 11.8±2.5 | 25.0±3.9 | 11.1±3.1 | 10.5±4.8 | 50.0±4.7 | 100 | |
| 47.9±4.8 | 75.0±4.2 | 47.2±5.9 | 89.5±6.2 | ||||
| DZ | 2.9±1.2 | 100 | 2.9±1.7 | 100 | 2.9±1.3 | 100 | |
For the 140μm results, SZ, MZ and DZ represent the three reliable pixels inside the entire thickness of articular cartilage (surface, middle deep). For the 35μm results, SZ, MZ and DZ represent the relevant zonal pixels that are located accurately inside the individual zones, which are based on the correlation μMRI study with the higher resolution optical microscopy (see the reference 17). For the 70μm results, the zonal locations of the pixels are less accurate.
DISCUSSION
An accurate and faithful measurement of multi-component T2 and T1ρ relaxations in tissue by either NMR or MRI is not trivial. In addition to the complex relaxation mechanism in biological tissues itself, the measurement can be influenced subtly by many factors related to the specimen specifics, instrumentation, experimental details, and data-analyzing methods. Finally, for a structured tissue like articular cartilage, the imaging resolution becomes a critical factor in the multi-component measurement because of the volume averaging. In this NMR and μMRI project, we aimed to investigate the influences of the common adjustable parameters in any practical experiments related to the multi-component T2 and T1ρ experiments. These parameters included: (1) the influence of the different pulse sequence (MSME, CPMG-SE) for T2 measurements; (2) the influence of bath solution (saline, PBS); (3) the influence of the image resolution in μMRI T2 experiments (from 35 μm to 140 μm); (4) the influence of the specimen orientation in the magnetic field (0°, 55°) on both T2 and T1ρ relaxation; and (5) the influence of the spin-lock frequencies on the T1ρ relaxation (from 0.5 kHz to 2 kHz).
Multi-component Relaxation by Different Pulse Sequences and Sample Inhomogeneity
To disassociate the complex influences of both the cartilage structure and imaging method on the multi-component relaxation measurement, the samples of agar gel and simple liquid solution were made in this investigation. Agar is a gelatinous substance with agarose as its predominant component, which has been studied in a number of NMR and MRI projects [29; 30]. The gel is commonly considered to have a two-system pool consisting of a liquid pool and a small semisolid pool with a T2 of 13 μs [30]. The echo spacing used in this imaging project was 1 ms, which prevented the identification of the rapidly relaxing component in the ranges of tens or hundreds of μs. Therefore, the only T2 component that could be measured under our experimental conditions represents the liquid pool in the gel sample [31; 32]. It’s also worth noting that the inhomogeneity of the gel sample and the existence of the tiny air bubbles in the gel could cause the artificial measurement of the multi T2 components, which is shown clearly in Fig 1.
The relaxation data of both solution and gel in Table 1 demonstrates unmistakably that a common imaging sequence MSME can cause the artificial T2 components in a homogeneous gel sample or even the liquid solutions. In addition, the values of the T2 components by MSME are resolution-dependent and about 40–70% shorter than the T2 values by the other imaging sequence CPMG-SE. Furthermore, the relative populations of the T2 components by MSME are also resolution dependent – the short T2 component would increase its population when the resolution is finer (i.e., the use of larger imaging gradients). These relaxation artifacts by MSME are probably not entirely surprising since its T2-weighting pulses are entangled with the spatial mapping pulses. In contrast, the CPMG-SE sequence [6] uses the magnetization-prepared approach [3], which completely separates the T2-weighting segment and the spatial mapping segment – hence the T2 relaxation is being weighted without the presence of any gradient. Consequently, the CPMG-SE sequence provides a much more faithful measurement of multiple T2 components.
Multi-component Relaxation by Different Tissue-soaking Solutions
In addition to the experimental factors, the T2 and T1ρ relaxations measurement of biological tissues also depends on the solution in which the tissue specimen is immersed. This is because biological samples commonly contain water molecules and macromolecules; the motional interactions between the bound water molecules and the macromolecules consequently play a significant role in the complex relaxation processes. As early as the 1960s, Berendsen and Migchelsen [33; 34] noticed that the addition of certain salts that contained proton-donating or proton-accepting ions could influence the proton NMR spectra of hydrated collagen in the same way as raising the temperature or increasing the water content. Salts were also found to be able to stabilize native conformations and to possess hydrogen-bonding properties that could increase the exchange rate between water molecules. Phosphate and ammonium ions were found to be the most effective, and to a lesser extent sulfate ions, but not some other salts such as NaCl (as in common saline). Several research groups [35; 36] successfully used the mechanism of proton exchange in water to explain the water dynamics in tendon and cartilage.
The native cartilage results summarized in Table 2 demonstrate the important role of the tissue soaking solution in the measurement of multi-component relaxation. The fact that the use of PBS can reduce the number of the T2 components from three to one (CPMG-SE sequence, 0° specimen orientation) provides solid evidence for the role of some ions in the relaxation mechanism. The reduction of the laminar appearance in MRI of articular cartilage when the tissue is soaked in PBS (Fig 3) is another example of the fast exchange between the bound water and free water, which was also shown previously in a high concentration (100 mM) of PBS solution [21]. The reduction of T2 components to one in the PBS experiments by CPMG-SE at both 0° and 55° implies that the fast exchanges between free and bound water occurs not only in the same zone, but also among different zones (SZ, TZ, RZ) in the presence of phosphate salt.
Averaged Multi-component T2 Relaxation of Cartilage
Having understood the complex roles of the experimental details and specimen-soaking solutions in the multi-component measurement, let’s turn our attention to the specific issues of multi-component T2 in articular cartilage, which have at least one additional complexity – the depth-dependent magic angle effect of T2 relaxation [4]. Because of the differences in the collagen orientation in each sub-tissue zone in the tissue, the T2 of articular cartilage in each zone naturally has different values as well as different orientational dependences [37; 38]. Consequently, the ability to resolve multi-components in cartilage could depend critically on the imaging resolution, i.e., the molecular and structural heterogeneity of the tissue within each imaging voxel. Furthermore, because of the multiple orientations in a single piece of the cartilage specimen, the various degrees of the dipolar interaction co-exist simultaneously in the specimen, which cannot be completely eliminated by simply setting the specimen at a particular orientation. The ability to resolve multi-components in a large voxel, therefore, depends on an even larger array of complex experimental and sample factors.
How many T2 components do we expect to see from a large voxel of articular cartilage that contains all possible cartilage structures? The T2 data in Table 2 are averaged from the entire tissue and provide the experimental verification to the possible results in the multi-component T2 measurement in low-resolution MRI or bulk spectroscopy. Provided that there is no cause of experimental artifacts, and all relaxation components can be resolved in the data analysis (i.e., an extremely short minimum echo time, a sufficient relaxation resolution, no overlaps in the relaxation values), the possible answers are listed below.
Case 1: One averaged component, when the chemical exchanges are sufficiently high among all pools of water and all zones of tissue structures;
Case 2: Two components (bound and free), when the chemical exchanges are not sufficiently high between two pools of water in the tissue that has no zonal structure;
Case 3: Three components (one for each structural zone), when the chemical exchanges are high enough among all pools of water but not sufficient for all zones of tissue structures, and when the dipolar interaction is not minimized (e.g., at 0°);
Case 4: Six components, two (bound and free) components for each structural zone, provided there is no overlap in the relaxation values. (We could also have four or five components, in the situation when one or two components overlap in value.)
The Case 1 situation occurs in this study when the CPMG-SE sequence is used to measure the tissue that is soaked in PBS, where the chemical exchanges are sufficiently high among all pools of water and all zones of tissue structures. The Case 2 situation did not occur in this articular cartilage study, but can happen in the studies of nasal cartilage and tendon, both have no complex zonal structures in their morphology [23; 39]. The Case 3 situation occurs in this study when the tissue is soaked in saline, where each of the three components represents each of the three structural zones. Compared to the lack of a laminar appearance when the tissue was in PBS [21], the clear laminar appearance when cartilage soaked in saline suggests the insufficient chemical exchange among different zones. The multi-components are, hence, due to the different relaxation times at different zones. When the dipolar interaction is minimized at the magic angle, the same experimental condition measures only one component regardless of the resolution.
When the MSME sequence is used, an additional short component could be resolved (see Table 1 results), if one has a sufficient relaxation resolution. Comparing the results in PBS between MSME and CPMG-SE, for example, the short T2 component with the fraction around 10% – 15% (depending upon the resolution) can be attributed to the artifacts caused by the MSME sequence. Since the T2 values in MSME are always shorter than the corresponding T2 values in CPMG-SE at the same imaging resolution, the saline results by MSME could have four components, the three components that can be measured by CPMG-SE, plus the artificial component. However, the ability to resolve the shortest T2 components depends critically on the minimum echo time in the experimental sequence. In our experiments, any component shorter than ~ 1.5 ms is probably not resolvable. Hence the MSME experiments can only measure two longer components in the T2 distribution.
Zonal Differentiated T2 relaxation of articular cartilage at 0°
Three T2 relaxation components (Table 2) in the full-thickness cartilage come from the multiple molecular architectures in its composition. Table 4 illustrates the trends and issues in the zonal differentiated T2 components in articular cartilage, which depends highly on the imaging resolution. When the resolution is low (70 μm, 140 μm in this study), T2 relaxation also shows two components in the surface part and middle part of the tissue, but only one component in the deep part of the tissue. The reason is the following.
Based on the work of high-resolution optical microscopy, we know in histology that each of the superficial and transitional zones occupies a small portion of the total tissue thickness [17]. In the low-resolution MRI, each of the surface and middle zones contains more than one type of the molecular architectures – the surface part contains the superficial and transitional zones, while the middle part contains the transitional and upper radial zone. Hence, in low-resolution MRI, each localized region still has more than one T2 component, due to the multiple architectures in its voxel composition. By comparison, the radial zone is known to be the thickest in the tissue (~ 75% of the total tissue) – hence the deep region only contains one architecture – the radial zone, where only one component can be measured. When the imaging resolution was high (35μm), the zonal results in this study were not equally divided – each contained only one type of the tissue architecture (based on the optical results [17]). Hence, in high-resolution MRI, only one T2 component is resolved in each zone. This conclusion of only one T2 component in cartilage is very important to the quantitative relaxation measurements in MRI, and also shows the significant potential difference between μMRI and clinical MRI.
The orientational dependent dispersion of T1ρ relaxation in native and degraded cartilage
T1ρ is known to be sensitive to the slow motional interactions between water and macromolecules (proteins) in biological tissues and has been used in clinical MRI as a diagnostic parameter for the cartilage quality [8; 40–42]. Compared to the T2 relaxation, the characteristic of T1ρ relaxation has one additional variable, the dispersion of its values that depends upon the strength of the spin-lock field, in which T2 can be considered as T1ρ at the zero spin-lock field. The data in Table 3 shows clearly that the value and population of T1ρ components depend strongly on the strength of the spin-lock field. In addition, the values of T1ρ and T2 are both sensible to the cartilage degradation by trypsin. In this project, the significant increase of T1ρ values after the trypsin degradation, especially at higher spin-lock strength (increased by 43 ms or 62% at a 2 kHz spin-lock field), confirms the superior sensitivity of T1ρ than T2 (maximum ~ 30% at the magic angle) towards the tissue degradation regardless of the specimen orientation.
It is interesting to see that at the low spin-lock fields (e.g., 500Hz), the bulk T2 and T1ρ both have multiple relaxation components, which can be attributed to the combination of multiple zones and, hence, the various degrees of dipolar interaction (results in lower T1ρ relaxation time at RZ than the values of SZ and TZ). When the spin-lock field is sufficiently high (1000 Hz or higher), T1ρ relaxation has only one component in MRI measurements. Finally, T1ρat 55° always shows one component, regardless of the strength of the spin-lock field. This orientation-dependent transition among multiple components and a single component implies that there are sufficient exchange processes in the tissue system that are able to mask the difference between different pools of water molecules when the dipolar interaction is minimized (at the magic angle).
When the tissue is degraded by trypsin, most of the GAG in cartilage is digested, with the remaining tissue containing a collagen matrix filled with a larger quantity of water. Although the zone-dependency of T2 relaxation values changed after trypsin degradation, the population changes in the T2 fractions at different zones were not significant before and after the trypsin treatment (~ 35% for SZ, ~ 40% for TZ, and ~ 25% for RZ). The GAG depletion would increase the free space inside the tissue matrix and the influx of water [20], but the low GAG fraction in cartilage means a stronger dipolar interaction at 0° [18]. Consequently, the sufficient high chemical exchange rate at each zone could reduce the change of the fractional distribution after the trypsin degradation. At the magic angle, due to the minimization of the dipolar interaction, only one component was found in both native and degraded tissue, which demonstrated that T2 has an excellent sensitivity toward the cartilage degradation (change from ~ 54 ms to ~ 70 ms) [8; 43].
Other Experimental Factors that can Influence the Multi-component Measurements
In addition to the experimental and sample factors that have been discussed so far in this report, several other factors could also influence the accurate measurement of multi-component relaxations in biological tissues. For example, a previous report revealed the generation of the artificial T2 components in the multi-component relaxation measurement by several other instrumental factors [6], including the use of a sample longer than the homogeneous length of the rf coil, the mis-match of the magnetic susceptibility between the sample and the solution, the reduction of accuracy of 90° and 180° rf pulses, and the bad shimming. Furthermore, one must have a sufficiently high resolution in the relaxation time scale to ensure the ability to resolve the possible components of multi-component relaxation times. Moreover, the effect of the frozen storage was shown to be able to introduce inaccurate measurement of relaxation components, due to the disruption of cartilage microstructure by the formation of the ice crystals [44]. Sufficient care must therefore be taken at all steps of the experiment to ensure a faithful measurement of multi-component relaxation.
In conclusion, the anisotropic T2 and T1ρ in articular cartilage are likely the indications of dipolar interaction-induced depth-dependency of relaxation times at different structural zones in the collagen matrix of the tissue. The transition between a mono-component and multi-component in articular cartilage demands the caution in interpreting the multi-component relaxation results, where the measurable values and numbers of the relaxation times could be subject to several experimental factors. For example, (a) Specimen orientation: there are more relaxation components at 0° than at the magic angle; (b) Pulse sequence: CPMG-SE sequence is robust and reliable, while MSME could cause artificial T2 components; (c) Bath solution: the ions in the bath solution can influence the measurable number of relaxation components; (d) Spin-lock strength: the components of T1ρ become less when the spin-lock strength is increased; (e) Imaging resolution: for articular cartilage or any other tissue/sample that has structural inhomogeneity, the measureable number of the relaxation components is imaging-resolution dependent. Finally, the changes in the T2 and T1ρ relaxation times due to the depletion of the tissue’s proteoglycans could be used in future clinical MRI study of connective tissues.
Research Highlights.
Articular cartilage has multiple T2 and T1ρ relaxation components by μMRI
Multi-slice multi-echo imaging sequence results in artificial relaxation component
Cartilage soaking in PBS reduces the number of observable relaxation components
Cartilage orientation affects the quantification of the multi-component relaxation
T1ρ spin-lock strength affects the quantification of the multi-component relaxation
The imaging resolution affects the quantification of the multi-component relaxation.
Acknowledgments
Yang Xia is grateful to the National Institutes of Health for the R01 grant (AR 052353). The authors are indebted to Drs. Cliff Les and Hani Sabbah (Henry Ford Hospital, Detroit) for providing the canine specimens, Mr. Farid Badar (Dept of Physics, Oakland University) for helping with the tissue harvest and data analysis, and Ms. Carol Searight (Dept of Physics, Oakland University) for editorial comments.
Grant Support: NIH R01 grant (AR 052353)
Footnotes
Publisher's Disclaimer: This is a PDF file of an unedited manuscript that has been accepted for publication. As a service to our customers we are providing this early version of the manuscript. The manuscript will undergo copyediting, typesetting, and review of the resulting proof before it is published in its final citable form. Please note that during the production process errors may be discovered which could affect the content, and all legal disclaimers that apply to the journal pertain.
References
- 1.Fullerton G, Cameron I, Ord V. Orientation of tendons in the magnetic field and its effect on T2 relaxation times. Radiol. 1985;155:433–435. doi: 10.1148/radiology.155.2.3983395. [DOI] [PubMed] [Google Scholar]
- 2.Peto S, Gillis P. Fiber-to-field angle dependence of proton nuclear magnetic relaxation in collagen. Magn Reson Imaging. 1990;8:705–12. doi: 10.1016/0730-725x(90)90005-m. [DOI] [PubMed] [Google Scholar]
- 3.Xia Y. Relaxation anisotropy in cartilage by NMR microscopy (μMRI) at 14-μm resolution. Magn Reson Med. 1998;39:941–949. doi: 10.1002/mrm.1910390612. [DOI] [PubMed] [Google Scholar]
- 4.Xia Y, Moody JB, Alhadlaq H. Orientational dependence of T2 relaxation in articular cartilage: A microscopic MRI (μMRI) study. Magn Reson Med. 2002;48:460–9. doi: 10.1002/mrm.10216. [DOI] [PubMed] [Google Scholar]
- 5.Reiter DA, Lin PC, Fishbein KW, Spencer RG. Multicomponent T2 relaxation analysis in cartilage. Magn Reson Med. 2009;61:803–9. doi: 10.1002/mrm.21926. [DOI] [PMC free article] [PubMed] [Google Scholar]
- 6.Zheng S, Xia Y. On the measurement of multi-component T2 relaxation in cartilage by MR spectroscopy and imaging. Magn Reson Imaging. 2010;28:537–45. doi: 10.1016/j.mri.2009.12.006. [DOI] [PMC free article] [PubMed] [Google Scholar]
- 7.Du J, Diaz E, Carl M, Bae W, Chung CB, Bydder GM. Ultrashort echo time imaging with bicomponent analysis. Magn Reson Med. 2012;67:645–9. doi: 10.1002/mrm.23047. [DOI] [PubMed] [Google Scholar]
- 8.Wang N, Xia Y. Depth and orientational dependencies of MRI T2 and T1rho sensitivities towards trypsin degradation and Gd-DTPA(2-) presence in articular cartilage at microscopic resolution. Magn Reson Imaging. 2012;30:361–70. doi: 10.1016/j.mri.2011.10.004. [DOI] [PMC free article] [PubMed] [Google Scholar]
- 9.Xia Y, Zheng S, Szarko M, Lee J. Anisotropic properties of bovine nasal cartilage. Microsc Res Tech. 2012;75:300–6. doi: 10.1002/jemt.21058. [DOI] [PMC free article] [PubMed] [Google Scholar]
- 10.Mlynarik V, Szomolanyi P, Toffanin R, Vittur F, Trattnig S. Transverse relaxation mechanisms in articular cartilage. J Magn Reson. 2004;169:300–7. doi: 10.1016/j.jmr.2004.05.003. [DOI] [PubMed] [Google Scholar]
- 11.Henkelman RM, Stanisz GJ, Kim JK, Bronskill MJ. Anisotropy of NMR properties of tissues. Magn Reson Med. 2005;32:592–601. doi: 10.1002/mrm.1910320508. [DOI] [PubMed] [Google Scholar]
- 12.Haken R, Blumich B. Anisotropy in tendon investigated in vivo by a portable NMR scanner, the NMR-MOUSE. J Magn Reson. 2000;144:195–9. doi: 10.1006/jmre.2000.2040. [DOI] [PubMed] [Google Scholar]
- 13.Takamiya H, Kusaka Y, Seo Y, Noguchi M, Ikoma K, Morimoto T, Hirasawa Y. Characteristics of Proton NMR T2 Relaxation of Water in the Normal and Regenerating Tendon. Japanese J Physiol. 2000;50:569–576. doi: 10.2170/jjphysiol.50.569. [DOI] [PubMed] [Google Scholar]
- 14.Zheng S, Xia Y. Multi-components of T2 relaxation in ex vivo cartilage and tendon. J Magn Reson. 2009;198:188–96. doi: 10.1016/j.jmr.2009.02.005. [DOI] [PMC free article] [PubMed] [Google Scholar]
- 15.Maroudas A. Biophysical Chemistry Of Cartilaginous Tissues With Special Reference To Solute And Fluid Transport. Biorheology. 1975;12:233–248. doi: 10.3233/bir-1975-123-416. [DOI] [PubMed] [Google Scholar]
- 16.Venn M, Maroudas A. Chemical composition and swelling of normal and osteoarthrotic femoral head cartilage. I. Chemical composition. Annals Rheumatic Diseases. 1977;36:121–129. doi: 10.1136/ard.36.2.121. [DOI] [PMC free article] [PubMed] [Google Scholar]
- 17.Xia Y, Moody J, Burton-Wurster N, Lust G. Quantitative in situ correlation between microscopic MRI and polarized light microscopy studies of articular cartilage. Osteoarthritis Cartilage. 2001;9:393–406. doi: 10.1053/joca.2000.0405. [DOI] [PubMed] [Google Scholar]
- 18.Xia Y. Magic-angle effect in magnetic resonance imaging of articular cartilage: a review. Invest Radiol. 2000;35:602–21. doi: 10.1097/00004424-200010000-00007. [DOI] [PubMed] [Google Scholar]
- 19.Keinan-Adamsky K, Shinar H, Navon G. Multinuclear NMR and MRI studies of the maturation of pig articular cartilage. Magn Reson Med. 2006;55:532–40. doi: 10.1002/mrm.20775. [DOI] [PubMed] [Google Scholar]
- 20.Reiter DA, Roque RA, Lin PC, Doty SB, Pleshko N, Spencer RG. Improved specificity of cartilage matrix evaluation using multiexponential transverse relaxation analysis applied to pathomimetically degraded cartilage. NMR Biomed. 2011;24:1286–94. doi: 10.1002/nbm.1690. [DOI] [PMC free article] [PubMed] [Google Scholar]
- 21.Zheng S, Xia Y. Effect of phosphate electrolyte buffer on the dynamics of water in tendon and cartilage. NMR Biomed. 2009;22:158–64. doi: 10.1002/nbm.1294. [DOI] [PMC free article] [PubMed] [Google Scholar]
- 22.Xia Y, Farquhar T, Burton-Wurster N, Vernier-Singer M, Lust G, Jelinski L. Self-diffusion monitors degraded cartilage. Archives Biochem Biophys. 1995;323:323–328. doi: 10.1006/abbi.1995.9958. [DOI] [PubMed] [Google Scholar]
- 23.Wang N, Xia Y. Dependencies of multi-component T2 and T1rho relaxation on the anisotropy of collagen fibrils in bovine nasal cartilage. J Magn Reson. 2011;212:124–32. doi: 10.1016/j.jmr.2011.06.031. [DOI] [PMC free article] [PubMed] [Google Scholar]
- 24.Lawson CL, Hanson RJ. Solving least squares problems. 1974 [Google Scholar]
- 25.Whittall KP, Mackay AL. Quantitative interpretation of NMR relaxation data. J Magn Reson. 1989;84:134–152. [Google Scholar]
- 26.Whittall KP, Bronskill MJ, Henkelman RM. Investigation of analysis techniques for complicated NMR relaxation data. J Magn Reson (1969) 1991;95:221–234. [Google Scholar]
- 27.Graham SJ, Stanchev PL, Bronskill MJ. Criteria for analysis of multicomponent tissue T2 relaxation data. Magn Reson Med. 1996;35:370–8. doi: 10.1002/mrm.1910350315. [DOI] [PubMed] [Google Scholar]
- 28.Saab G, Thompson RT, Marsh GD. Multicomponent T2 relaxation of in vivo skeletal muscle. Magn Reson Med. 1999;42:150–7. doi: 10.1002/(sici)1522-2594(199907)42:1<150::aid-mrm20>3.0.co;2-5. [DOI] [PubMed] [Google Scholar]
- 29.Waiter GD, Foster MA. Lanthanide-EDTA doped agarose gels for use in NMR imaging phantoms. Magn Reson Imaging. 1997;15:929–38. doi: 10.1016/s0730-725x(97)00139-2. [DOI] [PubMed] [Google Scholar]
- 30.Henkelman RM, Huang XM, Xiang QS, Stanisz GJ, Swanson SD, Bronskill MJ. Quantitative interpretation of magnetization transfer. Magn Reson Med. 1993;29:759–766. doi: 10.1002/mrm.1910290607. [DOI] [PubMed] [Google Scholar]
- 31.Jones CK. Medical Biophysics. The University of Western Ontario; London: 1997. Quantitative Multi-component T2 Analysis using Fast Spin-Echo MRI. [Google Scholar]
- 32.Portnoy S, Stanisz GJ. Is a two-pool MT model valid in tissues with multicomponent T2? ISMRM, Seattle. 2006:2110. [Google Scholar]
- 33.Berendsen H, Migchelsen C. Hydration structure of fibrous macromolecules. Annals of the New York Acad Sci. 1965;125:365–379. [Google Scholar]
- 34.Berendsen H, Migchelsen C. Federation proceedings. 1966. Hydration structure of collagen and influence of salts; p. 998. [PubMed] [Google Scholar]
- 35.Meiboom S. Nuclear magnetic resonance study of the proton transfer in water. J Chem Phys. 1961;34:375. [Google Scholar]
- 36.Luz Z, Meiboom S. Rate and mechanism of proton exchange in aqueous solutions of phosphate buffer. J Am Chem Society. 1964;86:4764–4766. [Google Scholar]
- 37.Zheng S, Xia Y. The collagen fibril structure in the superficial zone of articular cartilage by μMRI. Osteoarthritis Cartilage. 2009;17:1519–1528. doi: 10.1016/j.joca.2009.05.013. [DOI] [PMC free article] [PubMed] [Google Scholar]
- 38.Zheng S, Xia Y, Badar F. Further studies on the anisotropic distribution of collagen in articular cartilage by μMRI. Magn Reson Med. 2011;65:656–63. doi: 10.1002/mrm.22648. [DOI] [PMC free article] [PubMed] [Google Scholar]
- 39.Wang N, Xia Y. Anisotropic analysis of multi-component T2 and T1rho relaxations in achilles tendon by NMR spectroscopy and microscopic MRI. J Magn Reson Imaging. 2013 doi: 10.1002/jmri.24012. [DOI] [PMC free article] [PubMed] [Google Scholar]
- 40.Regatte RR, Akella SV, Borthakur A, Kneeland JB, Reddy R. Proteoglycan depletion-induced changes in transverse relaxation maps of cartilage: comparison of T2 and T1rho. Acad Radiol. 2002;9:1388–94. doi: 10.1016/s1076-6332(03)80666-9. [DOI] [PubMed] [Google Scholar]
- 41.Akella SV, Regatte RR, Wheaton AJ, Borthakur A, Reddy R. Reduction of residual dipolar interaction in cartilage by spin-lock technique. Magn Reson Med. 2004;52:1103–9. doi: 10.1002/mrm.20241. [DOI] [PubMed] [Google Scholar]
- 42.Li X, Pai A, Blumenkrantz G, Carballido-Gamio J, Link T, Ma B, Ries M, Majumdar S. Spatial distribution and relationship of T1rho and T2 relaxation times in knee cartilage with osteoarthritis. Magn Reson Med. 2009;61:1310–8. doi: 10.1002/mrm.21877. [DOI] [PMC free article] [PubMed] [Google Scholar]
- 43.Wang N, Xia Y. Orientational dependent sensitivities of T2 and T1rho towards trypsin degradation and Gd-DTPA2-presence in bovine nasal cartilage. MAGMA. 2012;25:297–304. doi: 10.1007/s10334-011-0288-1. [DOI] [PMC free article] [PubMed] [Google Scholar]
- 44.Reiter DA, Peacock A, Spencer RG. Effects of frozen storage and sample temperature on water compartmentation and multiexponential transverse relaxation in cartilage. Magn Reson Imaging. 2011;29:561–7. doi: 10.1016/j.mri.2010.10.011. [DOI] [PMC free article] [PubMed] [Google Scholar]