Abstract
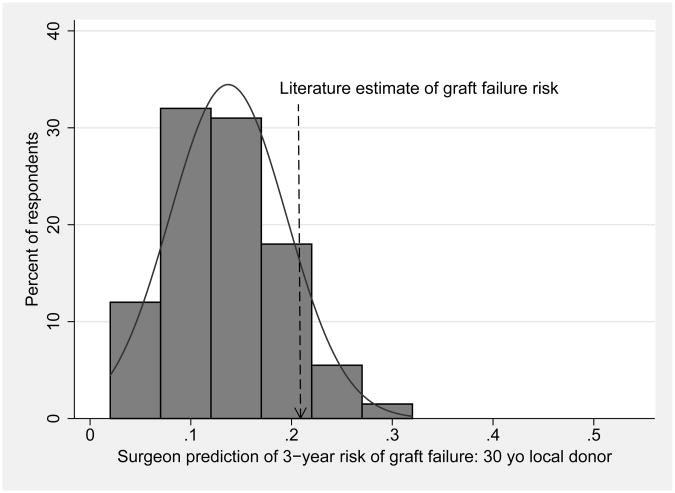
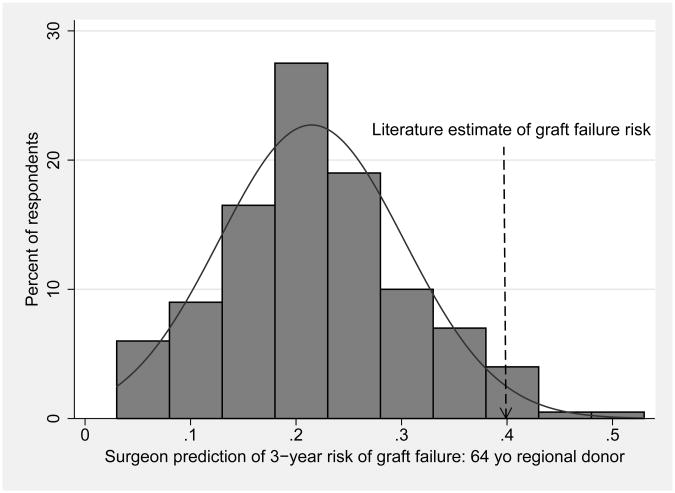
The decision to accept or decline a liver allograft for a patient on the transplant waiting list is complex. We hypothesized that surgeons are not accurate at predicting donor-specific risks. Surgeon members of the American Society of Transplant Surgeons were invited to complete a survey in which they predicted 3-year risk of graft failure for a 53 year old man with alcoholic cirrhosis and Model for End-stage Liver Disease score of 21, with a liver from each of the following: 1) 30 year old local donor with traumatic brain death, or 2) 64 year old regional donor with brain death from stroke. Complete responses were obtained from 201 surgeons, whose self-reported case volume represents the majority of liver transplants in the United States. Surgeon-predicted 3-year graft failure risk varied widely, by more than ten-fold. In scenario 1, 90% of respondents provided lower estimates of graft failure risk than the literature-derived estimate of 21% (p<0.001). In scenario 2, 96% of responses were lower than the literature-derived estimate of 40% (p<0.001). In conclusion, transplant surgeons vary widely in their predictions of donor-specific risk of graft failure, and demonstrate systematic bias towards inaccurately low estimates of graft failure – particularly for higher risk organs.
Keywords: donor risk index, organ acceptance, decision making
Introduction
Deceased donor livers available for transplantation vary widely in quality. Donor characteristics such as age, cause of death, and ischemia time can make the difference between a 20% rate of graft failure and a 40% rate of graft failure by 3 years after transplantation.(1)
Each time an organ is offered, the surgeon and potential recipient must decide whether to accept that offer or wait in hopes that a better one will come along. These decisions are high-risk ones; a recent study revealed that 84% of patients who die on the waiting list had previously declined at least one organ offer.(2) These decisions are also complex ones. Surgeons must incorporate multiple donor factors, recipient factors, and donor-recipient interactions, as well as the local magnitude of organ shortage and various technical and logistical concerns. Thus, it is perhaps not surprising that decisions about organ quality vary widely by transplant center, and are susceptible to cognitive biases and external forces such as policy changes and competition between centers.(3-5)
For these reasons, we hypothesized that surgeons are not accurate at predicting donor-specific risks. We performed a nationwide survey to test this hypothesis.
Methods
Survey Design
Surgeon members of the American Society of Transplant Surgeons (ASTS) were invited by email to complete an online survey in which they were provided clinical scenarios and asked to predict the probability of death or graft failure (hereafter referred to as simply “graft failure”). Emails were sent in an anonymous fashion via the ASTS administration. The survey, which is shown in Appendix A, was designed to test the following primary hypotheses:
H1– The variance between surgeons in estimates of the probability of graft failure will be high.
H2– As a group, the surgeon-predicted graft failure rate for higher risk organs will be systematically low when compared to quantitative metrics such as the Donor Risk Index (DRI).
Three scenarios were presented. The first two scenarios were constructed based on the following literature evidence:
Scenario 1:
Average risk recipient: 53 year-old man with diabetes and alcoholic cirrhosis complicated by ascites and encephalopathy, Model for End-stage Liver Disease (MELD) score 21.(5)
Low risk donor: 30 year-old white male with brain death from a gunshot wound, local share (DRI 1.0, 3-year graft failure risk 21%).(1)
Scenario 2:
Average risk recipient: 53 year-old man with diabetes and alcoholic cirrhosis complicated by ascites and encephalopathy, Model for End-stage Liver Disease (MELD) score 21.(5)
High risk donor: 64 year-old black male with brain death from a stroke, regional share (DRI 2.3, 3-year graft failure risk 40%).(1)
The order of these scenarios was randomly alternated, in order to test for the phenomenon of anchoring. We also hypothesized that surgeons would weigh post-transplant outcomes more heavily than pre-transplant outcomes, and tested this hypothesis by presenting a third scenario:
Scenario 3:
Donor: 64 years old
Recipient A: hepatitis C cirrhosis and MELD of 32 OR
Recipient B: alcoholic cirrhosis and MELD of 17
Finally, respondents were asked what percentage of time visual inspection plays a dominant role in the acceptance decision. Given the anonymous nature of the survey, we did not know which of the 1029 individuals in the ASTS database actively perform liver transplantation. Therefore, the email requested participation only from surgeons who currently perform liver transplantation. In order to estimate the response rate among surgeons who actively perform liver transplantation, we asked respondents to report their personal liver transplant volume and compared the sum of responses to national data. This study was exempted from oversight by our Institutional Review Board.
Statistical Analysis
In order to test hypothesis 1, responses of graft failure estimates were displayed graphically, and variance in responses was compared visually to that of random chance. Twenty of 201 responses were outliers and presumed to reflect inadvertent surgeon response of the probability of graft survival rather than graft failure; those responses were inverted to graft failure for the primary analyses, and sensitivity analyses were also performed by excluding those respondents. In order to test hypothesis 2, comparison between the responses and the literature-derived estimates was done using the Kolmogorov-Smirnov test for equality of distribution. The Student t-test was used to determine whether responses were influenced by the order of the scenarios, and linear regression was used to determine any association between responses and surgeon characteristics such as transplant volume and time since completion of fellowship.
Results
Emails were sent to 1029 ASTS members, and complete responses were obtained from 201 individuals who reported that they currently perform liver transplantation. Based on self-reported case volume, these 201 surgeons were responsible for 6,156 (97%) of the 6,342 liver transplants performed in the United States in 2011. The median time since completion of fellowship was 11 years, compared to 15 years in the entire ASTS database (p<0.001). Almost 90% (180/201) of respondents indicated that the surgeon fielding the offer is the same one who performs the transplant at their center.
Surgeons' predictions of 3-year risk of death or graft failure varied widely and were systematically low when compared to literature-derived estimates, as shown in Table 1 and Figure 1. Figure 1 displays the responses in histogram format with overlaid normal distribution curves, demonstrating that variation in responses approximates what would be expected by random chance. In scenario 1, 90% of respondents provided lower estimates of graft failure risk than the literature-derived estimate of 21%. In scenario 2, 96% of responses were lower than the literature-derived estimate of 40%. These differences between surgeon predictions and literature-derived estimates were statistically significant (p<0.001 for both comparisons).
Table 1.
Surgeon predictions of 3-year risk of graft failure, compared to estimates from the literature. Estimates are systematically low, particularly for the higher risk scenario.
| Scenario | Response (median) | Estimate from literature | P-value |
|---|---|---|---|
| 1: 30 year old local white donor, brain death from trauma, average risk recipient | 15% | 21% | P<0.001 |
| 2: 64 year old regional black donor, brain death from stroke, average risk recipient | 20% | 40% | P<0.001 |
Figure 1. Surgeon predictions of 3-year risk of death or graft failure, with overlaid normal distribution curves, for a) 30 year-old local donor, and b) 64 year-old regional donor.
Respondents who received scenario 1 first provided a mean graft failure estimate of 13.7%, compared to a mean estimate of 13.8% among those who received scenario 1 second (P=0.9). Respondents who received scenario 2 second provided a mean estimate of 19.8%, compared to a mean estimate of 23.2% among those who received scenario 2 first (P=0.02). This is suggestive evidence that responses to scenario 2 were influenced by question order, and that surgeons' decisions about high risk organs may be anchored more by their most recent experience than by their overall experience and published literature. Sensitivity analysis, in which we excluded subjects who appeared to have responded with graft survival rather than graft failure, did not change the results (data not shown).None of the individual variables (years of practice, individual case volume, who fields the offers, or opinion regarding visual inspection) were significantly associated with responses to the clinical scenarios (data not shown).
In scenario 3, respondents were asked to choose whether a liver from a 64 year old donor should go to A) a 53 year old recipient with hepatitis C and lab MELD of 32, or B) a 53 year old recipient with alcoholic cirrhosis and lab MELD of 17. As shown in Table 2, 74% chose recipient A, suggesting that most surgeons adhere to the spirit of allocation rules by considering risk of death on the waiting list over predicted post-transplant outcome.
Table 2. Recipient choices for a liver from an older donor.
| Preferred recipient for liver from 64 year old donor | N(%) respondents |
|---|---|
| 53 year old woman with HCV cirrhosis and MELD 32 | 149 (74%) |
| 53 year old woman with alcoholic cirrhosis and MELD 17 | 52 (26%) |
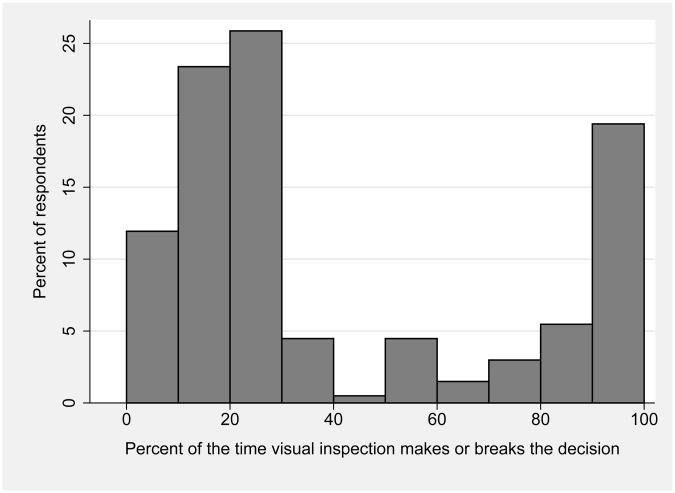
There was a bimodal distribution of responses regarding the role of visual inspection of the donor liver in the decision to transplant a particular organ, as shown in Figure 2. Two-thirds of respondents replied that visual inspection played a critical role in <40% of cases, while one-fifth replied that it played a critical role in 80%-100% of cases.
Figure 2.
Surgeons' opinions regarding importance of visual inspection in deciding whether to accept liver allografts.
Discussion
This study demonstrated that liver transplant surgeons vary widely in their estimates of the probability of graft failure for specific clinical scenarios. Furthermore, as a group, surgeons' estimates of graft failure probability were systematically low when compared to evidence-based estimates from the literature – particularly for higher risk organs. These findings suggest that surgeons are not accurate at predicting donor-specific risks, and may provide a partial explanation for the wide variability in organ acceptance practices.(2, 5)
These data should not be interpreted as critical of surgeons, but should instead highlight the complexity of organ offer decisions. Currently, the myriad data available with an organ offer are evaluated using mental math and gestalt opinion. Such situations, particularly when the risks are high, lead to numerous human inconsistencies and biases which are the topic of an entire field of study termed behavioral economics.(6) We hypothesize that the availability of a point-of-care decision aid could improve the consistency and accuracy of organ acceptance decisions, and thus potentially improve patient outcomes. Such a tool would not be intended to replace clinical judgment, but rather to augment it. In fact, the literature on physician decision support suggests that in many situations it is the so-called expert physicians whose judgment is aided the most.(7) We are currently developing such a tool, which estimates the probability of survival for a given patient by accepting a given organ offer, versus waiting for another one to come along.
The main limitation of this study was the lack of a true gold standard for expected rates of graft failure. The scenarios were created to correspond to categories of the DRI, which was derived from data that are now more than 10 years old. Additionally, some of the variation in responses may reflect true differences in outcomes between centers. Furthermore, given space constraints and in order to limit response burden, the scenarios lacked many clinical details that would normally accompany an organ offer. Therefore, these findings may reflect in part the limitations of currently available prognostic tools. However, the lack of precision in the gold standard is unlikely to fully explain the 10-fold variation in risk estimation by respondents. Finally, none of these limitations can explain the systematic underestimation of risk by respondents.
The choice of a survey study is a second limitation, in that respondents may have been systematically different from non-respondents. Although we received responses from only 201 out of 1029 ASTS members, the most appropriate denominator would have been the number of ASTS members who actively perform liver transplants. This number is unknown, although certainly less than the total ASTS membership. The self-reported personal case volumes of respondents may be overestimated, since there are approximately 105 liver transplant centers in the U.S. and many centers have more than 2 surgeons. Nonetheless, the case volume calculation does suggest that the respondents included the majority of surgeons in the U.S. who are actively performing liver transplants. Finally, we chose the endpoint of 3-year graft survival because this is the most relevant to donor quality – short term outcomes are driven largely by recipient and operative characteristics, while intermediate-term outcomes are significantly influenced by disease recurrence, and other factors mediated by donor characteristics.(1) Risk factors for 1-year and 3-year graft failure are highly correlated, so we feel it is unlikely that the findings would have been different had 1-year graft failure been the primary outcome.
In summary, transplant surgeons are not accurate at predicting donor-specific risks. These findings suggest that organ acceptance decisions may be improved by a point-of-care decision support tool.
Acknowledgments
This study was funded by K23-DK085204 from the National Institute of Diabetes and Digestive and Kidney Diseases (MLV).
Abbreviations
- MELD
Model for End-stage Liver Disease
- ASTS
American Society of Transplant Surgeons
Appendix.
Survey instrument
Email script (via ASTS):
Title: Test your ability to predict liver graft failure
Body of email:
Dear Dr. XX
We would like to invite you to test your skills at predicting graft failure and donor-recipient matching in liver transplantation. The link below will provide 3 clinical scenarios, and you will be given the opportunity to compare your estimates to those derived from the literature. This exercise will take less than five minutes, and is part of an IRB-approved research study. Please feel free to contact us with any questions. We hope you choose to participate.
LINK to survey
Click here if you do not currently perform liver transplantation
Sincerely, Robert Merion, MD, Michael Volk, MD, University of Michigan
Survey read exactly as follows: (order of questions 1, 2 randomly alternated)
For the following two scenarios, please estimate the probability of death or graft failure:
1) You are evaluating a liver offer for a 53 year-old man with alcoholic cirrhosis complicated by ascites and encephalopathy. His lab MELD is 21, and his only comorbidity is diabetes. The donor is a 30 year-old white male from the local OPO, with brain death from a gunshot wound, who is hemodynamically stable.
The 3-year risk of death or graft failure is:
2) You are evaluating a liver offer for a 53 year-old man with alcoholic cirrhosis complicated by ascites and encephalopathy. His lab MELD is 21, and his only comorbidity is diabetes. The donor is a 64 year-old black female from a regional OPO, with brain death from a stroke, who is hemodynamically stable.
The 3-year risk of death or graft failure is:
3) You are evaluating a liver from a 64 year-old white male donor from the local OPO, with brain death from a gunshot wound, blood type AB. There are two potential recipients, and you project a 1-month wait for the next AB offer.
Please indicate which of the following patients you would use this organ for:
53 year-old woman with Hepatitis C cirrhosis who has a lab MELD of 32.
53 year-old woman with alcoholic cirrhosis who has a lab MELD of 17.
Last 4 questions:
How many liver transplants do you personally perform each month?
How many years since you completed your fellowship?
At your institution, is the surgeon fielding liver offers usually the one performing the transplant?
What percent of the time does visual inspection of the liver make or break the decision to accept that organ?
Footnotes
The authors have no relevant conflicts of interest.
References
- 1.Feng S, Goodrich NP, Bragg-Gresham JL, Dykstra DM, Punch JD, DebRoy MA, et al. Characteristics associated with liver graft failure: the concept of a donor risk index. Am J Transplant. 2006;6(4):783–90. doi: 10.1111/j.1600-6143.2006.01242.x. [DOI] [PubMed] [Google Scholar]
- 2.Lai JC, Feng S, Roberts JP. An examination of liver offers to candidates on the liver transplant wait-list. Gastroenterology. 2012;143(5):1261–5. doi: 10.1053/j.gastro.2012.07.105. [DOI] [PMC free article] [PubMed] [Google Scholar]
- 3.Volk ML, Lok AS, Pelletier SJ, Ubel PA, Hayward RA. Impact of the model for end-stage liver disease allocation policy on the use of high-risk organs for liver transplantation. Gastroenterology. 2008;135(5):1568–74. doi: 10.1053/j.gastro.2008.08.003. [DOI] [PubMed] [Google Scholar]
- 4.Duan KI, Englesbe MJ, Volk ML. Centers for Disease Control ‘high-risk’ donors and kidney utilization. Am J Transplant. 2010;10(2):416–20. doi: 10.1111/j.1600-6143.2009.02931.x. [DOI] [PubMed] [Google Scholar]
- 5.Volk ML, Reichert HA, Lok AS, Hayward RA. Variation in organ quality between liver transplant centers. Am J Transplant. 2011;11(5):958–64. doi: 10.1111/j.1600-6143.2011.03487.x. [DOI] [PMC free article] [PubMed] [Google Scholar]
- 6.Schnier KE, Cox JC, McIntyre C, Ruhil R, Sadiraj V, Turgeon N. Transplantation at the nexus of behavioral economics and health care delivery. Am J Transplant. 2013;13(1):31–5. doi: 10.1111/j.1600-6143.2012.04343.x. [DOI] [PubMed] [Google Scholar]
- 7.Brailer DJ, Kroch E, Pauly MV. The impact of computer-assisted test interpretation on physician decision making: the case of electrocardiograms. Med Decis Making. 1997;17(1):80–6. doi: 10.1177/0272989X9701700109. [DOI] [PubMed] [Google Scholar]


