

Summary
Diurnal cortisol is a marker of HPA-axis activity that may be one of the biological mechanisms linking stressors to age-related health declines. The current study identified day-centered profiles of diurnal cortisol among 1,101 adults living in the United States. Participants took part in up to four consecutive days of salivary cortisol collection, assessed at waking, 30 minutes post-waking, before lunch, and before bedtime. Growth Mixture Modeling with latent time basis was used to estimate common within-day trajectories of diurnal cortisol among 2,894 cortisol days. The 3-class solution provided the best model fit, showing that the majority of study days (73%) were characterized by a Normative cortisol pattern, with a robust cortisol awakening response (CAR), a steep negative diurnal slope, coupled with low awakening and bedtime levels. Relative to this profile, diurnal cortisol on the remainder of days appeared either Elevated throughout the day (20% of days) or Flattened (7% of days). Relative to the Normative trajectory, the Elevated trajectory was distinguished by a higher morning cortisol level, whereas the Flattened trajectory was characterized by a high bedtime level, with weaker CAR and diurnal slope parameters. Relative to the Normative profile, Elevated profile membership was associated with older age and cigarette smoking. Greater likelihood of the Flattened cortisol pattern was observed among participants who were older, male, smoked cigarettes, used medications that are known to affect cortisol output, and reported poorer health. The current study demonstrates the value of a day-centered Growth Mixture Modeling approach to the study of diurnal cortisol, showing that deviations from the classic robust rhythm of diurnal cortisol are associated with older age, male sex, use of medications previously shown to affect cortisol levels, poorer health behaviors, and poorer self-reported health.
Keywords: Aging, Daily Diary, Diurnal Rhythm, HPA Axis, Latent Growth Curve Modeling, Mixture Modeling, Salivary Cortisol, Stress
1. Introduction
Cortisol is an integral component of the hypothalamic-pituitary-adrenal (HPA) axis, as it is one of the primary hormones to activate the body’s response to stress and mobilize energy stores (Chrousos and Gold, 1992). The classic diurnal pattern previously described in the literature is characterized by a marked cortisol awakening response (CAR) approximately 30 to 45 minutes after awakening in the morning, followed by a gradual drop (i.e., diurnal slope) throughout the rest of the waking hours. Although this diurnal waveform is moderately predetermined by heredity (Bartels et al., 2003), and is partially preprogrammed by the body’s central biological clock (Van Cauter et al., 1996), it is also dynamic in its response to many chronic and episodic behaviors and environments (Dickerson and Kemeny, 2004). Unlike the stress-responsive increases in cortisol, the CAR appears to be a distinct component of diurnal cortisol, primarily regulated by a preprogrammed endogenous circadian pacemaker (for reviews, see Van Cauter and Buxton, 2001; Fries et al., 2009; Clow et al., 2010a; Clow et al., 2010b). The CAR may mobilize the body’s energy reserves in light of awakening in the morning (Pruessner et al., 1997b), switch the immune system to daytime activity (Hucklebridge et al., 1999), and orient the self in time and space, and promote anticipation of the upcoming day’s events (Fries et al., 2009). The degree of subsequent decline of cortisol throughout the day, or the cortisol diurnal slope, may indicate an intact HPA-axis negative feedback loop, and has been hypothesized to represent an ability to recover and disengage from stressful events at the end of the day (Heim et al., 2000; Miller et al., 2007).
Although the precise physiological functions of diurnal cortisol are still unclear (e.g., Fries et al., 2009), a dysregulation in the diurnal rhythm has been associated with a number of health conditions, and may be an important marker of physiological activation that may be linked with individual differences in health among adults (Miller et al., 2007; Epel, 2009). For example, both relatively high and relatively low cortisol levels have been linked to a number of outcomes, and have been posited as dysregulated total output, as was elegantly stated in the classic work by Sapolsky and colleagues (1986, p. 285):
“[…] both an absence of and an overabundance of glucocorticoids during stress have profound, if contrasting, pathophysiological consequences, and an inability to appropriately terminate glucocorticoid secretion at the end of a stressor can ultimately be as damaging as the inability to appropriately initiate secretion at the onset of a stressors.”
Other studies have shown that in addition to total cortisol output, a disruption in the dynamic quality of diurnal cortisol across the day is also crucial to understanding the relation between health and diurnal cortisol. Much of the diurnal cortisol research shows that poorer outcomes are linked with a flattened or blunted profile; however, the great variability in operationalization of the flattened rhythm across different studies gives rise to a complex set of results. Flatter diurnal patterns that are characterized by either low or high overall cortisol output have both been linked to poorer outcomes (for review, see Heim et al., 2000). The hyperactive, but flat diurnal profile – typically distinguished by a high awakening level that remains relatively high throughout the rest of the day – has been associated with cigarette smoking (Steptoe and Ussher, 2006), older age (Van Cauter et al., 1996; Deuschle et al., 1997), and current stressor exposure (Miller et al., 2007). A hypoactive blunted diurnal profile – characterized by a relatively low waking level that is followed by a less negative diurnal slope throughout the day, and results in a relatively high bedtime level – has been linked with being male (Pruessner et al., 1997a; Wust et al., 2000), PTSD diagnosis among Holocaust survivors (Yehuda et al., 2005), chronic fatigue symptoms (Bower et al., 2005), and an increased time following cessation of an acute stressor (Miller et al., 2007).
Whereas a large body of previously-published studies have examined individual aspects of diurnal cortisol, there has been relatively little enquiry into simultaneous modeling of the entire cortisol rhythm within a day (cf. Adam et al., 2006). Moreover, relatively few studies have conducted a formal investigation into heterogeneity of the diurnal rhythm by identifying commonly-observed cortisol profiles (cf. Lasikiewicz et al., 2008; Van Ryzin et al., 2009; Kumari et al., 2010). The primary aim of the current study was to identify typical day-centered profiles of diurnal cortisol among a large heterogeneous sample of participants living in the United States. We used Growth Mixture Modeling (GMM) in order to identify latent groups of days based on distinct patterns of cortisol change over the day among a national sample of 1,101 adults, who provided a total of 2,894 days of salivary cortisol data. Finally, we examined the role of several demographic-, health- and stress-related predictors of cortisol profile membership.
2. Methods
2.1. Participants and procedure
The participants were from the second wave of The National Study of Daily Experiences (NSDE II), which is the daily diary satellite study of the larger National Survey of Midlife Development in the United States (MIDUS II) – a survey of non-institutionalized, English-speaking adults. A comprehensive description of NSDE methodology has been previously reported (Almeida et al., 2002). Briefly, NSDE II respondents (N=2,022) completed eight consecutive evening telephone interviews regarding their experiences during the previous 24 hours, including questions on daily stressors, positive events, sleep duration, daily health symptoms, psychological distress, and time use. The interviews were conducted by trained interviewers from the Pennsylvania State University’s Survey Research Center using a computer-aided telephone interview system (CATI). All respondents provided informed consent, and were compensated with $25 for taking part in the NSDE II protocol.
2.1.1. Demographic characteristics of participants
Following implementation of exclusion criteria (for details, see section 2.2.1.1. Selection of cortisol days for the analytic sample), the analytic dataset consisted of 2,894 complete cortisol days, provided by 1,101 participants. As shown in Table 1, approximately one-half of participants were women (56.2%), with age ranging from 34 to 87 years old (M=58.2, SD=12.1). Twenty eight percent (28.3%) of participants had at most graduated from high school or received a GED, 51.3% received at least some college education, and at most a college degree, and 20.3% attained at least some graduate education or more. The majority of participants described their primary racial origin as Caucasian (83%), ten percent of the sample reported their primary racial origin as Black/African American, and the remainder of the sample (7%) reported their primary racial origin as Asian, Native American/Alaska Native/Aleutian Islander/Eskimo, or “Other.”
Table 1.
Demographic characteristics of participants taking part in saliva collection: participants contributing days included in analysis vs. excluded participants (N=1,735)
| Characteristic | Analytic sample participants (n=1,101)
|
Excluded participants (n=634)
|
t(df) | χ2(df, N) | ||
|---|---|---|---|---|---|---|
| M(SD) | Missing N (%) |
M(SD) | Missing N (%) |
|||
| Age (yrs.) | 58.2 (12.1) | 0 (0.0) | 58.3 (11.9) | 0 (0.0) | 0.24 (1733) | |
| Sex (% Female) | 56.2 | 0 (0.0) | 56.9 | 0 (0.0) | 0.05 (1, 1735) | |
| Minority status (% Minority) | 16.4 | 3 (0.3) | 19.1 | 2 (0.3) | 1.05 (1, 1730) | |
| Education | 2 (0.2) | 1 (0.2) | ||||
| ≤HS/GED (%) | 28.3 | 34.5 | 7.50** (1, 1732) | |||
| Some college or college degree (%) | 51.3 | 48.1 | 1.81 (1, 1732) | |||
| Some graduate school or graduate degree (%) | 20.3 | 17.3 | 2.20 (1, 1732) | |||
| Medication use (%) | 32.3 | 31 (2.8) | 23.2 | 226 (35.6) | 1.00 (1, 1478) | |
| Any cigarette smoking (%) | 16.3 | 0 (0.0) | 14.8 | 0 (0.0) | 0.62 (1, 1735) | |
| Average number of cigarettes smoked per day | 1.8 (5.4) | 0 (0.0) | 1.8 (5.4) | 0 (0.0) | −0.12 (1733) | |
| Adult stressful life experiences (z-score) | 0.0 | 0 (0.0) | 0.0 | 0 (0.0) | −0.37 (1733) | |
| Self-reported global health | 7.5 (1.5) | 37 (3.4) | 7.4 (1.6) | 8 (1.3) | −0.22 (1688) | |
Note: N=1,428 for participants not missing values on any covariate (n=1,031 for analytic sample, n=397 for excluded sample).
p ≤ .01.
2.2. Measures
2.2.1. Salivary cortisol
Participants were instructed to collect four saliva samples on interview days 2 through 5 at the following times: immediately at waking (i.e., before getting out of bed), 30 minutes post-waking, before lunch, and immediately before bedtime (Almeida et al., 2009a). One week prior to the first interview, respondents received a Home Saliva Collection Kit, which provided written instructions and materials for collecting four saliva samples on days two through five of the eight interview days, for a maximum number of 16 samples per person. Each Home Saliva Collection Kit included an instruction sheet, a paper-pencil log where participants noted the date and time of saliva collection, and sixteen numbered and color-coded salivettes (Sarstedt, Nümbrecht, Germany), each containing a small absorbent wad, about 0.75 in long. Survey Research Center interviewers were trained to review collection instructions, and respond to participant queries regarding saliva collection.
Respondents were asked to abstain from eating, brushing teeth, or consuming any caffeinated products prior to collecting a saliva sample. Participants provided the exact collection timing of each saliva sample by recording the timing on a paper-pencil log, as well as by recalling the timing to the interviewer, as part of the evening daily diary interview. Additionally, approximately one-quarter of participants (n=430) received an electronic “smart box” (Cayuga Design, Ithaca, NY), which contained an unmarked computer chip that automatically records every instance when the box is opened. “Smart box” participants received instructions that were identical to those of the larger sample, and were not made aware of the purpose of the box. Concordance across all sources of collection times was high (Almeida et al., 2009a; Stawski et al., 2011), such that log- and interview-based collection self-reported times correlated more than .9, and self-reported and “smart box” times correlated between .75 (pre-bedtime occasion) and .95 (waking occasion).
When all salivettes were ready to be returned to study staff, each participant used a pre-addressed, pre-paid courier package for return mailing. Cortisol concentrations remain stable for up to 5 days of shipment conditions, despite exposure to widely varying temperatures and movement (Clements and Parker, 1998). The enclosed salivettes were shipped to the MIDUS Biological Core at the University of Wisconsin, where they were stored in an ultracold freezer at −60°C. Prior to assay, the salivettes were thawed and centrifuged at 3000 rpm for 5 minutes, yielding a clear fluid with low viscosity. The assays were conducted at the Biological Psychology Laboratory at the Technical University of Dresden. Cortisol concentrations were quantified with a commercially available luminescence immunoassay (IBL, Hamburg, Germany), with intra-assay and inter-assay coefficients of variation below 5% (Almeida et al., 2009a). We describe the selection criteria of cortisol days for the GMM analytic sample immediately below.
2.2.1.1. Selection of cortisol days for the analytic sample
Of the total sample of 2,022 NSDE II participants, 1,736 returned the saliva kit to study staff. The results of assays indicated that 26,902 (97%) out of the 27,776 possible saliva samples yielded reliable cortisol values. Of the samples excluded during assay, 418 were missed, 392 contained insufficient saliva volume to detect cortisol, 40 provided unreliable cortisol values, and 24 could not be linked to a specific interview day.
A number of additional exclusion criteria were applied, in keeping with previous research showing that high-integrity, reliable data are crucial in analysis of diurnal cortisol (for reviews, see Adam and Kumari, 2009; Schlotz, 2011; Kudielka et al., 2012). Excluded days may reflect non-compliance, a non-standard schedule, or a clinical subgroup, and an appropriate exploration of diurnal cortisol among these populations fall outside the scope of the current study. Thus, we chose to select days on which each participant demonstrated strict compliance with the saliva collection protocol, followed a typical sleep and waking schedule, and did not exhibit out-of-range salivary cortisol values.
The following exclusion criteria were applied to determine the analytic sample. Any sample with an extremely high cortisol value (i.e., ≥60 nmol/L) was recoded into a missing value, as was done in previously published work on this (e.g., Almeida et al., 2009b) and other samples (e.g., Kumari et al., 2010). Several procedures were followed to identify samples characterized by atypical schedules or possible non-compliance. Previous research illustrates that atypical sleep timing (Federenko et al., 2004) and duration (Van Cauter et al., 1996) affect cortisol level; thus, we excluded days on which a participant awoke prior to 0400h or after 1100h, or was awake for a total of less than 12 or more than 20 hours. The following two selection criteria were used to account for the importance of collection timing in capturing the CAR (Kudielka et al., 2003): (1) all days on which a participant delayed collection of the first waking sample by longer than 15 minutes after waking were excluded, and (2) all days on which a participant collected the 30-minute post-waking sample earlier than 15 or later than 45 minutes after his or her waking sample were excluded. In line with previous work using these data (e.g., Birditt et al., 2011; Taylor et al., 2011), we also excluded samples on which pre-lunch and pre-bedtime levels increased by more than 10 nmol/L in comparison to the 30-minute post-waking value, as a significant surge in cortisol following the CAR may indicate non-compliance (e.g., eating prior to sample collection). Finally, given the interest of the current study in cortisol rhythms throughout the entire waking period, a cortisol day was included in the analytic dataset only when a participant exhibited a valid value on all 4 sample occasions within a given day.
The final analytic sample consisted of 2,894 valid cortisol days, completed by 1,101 participants. On average, each participant provided 2.63 (SD=1.06) days of complete cortisol data, with 19.26%, 24.16%, 31.06%, and 25.52% contributing a maximum of 1, 2, 3, and 4 complete cortisol days, respectively. As shown in Table 1, in comparison to participants who provided at least one complete cortisol day for GMM analysis (n=1,101), excluded participants (n=634) were more likely to report completing at most a High School diploma or equivalent, χ2(1, N=1,732) = 7.50, p<.01. In addition to this comparison, we also examined predictors of increased probability of exhibiting a valid cortisol day among participants selected for the analytic sample. Results of this analysis showed that the following participant characteristics were associated with a lower probability of exhibiting a valid cortisol day: minority status (B=−0.31, SE=0.11, p<.01), higher adult stressful life experiences (B=−0.16, SE=0.04, p<.001), and poorer self-reported health (B=0.07, SE=0.03, p<.01).
2.2.4. Covariates
We examined the following predictors in relation to profile membership: medication use, cigarette smoking, gender, age, minority status, education level, adult stressful life experiences, and self-reported global health. The first two covariates were assessed at NSDE II, with the remainder measured at the MIDUS II baseline phone or self-administered questionnaires. NSDE II participants reported the number of cigarettes smoked since previous interview (or in the past 24 hours) on every interview day. To account for the effect of cigarette smoking on cortisol, a binary Any Cigarette Smoking variable was created to identify all individuals who had smoked at least one cigarette during the entire eight-day diary protocol, whereas Average Number of Cigarettes Smoked per Day was created to examine the effect of heavier smoking over and above the effect of any cigarette use, and was computed by averaging the number of cigarettes smoked across study days. A dichotomous Medication Use control variable was created to control for effects of any of the following six types of prescription and over-the-counter medicines that have been previously shown to influence cortisol levels: steroid inhalers, other types of steroid medications, medications or creams containing cortisone, birth control pills, and anti-depressant or anti-anxiety medications (Granger et al., 2009). Age at NSDE II was computed by adding the time lag between MIDUS II and NSDE II data collection to MIDUS II verified age. The majority of participants (82.7%) reported that their racial origins were solely Caucasian, whereas 17.0% reported at least some non-Caucasian racial background. Given the small proportion of non-Caucasian participants, we created a dichotomous variable indicating Minority Status to account for racial/ethnic background in analyses. The MIDUS II protocol did not include a continuous measure of years of education, thus, we created a categorical Education variable, distinguishing between participants attaining less than or equal to a High School diploma or equivalent, some college or college degree, and some graduate school or graduate degree. When entered as a covariate in substantive models, two dummy variables (i.e., ≤HS/GED, some college or college degree) were used to examine the effect of education. A measure of Adult Stressful Life Experiences was developed specifically for MIDUS II dataset (e.g., Slopen et al., 2010; Slopen et al., 2012), and consists of a standardized score of a number of stressful events experienced in the past five years, and earlier in adulthood (e.g., divorce, prolonged unemployment, death of a parent, death of a child, sexual assault, bankruptcy, combat). Global Self-Rated Health was assessed on the MIDUS II self-administered questionnaire, using 11-response categories ranging from 0 (Worst) to 10 (Best). Ninety four (93.6%; 1,031) of participants in the analytic sample completed all covariates-related measures.
2.3. Analytic approach
2.3.1. Growth mixture modeling
Growth Mixture Modeling (GMM; Muthén and Shedden, 1999) with latent time basis was used to identify patterns of diurnal cortisol (Ram and Grimm, 2009; Koss et al., 2012). GMM uses the Structural Equation Modeling framework to incorporate conventional Latent Growth Modeling with Latent Class Analysis (Muthén and Muthén, 2000). This model allows for estimation of mean growth parameters (e.g., intercepts, slopes) for classes within a heterogeneous population, as well as variability in growth parameters within each class. We chose to conduct GMM with a latent time basis, an approach that allows estimation of any non-linearity in growth across the day. Means and variances of intercepts and slopes, along with time and slope loadings, were unconstrained across groups. Given the substantive focus on naturally-occurring profiles in levels of cortisol, all analyses examined raw cortisol values, which were not statistically transformed to achieve normality. To account for non-normality typical of salivary cortisol level distributions, all GMM analyses employed maximum likelihood with robust standard errors (MLR) – an Mplus parameter estimator that is robust to non-normality in observations (Muthén and Muthén, 1998–2010).
2.3.2. Model selection
Models with 1 through 4 classes were estimated on the analytic sample of 2,894 valid cortisol days. The best fitting model was selected using the following criteria: (1) sample-size adjusted Bayesian information criterion (BIC) values, (2) Lo-Mendell-Rubin likelihood ratio tests (LRT), (3) parametric bootstrapped likelihood ratio test (BLRT), (4) average posterior probabilities within classes, (5) entropy values, (6) class sizes, (7) theoretical meaningfulness, (8) similarity across groups, and (9) interpretability of results.
The smallest BIC value determines the model that best fits the data, while simultaneously penalizing for additional number of parameters, ensuring that the most parsimonious model is chosen. The LRT (Lo et al., 2001) and BLRT (Nylund et al., 2007) provide a formal test of significance for the likelihood ratio statistic that compares a model with k groups to a model with k − 1 groups. Each class’s average posterior probability value represents a probability that the observed patterns belong to the assigned trajectory, with values approaching 1 indicating a high likelihood that days belong to an assigned class (Jung and Wickrama, 2008). Entropy is a related index, with values approaching 1 indicating high distinguishability between classes (Nagin, 1999). In addition, we made certain that no class was too small using previously described criteria (Jung and Wickrama, 2008). Finally, theoretical meaningfulness, similarity across groups, and interpretability of results were considered in determining the appropriate number of latent classes (Muthén and Muthén, 2000). Following selection of the best-fitting class solution, we assigned class membership to each individual day of study, based on highest posterior probability of membership (Hand and Yu, 2001; Vermunt, 2010).
2.3.3. Cortisol profile variability
Following group assignment, we examined the degree of day-to-day variability in profile membership by calculating an intraclass correlation coefficient (ICC), which decomposes the variance in profile membership into variability due to stable individual differences, and variability due to day-level factors. First, in order compare our data to previous work, we carried out a traditional variance decomposition analyses for cortisol level at each of the four daily occasions of measurement (Hruschka et al., 2005). That is, we calculated ICCs by estimating four unconditional two-level multilevel models for waking, 30min post-waking, pre-lunch, and pre-bedtime cortisol values. Second, an ICC was calculated by estimating unconditional two-level multilevel model (i.e., day profile memberships nested within individuals) for each of the three possible indicators of profile variability (i.e., Class 1 vs. Class 2 or 3, Class 2 vs. Class 1 or 3, and Class 3 vs. Class 1 or 2).
To examine predictors of variability, logistic regression was used to investigate the effect of covariates on the likelihood of exhibiting more than one type of profile across all 4 study days (i.e., variability) versus exhibiting only one type of profile across all 4 study days (i.e., consistency). The interest in day-to-day stability versus variability in this particular analysis precluded us from utilizing the full analytic sample, where participants varied from each other in the number of provided valid cortisol days. To reduce the effect of variability in number of provided days, and to maximize the number of days on which participants could exhibit consistency or variability in cortisol profile, we selected a subgroup of participants who provided all 4 days of valid diurnal cortisol data. The subgroup providing all 4 days (n=281) differed from the subgroup providing 1, 2 or 3 days (n=820) in the following ways: participants providing all 4 days reported fewer adult stressful life experiences (t(3.39)=1099, p<.01), higher self-reported health (t(−2.42)=1062, p<.05), and were less likely to be a minority χ2(1, N=1098)=11.85, p<.001).
2.3.4. Prediction of cortisol profile membership
Finally, we examined the role of covariates in predicting class membership. To predict class membership, an outcome that varies between persons, as well as between days, we used a repeated measures (i.e., two-level multilevel) multinomial logistic regression (Merlo et al., 2006). Use of multilevel modeling allowed us to account for nonindependence in the hierarchically structured data (i.e., daily profiles nested within individuals). In light of the current study’s focus in individual differences in cortisol profile membership, we examined predictors that did not vary on a daily level, and were thus entered into the model at Level 2. All analyses were carried out using Mplus, Version 6.12 (Muthén and Muthén, 1998–2010).
3. Results
The final analytic sample consisted of 2,894 valid cortisol days, completed by 1,101 participants. Across all analytic sample days, average cortisol values in nmol/L were the following: 14.85 (SD=8.39; range: 0.014–58.515) for waking samples; 21.70 (SD=10.95; range: 0.059–59.515) for 30min post-waking samples; 6.81 (SD=4.51; range: 0.043–46.487) for pre-lunch samples; and 2.85 (SD=3.42; range: 0.010–32.583) for pre-bedtime samples. On average, saliva samples were collected at 0640h (SD=0115h), 0711h (SD=0115h), 1237h (SD=0122h), and 2229h (SD=0116h), for waking, 30min post-waking, pre-lunch, and pre-bedtime samples, respectively.
3.1. Identification of cortisol profiles
The 3-class solution provided the best model fit1. Table 2 presents model fit indices for solutions estimating 1 through 4 classes. AIC, BIC, and sample-size adjusted BIC values dropped, as model complexity increased to incorporate three classes. The 3-class solution showed high entropy (i.e., .79), which was slightly higher than the entropy value of the 2-class solution. Moreover, all three likelihood ratio tests indicated that the 2-class solution provided better fit to these data than the single-class solution, and that, in turn, the 3-class solution exhibited significantly better fit than the 2-class solution (all p’s<.0001).
Table 2.
GMM model fit
| 1-Class | 2-Class | 3-Class | 4-Class | |
|---|---|---|---|---|
| Model Fit Information | ||||
| Loglikelihood H0 Value | −36879.41 | −35336.20 | −34793.74 | −34589.58 |
| Model Fit Information | ||||
| AIC | 73780.83 | 70710.41 | 69641.48 | 69249.16 |
| BIC | 73846.50 | 70823.84 | 69802.68 | 69458.12 |
| Adjusted BIC | 73811.55 | 70763.47 | 69716.89 | 69346.92 |
| Entropy | 0.76 | 0.79 | 0.80 | |
| LMR p-value | <0.0001 | <0.0001 | 0.0037 | |
| LMR adjusted p-value | <0.0001 | <0.0001 | 0.0040 | |
| BLRT p-value | <0.0001 | <0.0001 | <0.0001 | |
| Residual Variances | ||||
| Wake | 45.75 | 34.53 | 37.21 | 38.66 |
| 30min | 58.62 | 74.64 | 81.69 | 72.41 |
| Lunch | 15.02 | 18.11 | 8.91 | 6.72 |
| Bed | 7.72 | 0.44 | 0.36 | 0.41 |
Assessing improvement of the 4-class solution in relation to the 3-class solution was less straightforward. Although the BIC value dropped, the change was slight, when compared to the drops due to an increase in the number of classes to 2 or 3. The entropy and average probability values were comparable across the two solutions. The LRT showed that the 4-class solution provided improved fit (p<.001), whereas the BLRT failed to replicate in repeated bootstrap draws, suggesting that this solution may have converged on a local maximum and did not provide reliable estimates (Nylund et al., 2007). Moreover, additional inspection of the 4-class solution (not shown) revealed that one of the classes was relatively small (4% of days), and the two smallest classes (4% and 7% of days) produced cortisol trajectories that were not theoretically meaningful. Thus, we chose to further examine the 3-class solution.
Table 3 details parameter estimates and class sizes and proportions, and the Figure illustrates the trajectory of cortisol for the 3-class solution. Panel A of the Figure illustrates the average cortisol profile across all days, and panel B shows the three cortisol profiles estimated by the 3-class solution. Majority of the days (2,112 of days, 73%) belonged to Class 1, a Normative circadian cortisol rhythm profile, characterized by a robust CAR and diurnal slope, with relatively low awakening and bedtime levels. One fifth of the days (581 days, 20%) belonged to Class 2, an Elevated trajectory, distinguished by higher morning values, coupled with a relatively unpronounced CAR, and higher bedtime values. Finally, the smallest class (201 days, 7%), Class 3, had a Flattened pattern, characterized by a remarkable absence of the CAR, followed by stable-high levels throughout the rest of the day. All classes of the 3-class solution exhibited high average posterior probabilities (i.e., .93, .88, .90, for Class 1, 2, and 3, respectively). Assessment of non-objective criteria (as discussed in 2.3. Analytic approach) showed that the 3-class solution did not extract overly small classes, and produced interpretable profiles, which were sufficiently distinguishable from each other.
Table 3.
GMM class sizes and parameter estimates for the 3-class solution
| Class 1 “Normative” | Class 2 “Elevated” | Class 3 “Flattened” | |
|---|---|---|---|
| Est. class counts and proportions | 2014 (70%) | 654 (23%) | 225 (8%) |
| Final class counts and proportions | 2112 (73%) | 581 (20%) | 201 (7%) |
| Ave. posterior probabilities | 0.93 | 0.88 | 0.9 |
| Intercept mean | 13.36 | 19.89 | 13.87 |
| Slope mean | 11.86 | 15.11 | 4.61 |
| Intercept variance | 11.88 | 66.3 | 21.99 |
| Slope variance | 10.13 | 78.47 | 65.73 |
| Wake slope loading | 0 | 0 | 0 |
| 30min slope loading | 0.59 | 0.26 | 0.62 |
| Pre-lunch slope loading | −0.62 | −0.87 | 0.43 |
| Pre-bed slope loading | −1 | −1 | −1 |
Figure.
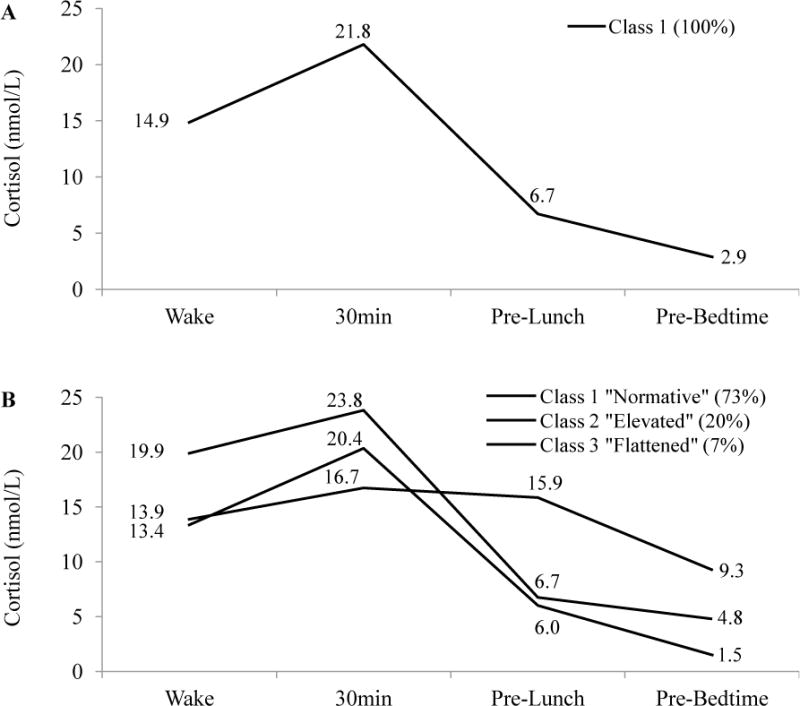
Estimated diurnal cortisol profiles, and final class proportions. (A) 1-class solution. (B) 3-class solution.
3.2. Intraindividual variability in cortisol profile membership
Variance decomposition of cortisol values at each of the four time points showed significant estimates for between- and within-person variability. The ICC values for waking, 30min post-waking, pre-lunch, and pre-bedtime occasions were the following: .425, .494, .340, .324. Moreover, analyses of variability in cortisol profile membership provided significant estimates for both, variability across people, and variability across days. ICCs were .293, .209, and .155 for Typical class (vs. Elevated or Flattened), Elevated class (vs. Typical or Flattened), and Flattened class (vs. Typical or Elevated), respectively.
Logistic regression predicting any inconsistency (Table 4) showed that men were more likely to exhibiting variability in cortisol profiles across 4 days. Specifically, women were 47% less likely to exhibit any variability in cortisol profiles across 4 days.
Table 4.
Logistic regression coefficients and odds ratios for predictors of cortisol profile inconsistency (N=281)
| Inconsistent (n=134) vs. Consistent (n=147) | ||
|---|---|---|
| Predictor | B(SE) | eB |
| Constant | 1.03 (1.08) | 2.80 |
| Age (yrs., centered at 50) | 0.01 (0.01) | 1.01 |
| Sex (0=Male) | −0.63* (0.27) | 0.53 |
| Minority status (0=Caucasian) | −0.20 (0.45) | 0.81 |
| Education ≤HS/GED | −0.67 (0.40) | 0.51 |
| Education some college or college degree | −0.26 (0.34) | 0.77 |
| Medication use (0=None) | 0.16 (0.28) | 1.17 |
| Any cigarette smoking (0=None) | 0.36 (0.49) | 1.43 |
| Average number of cigarettes smoked per day (centered at 20) | 0.05 (0.04) | 1.05 |
| Adult stressful life experiences (z-score) | −0.23 (0.16) | 0.79 |
| Self-reported global health | 0.03 (0.09) | 1.03 |
|
| ||
| Model χ2 | 16.43 | |
| df | 10 | |
| Nagelkerke R2 | 0.08 | |
Note: eb = odds ratio (exponentiated B). N=271 for participants not missing values on any covariate. (n=128 for inconsistent participants, n=143 for consistent participants).
p ≤ .05.
p ≤ .01.
p ≤ .001.
3.3. Predictors of cortisol profile membership
Table 5 presents results of a repeated measures multinomial logistic regression, showing logistic log-odds and odds ratios between covariates and likelihood of cortisol profile membership. Older age and cigarette smoking were associated with greater likelihood of a participant experiencing an Elevated trajectory, as compared to the Normative trajectory. A one-year increase in age was associated with a 2% increased likelihood of having an Elevated trajectory, while any cigarette use was associated with a 67% increased odds of having an Elevated trajectory (all p’s<.01). Older age, being male, medication use, cigarette smoking, and poorer self-rated health were all associated with increased likelihood of a participant experiencing a Flattened cortisol day, as opposed to a day with a Normative pattern. Specifically, the odds of experiencing a Flattened cortisol day increased by 2% with each additional year of age (p<.01), decreased by 42% among women relative to men (p<.001), increased by 39% among medication users, increased by 94% among cigarette smokers relative to non-smokers, and decreased by 11% with each one-unit increase in self-rated health (all p’s<.05)2.
Table 5.
Repeated measures multinomial logistic log-odds and odds ratios for predictors of cortisol membership (N=2,894 days)
| Class 1 “Normative” | ||||
|---|---|---|---|---|
| vs. Class 2 “Elevated”
|
Class 3 “Flattened”
|
|||
| Predictor | B(SE) | eB | B(SE) | eB |
| Intercept | −0.85** (0.38) | 0.38 | −1.47*** (0.56) | 0.23 |
| Age (yrs., centered at 50) | 0.02*** (<0.01) | 1.02 | 0.02*** (0.01) | 1.02 |
| Sex (0=Male) | −0.14 (0.10) | 0.87 | −0.55*** (0.16) | 0.58 |
| Minority status (0=Caucasian) | 0.07 (0.14) | 1.07 | 0.34 (0.21) | 1.41 |
| Education ≤HS/GED | −0.13 (0.15) | 0.88 | −0.19 (0.23) | 0.83 |
| Education some college or college degree | −0.09 (0.13) | 0.91 | −0.03 (0.21) | 0.97 |
| Medication use (0=None) | −0.02 (0.11) | 0.98 | 0.33* (0.17) | 1.39 |
| Any cigarette smoking (0=None) | 0.51** (0.19) | 1.67 | 0.66* (0.28) | 1.94 |
| Average number of cigarettes smoked per day (centered at 20) | 0.01 (0.01) | 1.01 | 0.01 (0.02) | 1.01 |
| Adult stressful life experiences (z-score) | −0.04 (0.06) | 0.96 | −0.02 (0.09) | 0.98 |
| Self-reported global health | −0.05 (0.03) | 0.95 | −0.12* (0.05) | 0.89 |
Note: eB = odds ratio (exponentiated B). Class 1 “Normative” is the reference category. N=2,737 for days not missing values on any covariate.
p ≤ .05.
p ≤ .01.
p ≤ .001.
4. Discussion
Drawing on an age-heterogeneous national sample of U.S. adults, we used a relatively novel analytic approach to identify typical diurnal profiles of salivary cortisol across nearly 3,000 days, provided by over 1,000 participants. The 3-class solution provided the best fit to these data and suggested that on the majority of days, U.S. adults exhibit a Normative pattern – what appears to be a classic diurnal cortisol pattern previously described in the literature, characterized by a robust CAR, followed by a gradual decline throughout the rest of the day. The two less commonly-observed profiles – a curve that was Elevated and a curve that was Flattened in relation to the Normative curve – may indicate hyperactivated and hypoactivated HPA-axis regulation. Our results support previous work showing that older adulthood is associated with a deviation from the expected diurnal cortisol rhythm, and that the Flattened profile is linked with poorer health. The following sections show how the three profiles correspond to the rich theoretical literature that has proposed more than one manifestation of the dysregulated circadian cortisol rhythm, link our findings to previous empirical work, evaluate limitations, review strengths, and suggest directions for future research.
4.1. Discrete classes in cortisol’s circadian rhythm
A large body of published work has examined predictors of diurnal cortisol when dysregulated or unhealthy profiles are operationalized as excessively high or low discreet or overall levels (e.g., Yehuda et al., 2005), or as excessively fast or slow rate of change in level across the day (e.g., Bower et al., 2005). A noted limitation in the cortisol literature is the lack of clinical cut-offs for what are deemed to be “healthy” versus “dysregulated” levels and rates of change in naturally-occurring cortisol across the day. Using Growth Mixture Modeling, the current study begins to address this topic by simultaneously modeling diurnal cortisol’s latent classes as well as growth curve parameters, thereby illustrating the characteristics and relative proportions of diurnal cortisol profiles in a national sample of adults.
4.1.1. The normative profile
The Normative curve was observed most commonly, and may represent the nonlinear and dynamic cortisol pattern previously found among healthy adults, which is characterized by a marked CAR, followed by a negative diurnal cortisol slope. In the current study, we found that on an average Normative day, cortisol at waking begins with at 13.4 nmol/L and rises over 50% to 20.4 nmol/L at 30 minutes post-waking. Following the CAR, the Normative profile’s cortisol level declines to 6.0 nmol/L before lunch, and then drops to 1.5 nmol/L immediately prior to bedtime. There have been a number of proposals on the possible significance of such a robust CAR in light of awakening in the morning. It may mobilize the body’s energy reserves (Pruessner et al., 1997a), switch the immune system to daytime activity (Hucklebridge et al., 1999), and aid individuals in the anticipation of events of the upcoming day and the “orientation about the self in time and space” (Fries et al., 2009). A relatively negative decline in the cortisol slope has been hypothesized to represent an ability to disengage from stressful events at the end of the day, as well as an intact HPA-axis negative feedback loop (Heim et al., 2000; Miller et al., 2007).
4.1.2. The elevated profile
One-fifth of days (i.e., 20%) in the current study were characterized by a profile that was Elevated in relation to the Normative curve, with a waking level that is nearly 50% higher than that of the Normative curve, followed by subsequently high levels that never dropped to those of the Normative profile. At the expense of membership in the Normative cortisol profile, smoking cigarettes and older age increased the likelihood of exhibiting a day with an Elevated profile.
We speculate that an Elevated profile may be an empirical manifestation of what Sapolsky and colleagues described as the glucocorticoid hypersecretion syndrome (1986), which has been shown to predispose mice to various aging-related pathologies, such as an increased incidence of cognitive impairment, and tumor establishment and growth. It may further represent a type of allostatic load (Sterling and Eyer, 1988), a heuristic for understanding the mechanism of stressor accumulation and the consequent physiological wear-and-tear. A heightened overall neuroendocrine activation is adaptive in light of intermittent stressor exposure, but, under protracted conditions, generates physiological wear-and-tear that leads to disease (McEwen and Seeman, 2006). McEwen and Seeman (2006) proposed that there are four types of allostatic load, where one subtype is a state marked by repeatedly elevating or chronically high levels of stress-related biomarkers, due to repeated stressor exposure. Indeed, a relatively recent, but already seminal meta-analysis (Miller et al., 2007) showed that higher morning, followed by higher afternoon or evening cortisol levels are a consequence of a relatively recent acute stressor exposure.
4.1.3. The Flattened profile
The smallest proportion of days (i.e., 7%) exhibited a cortisol profile that was Flattened in relation to the Normative profile. Relative to the Normative, the Flattened curve was not different in waking level, but was characterized by a dampened CAR, and a near absence of the diurnal slope decline, resulting in a high bedtime value. The Flattened profile likelihood increased among participants who were cigarette smokers, male, older, used medications previously shown to alter cortisol levels, and reported poorer health.
We speculate that the Flattened profile may be an index of a hypoactive HPA-activation, which has been linked with higher chronic fatigue symptoms (Bower et al., 2005), poorer metabolic health (Ranjit et al., 2005; Lasikiewicz et al., 2008), and a greater likelihood of PTSD diagnosis among Holocaust survivors (Yehuda et al., 2005). This circadian pattern may be a presentation of an allostatic load subtype that is chiefly characterized by a failure to exhibit an expected trough in a biomarker’s circadian cycle, or recovery following a stressor (McEwen and Seeman, 2006). The biological mechanisms driving these stress-induced HPA-axis “over-adjustments” are a reduction in the number and activity of glucocorticoid receptors, a reduction in biosynthesis of cortisol, and/or an increased sensitivity to glucocorticoids (Fries et al., 2005). As a result, basal diurnal cortisol levels may appear flattened, with a failure to activate the HPA-axis in the morning, and/or a failure to deactivate it in the evening, resulting in a relatively flat diurnal slope (Heim et al., 2000; Fries et al., 2005). Indeed, morning cortisol decreases whereas afternoon and evening levels increase when a stressor is no longer present (Miller et al., 2007).
4.1.4. Cortisol profile variability
Decomposition of variance in cortisol levels at each occasion illustrated that between-person characteristics accounted for one-third to one-half of variability in cortisol level. These results are comparable to those of other studies measuring salivary cortisol in the field (e.g., Edwards et al., 2001; Ranjit et al., 2009).
To the best of our knowledge, this is the first work to examine daily variability in cortisol profile membership; thus, a comparison to other samples is not feasible at this time. The decomposition of variance in cortisol profile membership provided evidence for a modest proportion of class membership variance due to individual differences (i.e., 16 – 29% of the variability), showing that the majority of class membership variance is due to day-level factors (i.e., 71 – 84% of the variability in class membership). Analysis of individual differences showed that men were more likely to show inconsistency in cortisol profiles across the four study days, although we must acknowledge that these results are more exploratory in nature, as they are based on a relatively small subsample of participants providing valid cortisol values on all 4 study days.
4.2. Limitations, strengths, and future directions
A major strength of the current study is the opportunity to examine our research questions in a sufficiently large sample of adults providing up to four days of salivary cortisol samples. As evident from the 1-class solution, mean cortisol values across the four sampling occasions were in line with previously-reported levels from studies employing lab-based salivary cortisol collection (Pruessner et al., 1997a; Smyth et al., 1997; Wust et al., 2000; Edwards et al., 2001). We assessed latent heterogeneity in cortisol profiles using a type of mixture modeling, a relatively novel procedure in cortisol literature (cf. Lasikiewicz et al., 2008; Van Ryzin et al., 2009; Kumari et al., 2010). Latent basis GMM allowed us to model any potential non-linearity in the latent growth curves. Moreover, we investigated potential links between the probability of profile membership and a selected set of demographic, health, and stress-related variables. Given these limits to study scope, a number of generative directions for future research remain.
It is important to point out the relative homogeneity of the participant sample, which consisted of participants who were generally Caucasian and attained relatively high education levels. Future research should explore cortisol profiles and examine predictors of cortisol profile membership within a sample diverse in ethnic and socioeconomic status compositions. As was the case with results of some of the other studies (e.g., Dowd and Goldman, 2006), there was no significant association between socioeconomic status and diurnal cortisol. Future studies should provide a more comprehensive examination of how disparities in socioeconomic status are linked to diurnal cortisol profiles, perhaps using other operationalizations of socioeconomic status in addition to highest years of education attained. For example, a number of studies have illustrated that early-life economic adversity may be more salient to diurnal cortisol dysregulation than current socioeconomic status (e.g., Miller et al., 2009).
The focus of the current study was on examining common cortisol profiles independent of several known confounders and correlates (Adam and Kumari, 2009; Schlotz, 2011; Kudielka et al., 2012); thus, we imposed strict cut-off criteria for saliva collection protocol adherence during selection of days for the analytic sample. It was important to ensure that the identified profiles were not reflections of different degrees of adherence to the saliva collection protocol, clinical subpopulations where individuals exhibit exceptionally high cortisol levels, or subgroups of participants who follow a non-standard sleep schedule. Indeed, participants included in the analytic sample differed from those who were excluded, or from those who had a lower probability of providing a valid cortisol day. Specifically, participants who did not provide any valid cortisol days were more likely to have attained at most a high school education or equivalent. Among participants contributing at least one cortisol day, minority status, higher adult stressful experiences, and poorer self-reported health were associated with a lower probability of providing a valid cortisol day. To improve adherence to cortisol collection protocol, we have recently begun providing our participants with videotaped instructions for how to collect, store, and return their saliva samples. This DVD, which is included in the saliva collection kit that is sent to all participants, is available from David M. Almeida upon request.
Given the available data, medication use and minority status were dichotomized, creating rather crude operationalization of these covariates, and future work should examine medication use and race/ethnicity in relation to cortisol profiles more closely. Recent studies have shown the importance of ensuring precise timing of cortisol collection (Hall et al., 2011; Smyth et al., in press). We did our best to reduce the impact of noise due to non-adherence to the cortisol collection protocol, the current study lacked objectively verified assessments of cortisol collection timing, both at the data collection and analytic stage, this factor will be important to explore in future studies examining diurnal cortisol profiles.
The current findings indicate that relative to the Normative profile, the Flattened profile is more relevant than the Elevated profile for poorer health outcomes, at least when health is operationalized by a self-reported global health scale. Future work should carry out a more fine-grained analysis investigating how different aspects of physical health are associated with deviation from the normative diurnal cortisol curve. Previous research shows strong links between stress-eliciting environments and psychological well-being (e.g., Slavich et al., 2009), and between flatter diurnal cortisol slope and symptoms (Knight et al., 2010) and diagnosis (Jarcho et al., 2013) of depression. Thus, a careful examination of potential links between psychological well-being and diurnal cortisol profiles is another important direction for future studies to pursue. The current work also links cigarette use to a deviation from the normative cortisol profile, suggesting that one possible direction for future research lies in examining whether cigarette smoking prevention and intervention efforts may aid healthy diurnal cortisol regulation. Moreover, future work should examine the effect of other health behaviors on diurnal cortisol patterns.
Although the current data did not allow us to examine this question, future work should investigate the link between stressor reactivity and diurnal cortisol profile membership and variability. The lack of a significant association between stressful life events and cortisol profile membership may seem surprising at first glance, but is consistent with previous literature showing weak or non-significant associations between diurnal cortisol and life events (e.g., Ice et al., 2004). The critically-important stress-to-cortisol mechanism should be more closely examined by investigating how diurnal cortisol profiles are differentially linked to stressors of various forms, types, and temporal dimensions (Miller et al., 2007). The temporal dimension may be particularly important here, given the high proportion of day-to-day variance in cortisol profiles in this sample. Future work should consider the differing impact of stressor forms (e.g., chronic stress), and types (e.g., arguments), as well as the effects of stressors that fluctuate across hours and days, and those that change as the seasons of one’s life turn.
Acknowledgments
We are grateful to Professor Gerda G. Fillenbaum, who reviewed and provided editorial suggestions on earlier drafts of this manuscript.
This work was supported by National Institute on Aging Grants awarded to David M. Almeida (P01 AG020166 and R01 AG019239). The original MIDUS study was supported by the John D. and Catherine T. MacArthur Foundation Research Network on Successful Midlife Development. Partial support for this research was provided by National Institute on Aging grants 5T32 AG00029-35 (NOD; PI: Harvey J. Cohen), 5P30 AG028716-07 (CFP; PI: Harvey J. Cohen), and 5P30 AG028377-05 (CFP; PI: Kathleen A. Welsh-Bohmer). The funding sources had no additional role in study design; in the collection, analysis and interpretation of data; in the writing of the report; and in the decision to submit the article for publication.
Footnotes
Publisher's Disclaimer: This is a PDF file of an unedited manuscript that has been accepted for publication. As a service to our customers we are providing this early version of the manuscript. The manuscript will undergo copyediting, typesetting, and review of the resulting proof before it is published in its final citable form. Please note that during the production process errors may be discovered which could affect the content, and all legal disclaimers that apply to the journal pertain.
Additional analyses (not shown) yielded comparable results (e.g., the 3-class solution provided the best fit, comparable parameter estimates and class proportions) when analyses were carried out separately for each interview day.
Results did not change significantly when interview day was included as a covariate.
Contributions:
Author 1 generated research questions, conducted the literature search, carried out data analysis and interpretation, and drafted the manuscript.
Author 2 designed and supervised the NSDE II protocol, data collection and data management; critically informed the research questions and interpretation of results; reviewed the article and suggested revisions for important intellectual content.
Author 3 helped to inform the research questions and plan of analysis; reviewed the article and suggested revisions for important intellectual content.
Author 4 critically reviewed the article and suggested revisions for important intellectual content.
Author 5 critically reviewed the article and suggested revisions for important intellectual content.
All authors contributed to and have approved the final manuscript.
All authors declare that they have no conflict of interest.
References
- Adam EK, Hawkley LC, Kudielka BM, Cacioppo JT. Day-to-day dynamics of experience–cortisol associations in a population-based sample of older adults. Proceedings of the National Academy of Sciences. 2006;103:17058–17063. doi: 10.1073/pnas.0605053103. [DOI] [PMC free article] [PubMed] [Google Scholar]
- Adam EK, Kumari M. Assessing salivary cortisol in large-scale, epidemiological research. Psychoneuroendocrinology. 2009;34:1423–1436. doi: 10.1016/j.psyneuen.2009.06.011. [DOI] [PubMed] [Google Scholar]
- Almeida DM, McGonagle K, King H. Assessing daily stress processes in social surveys by combining stressor exposure and salivary cortisol. Biodemography and Social Biology. 2009a;55:219–237. doi: 10.1080/19485560903382338. [DOI] [PMC free article] [PubMed] [Google Scholar]
- Almeida DM, Piazza JR, Stawski RS. Interindividual differences and intraindividual variability in the cortisol awakening response: an examination of age and gender. Psychol Aging. 2009b;24:819–827. doi: 10.1037/a0017910. [DOI] [PMC free article] [PubMed] [Google Scholar]
- Almeida DM, Wethington E, Kessler RC. The daily inventory of stressful events – an interview-based approach for measuring daily stressors. Assessment. 2002;9:41–55. doi: 10.1177/1073191102091006. [DOI] [PubMed] [Google Scholar]
- Bartels M, Van den Berg M, Sluyter F, Boomsma DI, de Geus EJC. Heritability of cortisol levels: review and simultaneous analysis of twin studies. Psychoneuroendocrinology. 2003;28:121–137. doi: 10.1016/s0306-4530(02)00003-3. [DOI] [PubMed] [Google Scholar]
- Birditt KS, Cichy KE, Almeida D. Age differences in exposure and reactivity to interpersonal tensions among black and white individuals across adulthood. Race and Social Problems. 2011;3:225–239. doi: 10.1007/s12552-011-9058-y. [DOI] [PMC free article] [PubMed] [Google Scholar]
- Bower JE, Ganz PA, Dickerson SS, Petersen L, Aziz N, Fahey JL. Diurnal cortisol rhythm and fatigue in breast cancer survivors. Psychoneuroendocrinology. 2005;30:92–100. doi: 10.1016/j.psyneuen.2004.06.003. [DOI] [PubMed] [Google Scholar]
- Chrousos GP, Gold PW. The concepts of stress and stress system disorders – overview of physical and behavioral homeostasis. Jama-Journal of the American Medical Association. 1992;267:1244–1252. [PubMed] [Google Scholar]
- Clements DA, Parker RC. The relationship between salivary cortisol concentrations in frozen versus mailed samples. Psychoneuroendocrinology. 1998;23:613–616. doi: 10.1016/s0306-4530(98)00031-6. [DOI] [PubMed] [Google Scholar]
- Clow A, Hucklebridge F, Stalder T, Evans P, Thorn L. The cortisol awakening response: More than a measure of HPA axis function. Neurosci Biobehav Rev. 2010a;35:97–103. doi: 10.1016/j.neubiorev.2009.12.011. [DOI] [PubMed] [Google Scholar]
- Clow A, Hucklebridge F, Thorn L. The cortisol awakening response in context. Int Rev Neurobiol. 2010b;93:153–175. doi: 10.1016/S0074-7742(10)93007-9. [DOI] [PubMed] [Google Scholar]
- Deuschle M, Gotthardt U, Schweiger U, Weber B, Korner A, Schmider J, Standhardt H, Lammers CH, Heuser I. With aging in humans the activity of the hypothalamus-pituitary-adrenal system increases and its diurnal amplitude flattens. Life Sci. 1997;61:2239–2246. doi: 10.1016/s0024-3205(97)00926-0. [DOI] [PubMed] [Google Scholar]
- Dickerson SS, Kemeny ME. Acute stressors and cortisol responses: a theoretical integration and synthesis of laboratory research. Psychol Bull. 2004;130:355–391. doi: 10.1037/0033-2909.130.3.355. [DOI] [PubMed] [Google Scholar]
- Dowd JB, Goldman N. Do biomarkers of stress mediate the relation between socioeconomic status and health? J Epidemiol Community Health. 2006;60:633–639. doi: 10.1136/jech.2005.040816. [DOI] [PMC free article] [PubMed] [Google Scholar]
- Edwards S, Clow A, Evans P, Hucklebridge F. Exploration of the awakening cortisol response in relation to diurnal cortisol secretory activity. Life Sci. 2001;68:2093–2103. doi: 10.1016/s0024-3205(01)00996-1. [DOI] [PubMed] [Google Scholar]
- Epel ES. Psychological and metabolic stress: a recipe for accelerated cellular aging? Hormones-International Journal of Endocrinology and Metabolism. 2009;8:7–22. doi: 10.14310/horm.2002.1217. [DOI] [PubMed] [Google Scholar]
- Federenko I, Wust S, Hellhammer DH, Dechoux R, Kumsta R, Kirschbaum C. Free cortisol awakening responses are influenced by awakening time. Psychoneuroendocrinology. 2004;29:174–184. doi: 10.1016/s0306-4530(03)00021-0. [DOI] [PubMed] [Google Scholar]
- Fries E, Dettenborn L, Kirschbaum C. The cortisol awakening response (CAR): facts and future directions. Int J Psychophysiol. 2009;72:67–73. doi: 10.1016/j.ijpsycho.2008.03.014. [DOI] [PubMed] [Google Scholar]
- Fries E, Hesse J, Hellhammer J, Hellhammer DH. A new view on hypocortisolism. Psychoneuroendocrinology. 2005;30:1010–1016. doi: 10.1016/j.psyneuen.2005.04.006. [DOI] [PubMed] [Google Scholar]
- Granger DA, Hibel LC, Fortunato CK, Kapelewski CH. Medication effects on salivary cortisol: tactics and strategy to minimize impact in behavioral and developmental science. Psychoneuroendocrinology. 2009;34:1437–1448. doi: 10.1016/j.psyneuen.2009.06.017. [DOI] [PubMed] [Google Scholar]
- Hall DL, Blyler D, Allen D, Mishel MH, Crandell J, Germino BB, Porter LS. Predictors and patterns of participant adherence to a cortisol collection protocol. Psychoneuroendocrinology. 2011;36:540–546. doi: 10.1016/j.psyneuen.2010.08.008. [DOI] [PMC free article] [PubMed] [Google Scholar]
- Hand DJ, Yu K. Idiot’s Bayes—not so stupid after all? International Statistical Review. 2001;69:385–398. [Google Scholar]
- Heim C, Ehlert U, Hellhammer DH. The potential role of hypocortisolism in the pathophysiology of stress-related bodily disorders. Psychoneuroendocrinology. 2000;25:1–35. doi: 10.1016/s0306-4530(99)00035-9. [DOI] [PubMed] [Google Scholar]
- Hruschka DJ, Kohrt BA, Worthman CM. Estimating between-and within-individual variation in cortisol levels using multilevel models. Psychoneuroendocrinology. 2005;30:698–714. doi: 10.1016/j.psyneuen.2005.03.002. [DOI] [PubMed] [Google Scholar]
- Hucklebridge FH, Clow A, Abeyguneratne T, Huezo-Diaz P, Evans P. The awakening cortisol response and blood glucose levels. Life Sci. 1999;64:931–937. doi: 10.1016/s0024-3205(99)00019-3. [DOI] [PubMed] [Google Scholar]
- Ice G, Katz-Stein A, Himes J, Kane R. Diurnal cycles of salivary cortisol in older adults. Psychoneuroendocrinology. 2004;29:355–370. doi: 10.1016/s0306-4530(03)00034-9. [DOI] [PubMed] [Google Scholar]
- Jarcho MR, Slavich GM, Tylova-Stein H, Wolkowitz OM, Burke HM. Dysregulated diurnal cortisol pattern is associated with glucocorticoid resistance in women with major depressive disorder. Biol Psychol. 2013 doi: 10.1016/j.biopsycho.2013.01.018. [DOI] [PMC free article] [PubMed] [Google Scholar]
- Jung T, Wickrama KAS. An introduction to latent class growth analysis and growth mixture modeling. Social and Personality Psychology Compass. 2008;2:302–317. [Google Scholar]
- Knight JM, Avery EF, Janssen I, Powell LH. Cortisol and depressive symptoms in a population-based cohort of midlife women. Psychosom Med. 2010;72:855–861. doi: 10.1097/PSY.0b013e3181f4ab87. [DOI] [PMC free article] [PubMed] [Google Scholar]
- Koss KJ, George MRW, Davies PT, Cicchetti D, Cummings EM, Sturge-Apple ML. Patterns of Children’s Adrenocortical Reactivity to Interparental Conflict and Associations With Child Adjustment: A Growth Mixture Modeling Approach. 2012 doi: 10.1037/a0028246. [DOI] [PMC free article] [PubMed] [Google Scholar]
- Kudielka BM, Broderick JE, Kirschbaum C. Compliance with saliva sampling protocols: electronic monitoring reveals invalid cortisol daytime profiles in noncompliant subjects. Psychosom Med. 2003;65:313–319. doi: 10.1097/01.psy.0000058374.50240.bf. [DOI] [PubMed] [Google Scholar]
- Kudielka BM, Gierens A, Hellhammer DH, Wüst S, Schlotz W. Salivary cortisol in ambulatory assessment—some dos, some don’ts, and some open questions. Psychosom Med. 2012;74:418–431. doi: 10.1097/PSY.0b013e31825434c7. [DOI] [PubMed] [Google Scholar]
- Kumari M, Badrick E, Sacker A, Kirschbaum C, Marmot M, Chandola T. Identifying patterns in cortisol secretion in an older population. Findings from the Whitehall II study. Psychoneuroendocrinology. 2010;35:1091–1099. doi: 10.1016/j.psyneuen.2010.01.010. [DOI] [PubMed] [Google Scholar]
- Lasikiewicz N, Hendrickx H, Talbot D, Dye L. Exploration of basal diurnal salivary cortisol profiles in middle-aged adults: associations with sleep quality and metabolic parameters. Psychoneuroendocrinology. 2008;33:143–151. doi: 10.1016/j.psyneuen.2007.10.013. [DOI] [PubMed] [Google Scholar]
- Lo YT, Mendell NR, Rubin DB. Testing the number of components in a normal mixture. Biometrika. 2001;88:767–778. [Google Scholar]
- McEwen BS, Seeman T. Protective and damaging effects of mediators of stress: elaborating and testing the concepts of allostasis and allostatic load. Ann N Y Acad Sci. 2006;896:30–47. doi: 10.1111/j.1749-6632.1999.tb08103.x. [DOI] [PubMed] [Google Scholar]
- Merlo J, Chaix B, Ohlsson H, Beckman A, Johnell K, Hjerpe P, Råstam L, Larsen K. A brief conceptual tutorial of multilevel analysis in social epidemiology: using measures of clustering in multilevel logistic regression to investigate contextual phenomena. J Epidemiol Community Health. 2006;60:290–297. doi: 10.1136/jech.2004.029454. [DOI] [PMC free article] [PubMed] [Google Scholar]
- Miller GE, Chen E, Fok AK, Walker H, Lim A, Nicholls EF, Cole S, Kobor MS. Low early-life social class leaves a biological residue manifested by decreased glucocorticoid and increased proinflammatory signaling. Proc Natl Acad Sci USA. 2009;106:14716–14721. doi: 10.1073/pnas.0902971106. [DOI] [PMC free article] [PubMed] [Google Scholar]
- Miller GE, Chen E, Zhou ES. If it goes up, must it come down? Chronic stress and the hypothalamic-pituitary-adrenocortical axis in humans. Psychol Bull. 2007;133:25–45. doi: 10.1037/0033-2909.133.1.25. [DOI] [PubMed] [Google Scholar]
- Muthén B, Muthén LK. Integrating person-centered and variable-centered analyses: growth mixture modeling with latent trajectory classes. Alcoholism-Clinical and Experimental Research. 2000;24:882–891. [PubMed] [Google Scholar]
- Muthén B, Shedden K. Finite mixture modeling with mixture outcomes using the EM algorithm. Biometrics. 1999;55:463–469. doi: 10.1111/j.0006-341x.1999.00463.x. [DOI] [PubMed] [Google Scholar]
- Muthén LK, Muthén B. Mplus User’s Guide. 6. Muthén & Muthén; Los Angeles, CA: 1998–2010. [Google Scholar]
- Nagin DS. Analyzing developmental trajectories: a semiparametric, group-based approach. Psychological Methods. 1999;4:139–157. doi: 10.1037/1082-989x.6.1.18. [DOI] [PubMed] [Google Scholar]
- Nylund KL, Asparouhov T, Muthén BO. Deciding on the number of classes in latent class analysis and growth mixture modeling: a monte carlo simulation study. Structural Equation Modeling. 2007;14:535–569. [Google Scholar]
- Pruessner J, Wolf O, Hellhammer D, Buske-Kirschbaum A, Von Auer K, Jobst S, Kaspers F, Kirschbaum C. Free cortisol levels after awakening: a reliable biological marker for the assessment of adrenocortical activity. Life Sci. 1997a;61:2539–2549. doi: 10.1016/s0024-3205(97)01008-4. [DOI] [PubMed] [Google Scholar]
- Pruessner JC, Gaab J, Hellhammer DH, Lintz D, Schommer N, Kirschbaum C. Increasing correlations between personality traits and cortisol stress responses obtained by data aggregation. Psychoneuroendocrino. 1997b;22:615–625. doi: 10.1016/s0306-4530(97)00072-3. [DOI] [PubMed] [Google Scholar]
- Ram N, Grimm KJ. Growth mixture modeling: A method for identifying differences in longitudinal change among unobserved groups. International Journal of Behavioral Development. 2009;33:565–576. doi: 10.1177/0165025409343765. [DOI] [PMC free article] [PubMed] [Google Scholar]
- Ranjit N, Diez-Roux AV, Sanchez B, Seeman T, Shea S, Shrager S, Watson K. Association of salivary cortisol circadian pattern with cynical hostility: multi-ethnic study of atherosclerosis. Psychosom Med. 2009;71:748–755. doi: 10.1097/PSY.0b013e3181ad23e7. [DOI] [PMC free article] [PubMed] [Google Scholar]
- Ranjit N, Young EA, Raghunathan TE, Kaplan GA. Modeling cortisol rhythms in a population-based study. Psychoneuroendocrinology. 2005;30:615–624. doi: 10.1016/j.psyneuen.2005.02.003. [DOI] [PubMed] [Google Scholar]
- Sapolsky RM, Krey LC, Mcewen BS. The neuroendocrinology of stress and aging -the glucocorticoid cascade hypothesis. Endocr Rev. 1986;7:284–301. doi: 10.1210/edrv-7-3-284. [DOI] [PubMed] [Google Scholar]
- Schlotz W. Ambulatory psychoneuroendocrinology: assessing salivary cortisol and other hormones in daily life. In: MR M, TS C, editors. Handbook of Research Methods for Studying Daily Life. Guilford Press; New York, NY: 2011. pp. 193–209. [Google Scholar]
- Slavich GM, Thornton T, Torres LD, Monroe SM, Gotlib IH. Targeted rejection predicts hastened onset of major depression. Journal of social and clinical psychology. 2009;28:223. doi: 10.1521/jscp.2009.28.2.223. [DOI] [PMC free article] [PubMed] [Google Scholar]
- Slopen N, Dutra LM, Williams DR, Mujahid MS, Lewis TT, Bennett GG, Ryff CD, Albert MA. Psychosocial stressors and cigarette smoking among African American adults in midlife. Nicotine & Tobacco Research. 2012;14:1161–1169. doi: 10.1093/ntr/nts011. [DOI] [PMC free article] [PubMed] [Google Scholar]
- Slopen N, Lewis TT, Gruenewald TL, Mujahid MS, Ryff CD, Albert MA, Williams DR. Early life adversity and inflammation in African Americans and whites in the midlife in the United States survey. Psychosom Med. 2010;72:694–701. doi: 10.1097/PSY.0b013e3181e9c16f. [DOI] [PMC free article] [PubMed] [Google Scholar]
- Smyth JM, Ockenfels MC, Gorin AA, Catley D, Porter LS, Kirschbaum C, Hellhammer DH, Stone AA. Individual differences in the diurnal cycle of cortisol. Psychoneuroendocrinology. 1997;22:89–105. doi: 10.1016/s0306-4530(96)00039-x. [DOI] [PubMed] [Google Scholar]
- Smyth N, Clow A, Thorn L, Hucklebridge F, Evans P. Delays of 5–15 min between awakening and the start of saliva sampling matter in assessment of the cortisol awakening response. Psychoneuroendocrinology. doi: 10.1016/j.psyneuen.2012.12.013. in press. [DOI] [PubMed] [Google Scholar]
- Stawski RS, Almeida DM, Lachman ME, Tun PA, Rosnick CB, Seeman T. Associations between cognitive function and naturally occurring daily cortisol during middle adulthood: timing is everything. The Journals of Gerontology Series B: Psychological Sciences and Social Sciences. 2011;66:i71–i81. doi: 10.1093/geronb/gbq094. [DOI] [PMC free article] [PubMed] [Google Scholar]
- Steptoe A, Ussher M. Smoking, cortisol and nicotine. Int J Psychophysiol. 2006;59:228–235. doi: 10.1016/j.ijpsycho.2005.10.011. [DOI] [PubMed] [Google Scholar]
- Sterling P, Eyer J. Allostasis: a new paradigm to explain arousal pathology 1988 [Google Scholar]
- Taylor SE, Karlamangla AS, Friedman EM, Seeman TE. Early environment affects neuroendocrine regulation in adulthood. Social cognitive and affective neuroscience. 2011;6:244–251. doi: 10.1093/scan/nsq037. [DOI] [PMC free article] [PubMed] [Google Scholar]
- Van Cauter E, Buxton OM. Circadian Clocks. Springer; 2001. Circadian modulation of endocrine secretion; pp. 685–714. [Google Scholar]
- Van Cauter E, Leproult R, Kupfer DJ. Effects of gender and age on the levels and circadian rhythmicity of plasma cortisol. J Clin Endocrinol Metab. 1996;81:2468–2473. doi: 10.1210/jcem.81.7.8675562. [DOI] [PubMed] [Google Scholar]
- Van Ryzin MJ, Chatham M, Kryzer E, Kertes DA, Gunnar MR. Identifying atypical cortisol patterns in young children: the benefits of group-based trajectory modeling. Psychoneuroendocrinology. 2009;34:50–61. doi: 10.1016/j.psyneuen.2008.08.014. [DOI] [PMC free article] [PubMed] [Google Scholar]
- Vermunt JK. Latent class modeling with covariates: two improved three-step approaches. Political Analysis. 2010;18:450–469. [Google Scholar]
- Wust S, Wolf J, Hellhammer DH, Federenko I, Schommer N, Kirschbaum C. The cortisol awakening response-normal values and confounds. Noise and health. 2000;2:79–88. [PubMed] [Google Scholar]
- Yehuda R, Golier JA, Kaufman S. Circadian rhythm of salivary cortisol in Holocaust survivors with and without PTSD. A J Psychiatry. 2005;162:998–1000. doi: 10.1176/appi.ajp.162.5.998. [DOI] [PubMed] [Google Scholar]