

Abstract
Objectives
To assess sustainability of programmatic outcomes in a community-based antiretroviral therapy (ART) service in South Africa during 7 years scale-up.
Methods
Prospective cohort of treatment-naïve patients aged ≥15 years enrolled between 2002 and 2008. Data were analyzed by calendar period of ART initiation using time to-event analysis and logistic regression.
Results
ART was initiated by 3162 patients (67% female, median age 34 years) who were followed-up for a median of 2.4 years (IQR,1.2-3.8). After 6 years, the cumulative probability of death and loss to follow-up (LTFU) was 37.4%. The probabilities of transfer-out to another ART service and of virological failure were 21.6% and 23.1%, respectively. Low mortality risk and excellent virological and immunological responses during the first year of ART were not associated with calendar period of ART initiation. In contrast, risk of LTFU and virological failure both increased between successive calendar periods in unadjusted and adjusted analyses. The number of patients per member of clinic staff increased markedly over time.
Conclusions
Successful early outcomes (low mortality and good immunological and virological responses) were sustained between sequential calendar periods during 7 years of scale-up. In contrast, the increasing cumulative probabilities of LTFU or virological failure may reflect decreasing capacity to adequately support patients long-term as clinic case-load escalated.
Keywords: Antiretroviral, outcomes, mortality, loss to follow-up, virological failure, Africa
Introduction
Antiretroviral therapy (ART) has become much more widely available in resource-limited countries with a high burden of HIV/AIDS. Four million people were estimated to be receiving ART in low- or middle- income countries by the end of 2008, of whom 2.9 million were in sub-Saharan Africa and 701,000 were in South Africa alone.1 Success in scale-up may be tempered, however, by the challenges associated with rapidly increasing case-loads of patients attending individual clinics. This may potentially undermine the ability to sustain programme quality.
Reports of early experiences from ART programmes in sub-Saharan Africa were generally favourable, with good immunological, virological and clinical responses being achieved.2 However, it subsequently emerged that mortality rates within the initial months of ART are disproportionately higher in African programmes compared to rates in other regions.3, 4 Moreover, meta-analyses of programmes that included self-paying patients subsequently highlighted high rates of programme attrition after 2 years of follow-up due to a combination of mortality and losses to follow-up.5 Few studies of large cohorts in sub-Saharan Africa have reported on long-term outcomes6-8 and how these outcomes have changed over time as overall cohort size has increased.6 In this study, we reported on outcomes of patients receiving treatment between 2002 and 2009 in a community-based ART cohort in Cape Town, South Africa. We report on trends in these outcomes stratified by cohort year of enrolment, thereby providing an important assessment of temporal trends in early and long-term outcomes in this cohort.
Methods
Treatment cohort
This is a well characterized ART service in a poor peri-urban area in Cape Town, South Africa.9-12 Provision of ART at this service commenced in September 2002 and by September 2009, care was provided for over 3000 patients. The national programme criteria for starting ART were a prior AIDS diagnosis (WHO stage 4 disease) or a blood CD4 cell count <200 cells/μl. The first-line ART regimen was comprised of two nucleoside reverse transcriptase inhibitors (NRTI) and a non-nucleoside reverse transcriptase inhibitor (NNRTI). This was provided to patients free of charge. Patients had routine clinical assessment every 2 weeks prior to ART and after 8 and 16 weeks of treatment and 16-weekly thereafter. CD4 cell count and viral load were monitored prior to ART and every 16 weeks during ART.
Provision of patient care was supported by peer counsellors, most of whom are themselves living with HIV and receiving ART.13 Each new patient enrolling into the clinic was allocated to a peer counsellor living in the same area. Through group sessions and individual home visits, patients were educated, provided with counselling support, and the need for high levels of treatment adherence were reinforced. From 2006 onwards the number of counsellors remained constant at around 30 despite ongoing increases in patient caseload.
Study design
Data were obtained from a prospectively maintained ART cohort database of clinical variables, outcomes, treatment regimens and laboratory data derived from patient notes and laboratory records. ART-naïve patients aged ≥15 years who enrolled in this cohort between September 2002 and September 2008 were eligible for this analysis. Follow-up data were censored at September 2009. Staffing levels at this clinic were determined from human resources records. Data collection on this cohort was approved by the Research Ethics Committee of the University of Cape Town and all patients gave written informed consent to have data collected anonymously for research purposes.
Definitions of outcomes
Patients were defined as a ‘loss to follow up’ (LTFU) if they had failed to attend the clinic for ≥12 weeks and were not known to have died or to have been transferred out to another facility. The date of LTFU was recorded as the date of last visit to the clinic. ‘Deaths’ referred to all-cause mortality notified from any source. ‘Transfers-out’ referred to patients receiving ART whose care was transferred to another clinic, arising as a result of either increasing numbers of treatment centres in surrounding communities or due to patient home relocation. ‘Retention in care’ refers to patients alive and receiving ART. ‘Virological failure’ was defined as two consecutive viral load measurements >1000 copies/ml.
Statistical Analysis
Five calendar periods of enrolment were defined as September 2002 to September 2004, followed by four calendar periods of 12 months each up to September 2008. The first calendar period combined the first two years due to the small numbers of patients enrolled in those years and similarity in patient baseline profile, including CD4 counts and log10 viral loads.
The survival analyses had the following multiple end-points: death, loss-to-follow up, and virological failure. Each end-point was analysed separately. Kaplan-Meier estimates were used to describe time-to-event distributions. Log-rank tests were used to compare time-to-event after ART initiation across calendar period of enrolment. Cox proportional hazard models were used to determine the hazard of the event of interest at any time during the follow-up period, adjusting for relevant baseline covariates; calendar period of enrolment was included as a key variable of interest in this model. The proportional hazards assumption has been checked graphically using a log-log plot and the Schoenfeld residuals (tests and graphs).
For analyses involving week 16 viral loads and week 48 CD4 cell counts, data were categorized into binary variables. Bivariate analyses used chi-square tests to compare proportions. Logistic regression models were used to determine the risk of the outcome of interest, adjusting for relevant baseline covariates; calendar period of enrolment was included as a key variable of interest in this model. Log likelihood ratio tests were used to compare relative goodness of fit of nested models. Final models were checked using standard regression diagnostics for logistic regression.
Wald confidence limits were used for all multivariate models. All statistical tests were two-sided at alpha of 0.05. Stata statistical software, version 10.0 was used for analyses (College Station, Texas, USA).
Results
Baseline characteristics
Overall, 3162 treatment-naïve patients 15 years and older had initiated ART by September 2008 (Table 1), with annual enrolment reaching a maximum of 783 patients in the 12-month period 2005/6. Two-thirds of the cohort were women and most were young adults. Immunodeficiency was typically advanced, as reflected by WHO clinical stage of disease and CD4 cell counts (Table 1). Median baseline CD4 cell counts differed significantly between successive calendar periods of enrolment, increasing from 87 (IQR, 45-145) cells/μl in 2002/4 to 121 (IQR, 60-178) cells/μl in 2007/8. The most common first-line regimens was stavudine and lamivudine combined with either efavirenz or nevirapine (Table 1). Patients were followed up on ART for a minimum duration of one year, a median duration of 2.4 years (IQR, 1.2-3.8) and up to a maximum of 7.0 years. A total of 8061.1 person-years of follow-up accrued during the analysis period. The number of patients per member of clinic staff increased markedly over time, with the patient-to-peer counsellor ratio increasing by more than 4-fold during the analysis period and patient-to-doctor ratio approximately doubling (Table 1).
Table 1. Baseline characteristics of patients 15 years and older starting antiretroviral therapy at a community-based ART clinic in South Africa: 2002-2008.
| Year of starting ART | Total | 2002/4 | 2004/5 | 2005/6 | 2006/7 | 2007/8 | P-value |
|---|---|---|---|---|---|---|---|
| Patents starting, n (%) | 3162 | 404 (12.8) | 631 (20.0) | 783 (24.8) | 685 (21.7) | 659 (20.9) | - |
| Cumulative patients starting, n (%) | - | 404 (12.8) | 1035 (32.7) | 1818 (57.5) | 2503 (79.2) | 3162 (100.0) | - |
| Age(yrs) median (IQR) | 34 (29-39) | 33 (29-38) | 34 (29-39) | 33 (29-39) | 34 (28-40) | 35 (29-40) | 0.0537 |
| Gender | |||||||
| Female, n (%) | 2116 (66.9) | 305 (75.5) | 433 (68.6) | 510 (65.1) | 434 (63.4) | 434 (65.9) | 0.001 |
| CD4† (cells/μl) median (IQR) | 104 (51-162) | 87 (45-145) | 101 (48-155) | 102 (50-60.5) | 107 (53-160) | 121 (60-178) | 0.0001 |
| CD4† cell count category (cells/μl), n (%) | |||||||
| ≤50 | 759 (24.0) | 114 (28.2) | 163 (25.8) | 189 (24.1) | 166 (24.2) | 127 (19.3) | <0.001 |
| 51-100 | 715 (22.6) | 105 (26.0) | 148 (23.5) | 174 (22.2) | 143 (20.9) | 145 (22.0) | |
| 101-150 | 675 (21.4) | 84 (20.8) | 142 (22.5) | 162 (20.7) | 161 (23.5) | 126 (19.1) | |
| 151-200 | 571 (18.1) | 53 (13.1) | 118 (18.7) | 123 (15.7) | 127 (18.5) | 150 (22.8) | |
| >200 | 348 (11.0) | 33 (8.2) | 52 (8.2) | 96 (12.2) | 73 (10.7) | 94 (14.3) | <0.001 |
| WHO stage*, n (%) | |||||||
| I and II | 811 (25.7) | 66 (16.3) | 133 (21.1) | 186 (23.8) | 212 (31.0) | 214 (32.5) | |
| III | 1638 (51.8) | 205 (50.7) | 357 (56.6) | 446 (57.0) | 327 (47.7) | 303 (46.0) | |
| IV | 712 (22.6) | 133 (32.9) | 141 (22.4) | 151 (19.3) | 146 (21.3) | 141 (21.4) | |
| Viral load** (copies/ml) | 0.0002 | ||||||
| log10 median (IQR) | 4.9 (4.5-5.3) | 4.9 (4.5-5.3) | 4.8 (4.4-5.2) | 4.9 (4.4-5.4) | 5.0 (4.5-5.4) | 4.9 (4.5-5.3) | |
| Regimen, n(%) | <0.001 | ||||||
| d4T/3TC/EFV | 1946 (61.5) | 350 (86.6) | 511 (81.0) | 477 (61.0) | 315 (46.0) | 293 (44.5) | |
| d4T/3TC/NVP | 752 (23.8) | 14 (3.5) | 43 (6.8) | 209 (26.7) | 254 (37.1) | 232 (35.2) | |
| AZT/3TC/EFV | 106 (3.4) | 5 (1.2) | 6 (1.0) | 33 (4.2) | 34 (4.9) | 28 (4.3) | |
| AZT/3TC/NVP | 354 (11.2) | 34 (8.4) | 71 (11.3) | 63 (8.1) | 81 (11.8) | 105 (15.9) | |
| Other | 4 (0.13) | 1 (0.3) | - | 1 (0.1) | 1 (0.2) | 1 (0.2) | |
| Staffing ratios | |||||||
| Peer counsellor-to-patient | - | 1:22 | 1:36 | 1:58 | 1:89 | 1:98 | |
| Doctor‡-to-patient | - | 1:202 | 1:258 | 1:303 | 1:500 | 1:395 |
3TC, lamivudine; ART, antiretroviral therapy; d4T, stavudine; EFV, efavirenz; IQR, interquartile range; NVP, nevirapine;AZT, zidovudine
Data available for 97% of subjects
Data available for 99.9% of subjects
Data available for 96.6% of subjects
Includes clinical nurse practitioners.
Programme Losses
Overall, 334 (10.6%) patients died, 592 (18.7%) patients were lost to follow-up (LTFU) and 326 (10.3%) patients were transferred to another ART facility. Kaplan-Meier analyses were used to provide probability estimates of long-term losses. The probability of being lost to care through death or LTFU was 37.4% (95%CI, 34.9-40.0) at 6 years (Figure 1a). In addition, some patients were transferred out so that the overall probability of leaving the programme for any reason was 52.5% (95%CI, 49.5-55.6) after 6 years (Fig 1a). When examined by calendar period of enrolment, total losses (death, losses to follow-up and transfers-out) increased between sequential calendar periods of enrolment (Fig 1b), although the difference between the latter two periods was not statistically significant.
Figure 1.
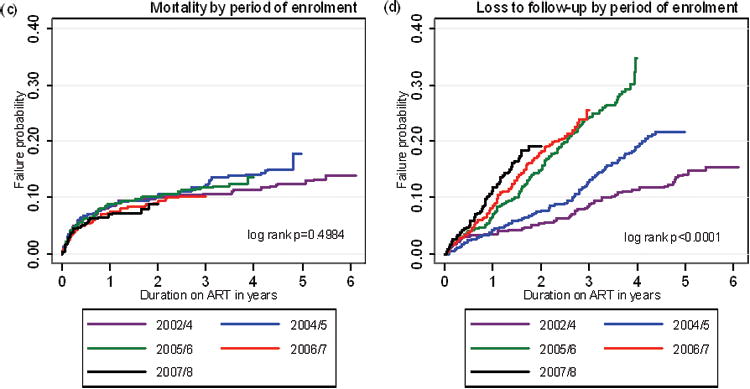
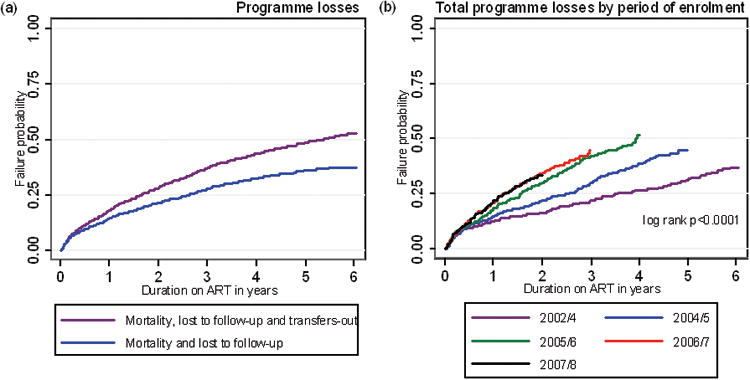

Kaplan-Meier failure estimates of: (a) programme losses (deaths, losses to follow-up with and without transfers-out included); (b) total programme losses by calendar period of enrolment; (c) mortality by calendar of enrolment; (d) losses to follow-up by calendar period of enrolment; (e) transfers-out by calendar period of enrolment.
We next examined each of these losses in turn. Probability of death was greatest in the first one year of ART with an estimate of 7.9% (95% CI, 7.0-8.9%) of patients. However, mortality risk was lower in subsequent years and the cumulative probability of death after 6 years just 15.2% (95% 13.1-17.6%). Mortality did not differ substantially between sequential calendar periods of enrolment with one year mortality estimates for the 5 sequential periods of 8.4% (6.0-11.6), 8.3% (6.3-10.7), 8.7% (6.9-11.0), 7.3% (5.6-9.7) and 6.9% (5.1-9.1) (Fig. 1c).
In contrast to deaths, the probability of patients being LTFU was much higher at 29.1% (95% CI 26.5-31.8%) after 6 years and the proportions LTFU increased significantly between successive calendar periods of enrolment (Fig. 1d). Furthermore, the probability of being transferred-out was 21.6% (95% CI 18.2-25.4%) after 6 years and, similar to LTFU, transfers-out increased between successive calendar periods of enrolment (Fig. 1e).
Virological Failure
Having observed that LTFU and transfers out increased over time with successive calendar periods of enrolment, we next examined risk of virological failure. By 6 years, the probability of virological failure was 23.1% (95%CI, 20.2-26.3) (Fig 2a) and this proportion also increased with each successive calendar period of enrolment (Fig 2b).
Figure 2.
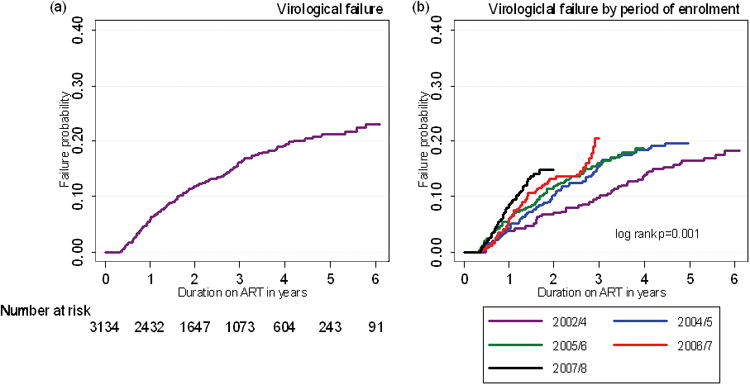
Kaplan-Meier failure estimates of: (a) virological failure and (b) virological failure by calendar period of enrolment.
Risk factors associated with programme losses and virological failure
We next used univariate and multivariate analyses to determine factors associated with death, LTFU, transfer-out and virological failure and included calendar period of enrolment as a key variable of interest. Final fully adjusted models are shown in Table 2.
Table 2.
Baseline patient characteristics associated with programme losses (deaths, loss to follow-up and transfers-out) and virological failure in multivariate Cox proportional hazard models.
| Variable | Deathsa | LTFUb | Transfers-outc | Virological failuired | ||||
|---|---|---|---|---|---|---|---|---|
|
|
||||||||
| AHR (95% CI) | P | AHR (95% CI) | P | AHR (95% CI) | P | AHR (95% CI) | P | |
|
| ||||||||
| Male sex | 1.48 (1.17-1.88) | 0.001 | 1.26 (1.05-1.51) | 0.014 | 0.82 (0.64-1.04) | 0.100 | - | - |
|
| ||||||||
| Age | 1.00 | - | ||||||
| ≤ 25 yrs (ref.) | 1.00 | - | 1.00 | - | - | - | 0.50 (0.36-0.69) | <0.001 |
| 26-30 yrs | 0.72 (0.44-1.17) | 0.185 | 0.74 (0.56-0.98) | 0.033 | - | - | 0.46 (0.34-0.62) | <0.001 |
| 31-40 yrs | 0.72 (0.46-1.13) | 0.158 | 0.53 (0.40-0.69) | <0.001 | - | - | 0.33 (0.23-0.47) | <0.001 |
| ≥41 yrs | 1.34 (0.85-2.12) | 0.208 | 0.48 (0.35-0.64) | <0.001 | - | - | ||
|
| ||||||||
| CD4 cell count category (cells/μl) | ||||||||
| ≤50 (ref.) | 1.00 | - | - | - | - | - | 1.00 | - |
| 51-100 | 0.57 (0.43-0.77) | <0.001 | - | - | - | - | 0.72 (0.55-0.94) | 0.018 |
| 101-150 | 0.50 (0.36-0.70) | <0.001 | - | - | - | - | 0.66 (0.49-0.89) | 0.006 |
| 151-200 | 0.40 (0.27-0.59) | <0.001 | - | - | - | - | 0.72 (0.53-0.98) | 0.034 |
| >200 | 0.41 (0.25-0.65) | <0.001 | - | - | - | - | 0.47 (0.31-0.72) | 0.001 |
|
| ||||||||
| WHO stage | ||||||||
| Stage I and II (ref.) | 1.00 | - | 1.00 | - | - | - | 1.00 | - |
| Stage III and IV | 1.94 (1.34-2.81) | <0.001 | 1.24 (1.02-1.51) | 0.031 | - | - | 1.09 (0.84-1.40) | 0.514 |
|
| ||||||||
| Log10 viral load category (copies/ml) | ||||||||
| <4 (ref.) | 1.00 | - | - | - | - | - | 1.00 | - |
| 4-4.9 | 1.06 (0.64-1.76) | 0.810 | - | - | - | - | 1.43 (0.93-2.21) | 0.106 |
| ≥5 | 1.43 (0.87-2.37) | 0.159 | - | - | - | - | 2.05 (1.32-3.18) | 0.001 |
|
| ||||||||
| Year of starting ART | ||||||||
| 2002/4 (ref.) | 1.00 | - | 1.00 | - | 1.00 | - | 1.00 | - |
| 2004/5 | 1.41 (0.97-2.04) | 0.070 | 1.76 (1.24-2.48) | 0.001 | 2.00 (1.27-3.15) | 0.003 | 1.38 (0.98-1.95) | 0.066 |
| 2005/6 | 1.17 (0.80-1.72) | 0.420 | 3.14 (2.24-4.39) | <0.001 | 2.88 (1.82-4.55) | <0.001 | 1.48 (1.05-2.11) | 0.026 |
| 2006/7 | 1.11 (0.74-1.67) | 0.624 | 3.64 (2.54-5.22) | <0.001 | 4.34 (2.71-6.93) | <0.001 | 1.74 (1.20-2.53) | 0.004 |
| 2007/8 | 1.11 (0.71-1.72) | 0.653 | 4.86 (3.32-7.11) | <0.001 | 3.65 (2.17-6.15 | <0.001 | 2.49 (1.68-3.69) | <0.001 |
LTFU, lost to follow-up; AHR, adjusted odds ratio; ART, antiretroviral therapy; CI, confidence interval;P, p-value and -, no association with particular outcome
3012 observations
3132 observations
3134 observations
3012 observations
Higher mortality risk was significantly associated with male sex, lower baseline CD4 cell count (≤50 cells/μl) and WHO stage of disease III and IV (Table 2). However, consistent with Fig. 1c, mortality was not associated with calendar period of enrolment. Factors significantly associated with LTFU were male sex, younger age and WHO stage of disease III and IV. However, greater risk of LTFU was also associated with later calendar periods of enrolment, with adjusted hazard ratios increasing with each successive calendar period (Table 2). Being transferred to another ART facility was not associated with baseline patient characteristics but was strongly associated with cohort year of enrolment (Table 2). Thus, patients enrolled in latter years were far more likely to be LTFU or be transferred to another treatment site.
Finally, factors significantly associated with virological failure were younger age (≤25 years), lower baseline CD4 cell count (≤50 cells/μl) and higher baseline viral load (≥5 log10 copies/ml). However, risk of virological failure also increased significantly for patients in later calendar periods of enrolment (Table 2).
Virological and immunological responses to ART
Thus far, data indicate worsening programme performance with regard to increasing risk of LTFU and virological failure when comparing patients enrolled in successive calendar periods. To provide a better assessment of patients' initial adherence and response to ART, we next examined viral load suppression rates after 16 weeks of ART and the proportion of patients with a CD4 cell count ≤200 cells/uL after 48 weeks of ART.
Viral load suppression to <400 copies/mL was observed among a very high proportion of patients, exceeding 93% for each successive calendar period of enrolment (Table 3). In multivariate analysis using logistic regression, lack of virological suppression at 16 weeks was significantly associated with age <25 years and high baseline viral load (≥5 log10 copies/ml) but not with cohort year of enrolment (data not shown).
Table 3. Proportions of patients with (i) viral load suppression at 16 weeks and (ii) CD4 cell count ≤200 cells/μl after 48 weeks stratified according to year of ART initiation.
| Total period | 2002/4 | 2004/5 | 2005/6 | 2006/7 | 2007/8 | P-value | |
|---|---|---|---|---|---|---|---|
| Viral load <400 copies/ml at week 16 | 2 248 (94.3) | 315 (96.3) | 388 (93.3) | 574 (93.5) | 497 (96.0) | 474 (93.1) | 0.091 |
| CD4 count ≤200 cells/μl at week 48 | 588 (25.3) | 96 (29.4) | 155 (31.1) | 120 (21.5) | 121 (25.2) | 96 (20.8) | <0.001 |
Data available from 75.4% (n=2384) of patients retained
Data available from 73.5% (n=2325) of patients retained
Approximately 90% of patients had a CD4 cell count ≤200 cells/uL at baseline (Table 1) and this proportion decreased to between 20.8% and 31.1% after 48 weeks ART comparing different calendar periods of enrolment (Table 3). In fully adjusted analyses, factors significantly associated with CD4 cell count remaining ≤200 cells/μL at 48 weeks were male sex, older age (≥41 years), lower baseline CD4 cell counts and lower baseline viral loads (data not shown). However, similar to virological suppression rates, there was no association with cohort year of enrolment.
Discussion
To optimize the benefits of ART, a number of overlapping short-term and long-term goals collectively require proficient and supportive delivery of treatment by a team of health-care workers and counsellors. The over-riding goal is to rapidly reduce mortality through diagnosis and treatment of co-morbidities, provision of co-trimoxazole prophylaxis and achievement of optimum virological and immunological responses to ART. Long-term goals include the retention of patients on ART with high rates of treatment adherence and sustained virological suppression.
In this paper, 3162 patients were started on ART in a South African treatment service studied over 7 years. Excellent early outcomes (mortality and virological and immunological responses) were sustained in sequential calendar periods of ART initiation. In contrast, however, cumulative rates of longer-term adverse outcomes of LTFU and virological failure deteriorated over time as the service enlarged and ratios of patient to health worker staff numbers are adversely affected. As ART services grow in seize, patient care and support systems may be overly focused on treatment initiation and the subsequent few months of care and that additional attention and resources are needed for ongoing treatment support in the longer term.
A key outcome of ART programmes is combined attrition due to death and LTFU. This was 37.4% after 6 years, which is similar to that observed in another programme in Cape Town.6 A previous meta-analysis of cohorts in sub-Saharan Africa reported average losses of approximately 40% after just two years.5 The probability of retaining approximately two-thirds of our cohort on ART after 6 years represents a considerable success. However, the risk of being lost to the programme increased with each successive calendar year of enrolment, suggesting a progressive deterioration in programme performance. To explore this further, we examined these different losses separately in addition to early and late virological responses to ART.
Between 8% and 26% of patients die during the first year of ART in treatment programmes in sub-Saharan Africa3 and yet, patients in this cohort had a one year mortality rate of 7.9%, despite many having advanced immunodeficiency. This represents among the lowest reported mortality rates in the region. Moreover, regardless of escalating patient case-load, one-year mortality rates did not differ between successive calendar periods of ART initiation. Thus, the over-riding goal of maintaining low mortality rates during scale-up of this service was achieved.
Virological suppression is another key early programmatic goal. Excellent suppression rates were observed, with ≥93% of patients having suppression <400 copies/mL at 16 weeks, and these rates did not vary significantly between successive years of recruitment. This is indicative of very high rates of initial adherence to effective treatment. We also examined the proportion of patients with a CD4 cell count <200 cells/uL at 48 weeks since this is the patient sub-set that remains at high ongoing risk of mortality and of morbidity.12, 14 This proportion decreased from approximately 90% at baseline to approximately 20-30% after 48 weeks of ART and did not significantly differ between sequential calendar periods of ART initiation. Thus, collective first year key outcomes of mortality and virological and immunological responses were sustained over 7 years during scale-up of this service. This suggests that standards of initial care and treatment support provided in the initial months of ART were sustained regardless of overall patient case-load in the service.
After the first year of ART, a key challenge is to retain patients within the cohort and maintain virological suppression. We found that the cumulative probability of being LTFU after 6 years ART was 29.1%, which is broadly similar to another programme in Cape Town.6 However, the proportion LTFU increased significantly between sequential calendar periods of ART initiation as observed elsewhere.6, 15, 16 Escalating patient case-load may be an important underlying factor as this may be associated with increasing clinic waiting times, shorter consultations, reduced opportunities for counselling and adherence support and over-stretching of human resources for patient tracing following missed appointments. Indeed, over the course of scale-up, the number of new patients enrolled per peer counsellor or per doctor increased several-fold (Table 1).
The increasing rates of LTFU were also paralleled by increasing risk of virological failure, further underscoring the suggestion that treatment support had diminished over time with increasing clinic size. The probability of virological failure in the whole cohort at 6 years was 23.1% and many patients who develop failure in this cohort have drug resistance mutations.17 Few other data are available from public sector programmes in sub-Saharan African due to a lack of availability of routine virological monitoring and directly comparable prospectively collected data are lacking.18 The failure rate we observed is higher than the rate of 14% reported in another programme in Cape Town6, but definitions of failure and frequency of virological monitoring differed between programmes. The increasing rate of virological failure has important implications with regard to escalating rates of drug resistance and increased switching to protease-inhibitor-based second line therapy, which is considerably more expensive. Remaining therapeutic options thereafter are few.
The proportion of patients transferred between services in ART programmes in sub-Saharan Africa is highly variable, but a large meta-analysis reported a weighted average of just 1.1% after a median of 26 months ART.19 In contrast, approximately one fifth of our cohort was estimated to transfer care over 6 years of ART. The long-term outcomes of such patients are not known. The probability of being transferred out was much greater for patients initiating ART in more recent calendar periods. They may be several explanations for this. First, expansion in the availability of ART services in surrounding communities and elsewhere in South Africa has increasingly provided access for patients to be treated near their own homes. It is also likely that those enrolled in the clinic in the earlier years compared to later years had more attachment to the clinic, especially as in the earlier years clinics were small and little was known about likely outcomes. It is also possible that patients who resume work after a period of illness may wish to be transferred to other centres which are less busy, have shorter waiting times or are more conveniently located. The South African population is highly mobile and this provides a challenge to long-term care. Efficient referral and patient tracking systems are needed to facilitate uninterrupted care for such patients.
Strengths of this study include the fact that these data are from a primary care clinic within the South African public sector system. The cohort of over three thousand patients is very well characterized and has very complete prospectively recorded data on patient outcomes. This cohort has one of the longest durations of follow-up within the context of a public sector ART programmes in sub-Saharan Africa. The analysis of outcomes data by calendar period of enrolment provides critical insights into changing treatment outcomes over time.
Limitations include the analysis of multiple endpoints, which could increase the chance of false positive findings. To minimize this bias we analysed each outcome separately. Some deaths could have remained unascertained and recorded as LTFU. However, low CD4 cell counts were not a risk factor for LTFU (Table 2) and the temporal distribution of deaths and LTFU differed (Fig. 1c and 1d), suggesting that any such overlap was insubstantial. Although escalating size of the treatment cohort is suggested as a plausible factor underlying the rising risk of LTFU and virological failure over time, a causal association has not been demonstrated and other as yet unidentified factors may be important. The subsequent outcomes of patients transferred out to other services is unknown.
In summary, this analysis of a community-based ART services shows that mortality and immunological and virological responses during the first year were not compromised during scale-up, suggesting that patient preparation for ART and initial medical care were maintained at a high standard. However, the cumulative probability of patients being LTFU or developing virological failure deteriorated over time when comparing successive calendar periods of recruitment. This may reflect a diminishing capacity over time to adequately support patients during long-term therapy as clinic size escalates.
Acknowledgments
The authors gratefully acknowledge the dedicated staff of the Hannan Crusaid ART clinic and the Desmond Tutu HIV Centre
Financial support: MDN is supported as an operational research fellow by the International Union Against Tuberculosis and Lung Disease, Paris, France. SDL and KK are funded by the Wellcome Trust, London, UK. RW and LGB are funded in part by the National Institutes of Health (NIH/NAID) grants 1U19AI53217-01 (RW and LGB) and by grant RO1 A1058736-01A1 (RW).
Footnotes
Publisher's Disclaimer: This is a PDF file of an unedited manuscript that has been accepted for publication. As a service to our customers we are providing this early version of the manuscript. The manuscript will undergo copyediting, typesetting, and review of the resulting proof before it is published in its final citable form. Please note that during the production process errors may be discovered which could affect the content, and all legal disclaimers that apply to the journal pertain.
References
- 1.World Health Organisation. Progress report 2009. Wolrd Health Organization; Geneva: 2010. [Accessed 12 January 2010]. Towards universal access: scaling up priority HIV/AIDS interventions in the health sector. Available at: http://www.who.int/hiv/pub/tuapr_2009_en.pdf. [Google Scholar]
- 2.Ivers LC, Kendrick D, Doucette K. Efficacy of antiretroviral therapy programs in resource-poor settings: a meta-analysis of the published literature. Clin Infect Dis. 2005 Jul 15;41(2):217–224. doi: 10.1086/431199. [DOI] [PubMed] [Google Scholar]
- 3.Lawn SD, Harries AD, Anglaret X, Myer L, Wood R. Early mortality among adults accessing antiretroviral treatment programmes in sub-Saharan Africa. Aids. 2008 Oct 1;22(15):1897–1908. doi: 10.1097/QAD.0b013e32830007cd. [DOI] [PMC free article] [PubMed] [Google Scholar]
- 4.Braitstein P, Brinkhof MW, Dabis F, et al. Mortality of HIV-1-infected patients in the first year of antiretroviral therapy: comparison between low-income and high-income countries. Lancet. 2006 Mar 11;367(9513):817–824. doi: 10.1016/S0140-6736(06)68337-2. [DOI] [PubMed] [Google Scholar]
- 5.Rosen S, Fox MP, Gill CJ. Patient retention in antiretroviral therapy programs in sub-Saharan Africa: a systematic review. PLoS Med. 2007 Oct 16;4(10):e298. doi: 10.1371/journal.pmed.0040298. [DOI] [PMC free article] [PubMed] [Google Scholar]
- 6.Boulle A, Van Cutsem G, Hilderbrand K, et al. Seven-year experience of a primary care antiretroviral treatment programme in Khayelitsha, South Africa. Aids. 2010 Feb 20;24(4):563–572. doi: 10.1097/QAD.0b013e328333bfb7. [DOI] [PubMed] [Google Scholar]
- 7.Bussmann H, Wester CW, Ndwapi N, et al. Five-year outcomes of initial patients treated in Botswana's National Antiretroviral Treatment Program. Aids. 2008 Nov 12;22(17):2303–2311. doi: 10.1097/QAD.0b013e3283129db0. [DOI] [PMC free article] [PubMed] [Google Scholar]
- 8.Sanne IM, Westreich D, Macphail AP, Rubel D, Majuba P, Van Rie A. Long term outcomes of antiretroviral therapy in a large HIV/AIDS care clinic in urban South Africa: a prospective cohort study. J Int AIDS Soc. 2009;12:38. doi: 10.1186/1758-2652-12-38. [DOI] [PMC free article] [PubMed] [Google Scholar]
- 9.Lawn SD, Myer L, Orrell C, Bekker LG, Wood R. Early mortality among adults accessing a community-based antiretroviral programme in South Africa: implications for programme design. AIDS. 2005;19:2141–2148. doi: 10.1097/01.aids.0000194802.89540.e1. [DOI] [PubMed] [Google Scholar]
- 10.Bekker LG, Myer L, Orrell C, Lawn S, Wood R. Rapid scale-up of a community-based HIV treatment service: programme performance over 3 conecutive years in Gugulethu, South Africa. South African Medical Journal. 2006;96:315–320. [PubMed] [Google Scholar]
- 11.Lawn SD, Myer L, Harling G, Orrell C, Bekker LG, Wood R. Determinants of mortality and nondeath losses from an antiretroviral treatment service in South Africa: implications for programme evaluation. Clinical Infectious Diseasae. 2006;43(6):770–776. doi: 10.1086/507095. [DOI] [PubMed] [Google Scholar]
- 12.Lawn SD, Little F, Bekker LG, et al. Changing mortality risk associated with CD4 cell response to antiretroviral therapy in South Africa. Aids. 2009 Jan 28;23(3):335–342. doi: 10.1097/QAD.0b013e328321823f. [DOI] [PMC free article] [PubMed] [Google Scholar]
- 13.Lawn SD, Kaplan R, Wood R, Bekker LG. Promoting retention in care: an effective model in an antiretroviral treatment service in South Africa. Clin Infect Dis. 2007 Sep 15;45(6):803. doi: 10.1086/521173. [DOI] [PubMed] [Google Scholar]
- 14.Lawn SD, Myer L, Edwards D, Bekker LG, Wood R. Short-term and long-term risk of tuberculosis associated with CD4 cell recovery during antiretroviral therapy in South Africa. Aids. 2009 Aug 24;23(13):1717–1725. doi: 10.1097/QAD.0b013e32832d3b6d. [DOI] [PMC free article] [PubMed] [Google Scholar]
- 15.Boulle A, Bock P, Osler M, et al. Antiretroviral therapy and early mortality in South Africa. Bulletin of World Health Organisation. 2008;86:678–687. doi: 10.2471/BLT.07.045294. [DOI] [PMC free article] [PubMed] [Google Scholar]
- 16.Brinkhof MWG, Dabis F, Myer L, et al. Early loss of HIv-infected patients on potent antiretroviral therapy programmes in lower-income countries. Bulletin of World Health Organisation. 2008;86:559–567. doi: 10.2471/BLT.07.044248. [DOI] [PMC free article] [PubMed] [Google Scholar]
- 17.Orrell C, Walensky RP, Losina E, Pitt J, Freedberg KA, Wood R. HIV type-1 clade C resistance genotypes in treatment-naive patients and after first virological failure in a large community antiretroviral therapy programme. Antivir Ther. 2009;14(4):523–531. [PMC free article] [PubMed] [Google Scholar]
- 18.Barth RE, van der Loeff MF, Schuurman R, Hoepelman AI, Wensing AM. Virological follow-up of adult patients in antiretroviral treatment programmes in sub-Saharan Africa: a systematic review. Lancet Infect Dis. 2010 Mar;10(3):155–166. doi: 10.1016/S1473-3099(09)70328-7. [DOI] [PubMed] [Google Scholar]
- 19.Fox MP, Rosen S. Patient retention in antiretroviral therapy programs up to three years on treatment in sub-Saharan Africa, 2007-2009: systematic review. Tropical Medicine & International Health. 2010;15(s1):1–15. doi: 10.1111/j.1365-3156.2010.02508.x. [DOI] [PMC free article] [PubMed] [Google Scholar]