Abstract
Convergence of visual motion and vestibular information is essential for accurate spatial navigation. Such multisensory integration has been shown in cortex, e.g., the dorsal medial superior temporal (MSTd) and ventral intraparietal (VIP) areas, but not in the parieto-insular vestibular cortex (PIVC). Whether similar convergence occurs subcortically remains unknown. Many Purkinje cells in vermal lobules 10 (nodulus) and 9 (uvula) of the macaque cerebellum are tuned to vestibular translation stimuli, yet little is known about their visual motion responsiveness. Here we show the existence of translational optic flow-tuned Purkinje cells, found exclusively in the anterior part of the nodulus and ventral uvula, near the midline. Vestibular responses of Purkinje cells showed a remarkable similarity to those in MSTd (but not PIVC or VIP) neurons, in terms of both response latency and relative contributions of velocity, acceleration, and position components. In contrast, the spatiotemporal properties of optic flow responses differed from those in MSTd, and matched the vestibular properties of these neurons. Compared with MSTd, optic flow responses of Purkinje cells showed smaller velocity contributions and larger visual motion acceleration responses. The remarkable similarity between the nodulus/uvula and MSTd vestibular translation responsiveness suggests a functional coupling between the two areas for vestibular processing of self-motion information.
Introduction
Accurate processing of self-motion information is critical for spatial navigation and often requires integration of visual (optic flow) and vestibular signals. Visual-vestibular convergence has been demonstrated in the macaque parietal cortex, such as the dorsal medial superior temporal area (MSTd; Duffy, 1998; Gu et al., 2006), the ventral intraparietal area (VIP; Schlack et al., 2002; Chen et al., 2011b), and the visual posterior sylvian area (Chen et al., 2011c). In contrast, visual/vestibular convergence appears weak or absent in the thalamus (Meng and Angelaki, 2010) and vestibular nuclei (Bryan and Angelaki, 2009). Another subcortical area with potential optic flow/vestibular convergence is the cerebellar nodulus and uvula (NU). Anatomically, the NU receives both visual and vestibular information via mossy and climbing fibers (Brodal, 1976; Hoddevik and Brodal, 1977; Korte and Mugnaini, 1979; Takeda and Maekawa, 1984, 1989; Brodal and Brodal, 1985; Kevetter and Perachio, 1986; Bernard, 1987; Gerrits et al., 1989; Sato et al., 1989; Epema et al., 1990; Barmack et al., 1993; Voogd et al., 1996; Ono et al., 2000; Maklad and Fritzsch, 2003; Newlands et al., 2003; Ruigrok, 2003; Kevetter et al., 2004).
Recent studies have reported simple and complex spike modulation of NU Purkinje cells in the macaque during vestibular sinusoidal translation in darkness (Yakusheva et al., 2007, 2008, 2010). However, whether vestibular responses in the macaque NU are encountered together with optic flow signals is unknown, although large field visual motion responses have been previously described in anesthetized pigeons (Wylie et al., 1991, 1993, 1999) and rabbits (Kano et al., 1990, 1991a,b; Shojaku et al., 1991; Barmack and Shojaku, 1995). In addition, the human NU is also activated during visually induced illusion of self-motion (Dieterich et al., 2000; Kleinschmidt et al., 2002).
Here we quantify simple spike modulation of macaque NU Purkinje cells in response to 3D transient vestibular and optic flow stimulation. In addition, we compare the spatiotemporal properties of NU Purkinje cells to those previously reported for cortical parieto-insular vestibular cortex (PIVC), MSTd, and VIP neurons. We show that a small percentage of NU Purkinje cells modulate significantly during optic flow, although response properties differ from those encountered in cortical neurons. In contrast, the spatiotemporal properties of vestibular translation responses in the NU are identical to corresponding properties of MSTd neurons, despite the lack of evidence of any direct anatomical interconnectivity between the two areas.
Materials and Methods
Animal preparation and experimental setup
Three male rhesus monkeys (Macaca mulatta) weighing between 6 and 9 kg were used in this study. Surgical procedures were similar to those used in our previous studies (Yakusheva et al., 2007, 2010). Specifically, each animal was chronically implanted with a circular Delrin ring for head restraint and a scleral search coil to measure eye movements. After animals fully recovered from surgeries, they were trained to fixate and follow a visual target for liquid rewards. To record from NU Purkinje cells, a Delrin platform with arrays of holes spaced 0.8 mm apart was stereotaxically implanted inside the ring. To provide access to the midline, the recording platform was tilted 10° in the mediolateral plane in two animals and, additionally, 10° in the anterior–posterior plane in the third animal. All surgical and experimental procedures were approved by the Animal Care and Use Committee at Washington University and were in agreement with National Institutes of Health regulations.
Vestibular stimulation was delivered using a motion platform with six degrees of freedom (MOOG 6 DOF200E) controlled through an Ethernet interface (Gu et al., 2006). During experiments, animals were seated in a primate chair secured inside the motion platform such that the horizontal stereotaxic plane aligned with the earth-horizontal plane and the axis of rotation passed through the center of the head. Visual stimuli (optic flow) were generated by an OpenGL accelerator board (Quadro FX 3000G; PNY Technologies) and displayed through a digital projector (Christie Digital Mirage 2000) onto a 60 × 60 cm tangent screen placed 30 cm in front of animal. Visual stimuli simulated self-motion through a 3D cloud of dots, viewed binocularly through red/green glasses (Kodak Wratten filters, red no. 29 and green no. 61). The projector, screen, and magnetic field coil frame were mounted on the platform and moved together with the animal. Because the sides of the coil frame were covered with a black enclosure, only the tangent screen was visible to the animal (thus, there was no visual motion stimulation during platform motion). Further details regarding motion platform and visual stimuli parameters can be found in Gu et al. (2006).
Anatomical localization and electrophysiological recordings
Extracellular recordings were made from 106 Purkinje cells. Tungsten microelectrodes (FHC; impedance 5–7 MΩ) were inserted into the NU through 26 gauge guide tubes and controlled by a hydraulic microdrive (FHC). Raw signals were amplified, filtered (0–10 kHz), digitized at 25 kHz (model 1401; Cambridge Electronic Design), and saved on a computer for off-line analysis. Linear acceleration, angular velocity, and eye coil output were filtered (200 Hz; 6 pole Bessel filter) and digitized at a rate of 833.33 Hz (model 1401, 16 bit resolution; Cambridge Electronics Design).
The NU was identified based on stereotaxic coordinates and anatomical location with respect to the abducens, vestibular, and fastigial nuclei (Angelaki et al., 2004; Shaikh et al., 2004, 2005). Recordings from Purkinje cells were verified using the same criteria described previously (Yakusheva et al., 2007, 2008, 2010). Only cells in the Purkinje cell layer (identified by the presence of complex spikes, CSs) were included in the present analyses. The raw neuronal data (simple spikes, SSs, and CSs) were sorted based on principal component analysis and analyzed off-line using Spike 2 (Cambridge Electronic Design). Most (77/106, referred to as “identified”) Purkinje cells were further identified off-line by the existence of a pause in SS firing following each CS (Yakusheva et al., 2010, their Fig. 1). The rest were classified as “putative” Purkinje cells. We found no difference in response properties between identified and putative Purkinje cells, thus the two groups have been considered together in all analyses.
Figure 1.
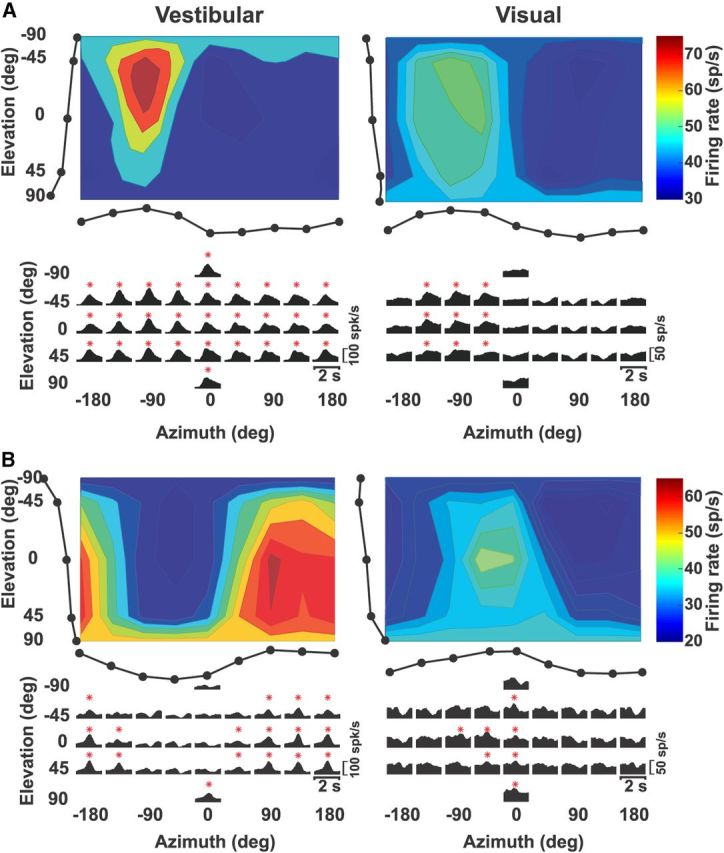
Two single-peaked examples of NU Purkinje cell responses during 3D vestibular and visual (optic flow) translation. A, Top, Congruent example cell. Color-contour maps, showing 3D direction tuning profiles (Lambert cylindrical projection) at peak time for vestibular (1.12 s) and visual (0.9 s) responses with preferred directions: [azimuth, elevation] = [−86°, −18°] and [−94°, −12°], respectively. Tuning curves along the margins illustrate mean firing rates plotted versus elevation or azimuth (averaged across azimuth or elevation, respectively). Bottom, Response PSTHs. Red stars indicate significant responses. B, Opposite example cell. Vestibular: [azimuth, elevation] = [131°, 22°] and peak time, 1.18 s; Visual: [azimuth, elevation] = [−48°, 25°] and peak time, 0.98 s.
Experimental protocol
We characterized simple spike activity during 3D transient vestibular and visual (optic flow) stimuli identical to those previously used to quantify responses of cerebral cortical areas (Gu et al., 2006; Takahashi et al., 2007; Chen et al., 2010, 2011a,b,c). Neural activity was first obtained using a “3D translation” experimental protocol, i.e., transient motion along 26 directions 45° apart in 3D space (Gu et al., 2006). These 26 directions included eight azimuth angles (0, 45, 90, 135, 180, 225, 270, and 315°, where 0° and 90° correspond to rightward and forward translations, respectively) and five elevation angles (0, ±45, ±90°). Note that elevation angles ± 90° include only one direction each (see Fig. 1, peristimulus time histograms, PSTHs). The motion stimuli followed a 2 s Gaussian velocity with a corresponding biphasic acceleration profile (see Fig. 6A). For translation stimuli the maximum displacement was 13 cm, peak velocity was 27 cm/s, and peak acceleration was 0.1 g (∼0.981 m/s2). Because the location of the NU is near the midline and fourth ventricle, some recordings of NU Purkinje cells were contaminated by very large pulsations. We recorded from 106 Purkinje cells. However, only 70 could be reliably isolated, as verified by null PSTHs without significant temporal modulation (based on a discrete Fourier transform method; Fetsch et al., 2010). Of 70 cells, 42 Purkinje cells were recorded during both visual and vestibular stimuli, 14 cells were recorded during only vestibular stimuli, and 14 cells were recorded during only visual stimuli.
Figure 6.
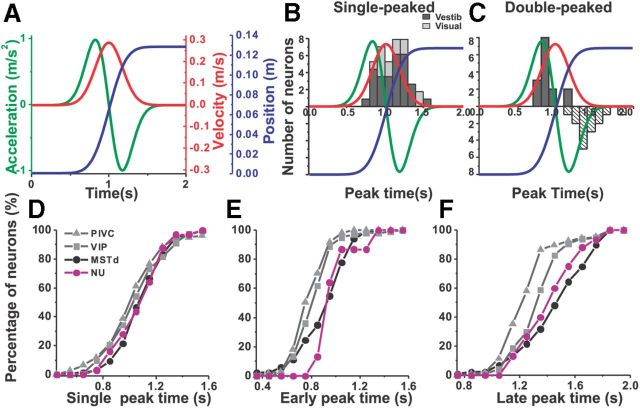
Distribution of peak times. A, The 2 s motion stimuli: stimulus velocity (red curve), acceleration (green curve), and position (blue curve). B, Distributions of peak times for single-peaked Purkinje cells during vestibular (dark bars, n = 32) and visual (light gray bars, n = 10) stimulation. Stimulus velocity (red curve), acceleration (green curve), and position (blue curve) are superimposed. C, Distributions of peak times for double-peaked Purkinje cells during vestibular motion only (n = 15). Dark gray bars: early peak times; white dashed bars: late peak times. D, Comparison of peak times for single-peaked cells in NU (n = 32) and in cortical PIVC (n = 59), VIP (n = 58), and MSTd (n = 127). E, F, Comparison of peak times for vestibular double-peaked cells among different areas: early peak times and late peak times (NU, n = 15; PIVC, n = 66; VIP, n = 26; MSTd, n = 43). Data for cortical areas have been replotted from Chen et al. (2011a,b).
For most (38/42, 90%) cells recorded during both visual and vestibular translation, stimuli were delivered in separate blocks. Within a single block (i.e., visual or vestibular) the stimulus direction was randomized. During visual translation monkeys were required to fixate a centrally located visual target (fixation window spanned 2 × 2° of visual angle). During vestibular translation neural responses were recorded in total darkness (no fixation with the projector turned off). The animal fixated a central target only when vestibular and visual stimuli were delivered within the same block (n = 4). No difference was found in vestibular responses between cells recorded with and without fixation of a central target; therefore all vestibular data were presented together.
Spontaneous activity was also obtained during null trials (no visual or vestibular stimuli) randomly interleaved with stimulus trials. Due to high response variability of NU Purkinje cells, only neurons with at least 10 (but typically 15–20) repetitions of each stimulus direction were included for SSs off-line analysis. However, this number of repetitions (15–20) was not sufficient to provide reliable analysis for CSs. Therefore, complex spikes were not further considered in this paper.
If isolation was maintained Purkinje cells were also tested with a 3D rotation protocol (visual and vestibular conditions, n = 13; only visual condition, n = 12; only vestibular condition, n = 1). The rotational stimuli followed a Gaussian velocity profile with amplitude of 9° (peak angular velocity, ∼20°/s). In the rotation protocol, the same 26 stimulus directions represent the corresponding axes of rotation according to the right-hand rule, where the azimuth of 0 and 90° (elevation, 0°) corresponds to pitch (up) and roll (right ear down) rotations, respectively. Elevations of −90° or 90° correspond to leftward and rightward yaw rotation, respectively (Takahashi et al., 2007; Chen et al., 2011b).
Data analysis
Data analysis was performed off-line using MATLAB (MathWorks). To quantify the temporal and spatial properties of NU Purkinje cells, we applied the same 3D tuning analysis that was previously used in cortical areas (Chen et al., 2010, 2011a,b,c). To evaluate temporal modulation, we constructed PSTHs by averaging responses from identical trials (same stimulus type and direction) using 25 ms time bins smoothed with a 400 ms boxcar filter. For those cells without pulsation artifacts (n = 70), maximum (for excitatory cells) and/or minimum (for inhibitory cells) responses were detected for each stimulus direction. The temporal modulation along each stimulus direction was considered significant when the spike count distribution from the time bin containing the maximum and/or minimum response differed significantly from the baseline response distribution (−100 to 300 ms poststimulus onset, Wilcoxon signed rank test, p < 0.01; Chen et al., 2010). Neurons were considered significantly modulated temporally by a given stimulus condition (visual or vestibular) if the response to at least two adjacent (≤45°) directions passed the significance criterion for temporal modulation defined above.
To evaluate spatial modulation (directional selectivity), we computed maximum/minimum neuronal responses across stimulus directions for each 25 ms bin between 0.5 and 2 s after stimulus onset and performed ANOVA to assess the statistical significance (p < 0.05) of directional selectivity for each time bin. This analysis determined the statistical significance of direction tuning as a function of time and assessed whether there are multiple time periods in which a neuron shows distinct temporal peaks of directional tuning (Chen et al., 2010). “Peak times” were then defined as the times of local maxima (for excitatory cells)/minima (for inhibitory cells) at which distinct epochs of directional tuning were observed. To compensate for the delay between the motion command and the actual movement of the platform, 115 ms was subtracted from the calculated peak time (Fetsch et al., 2010).
Based on the maximum/minimum responses and the number of distinct response peaks, we divided Purkinje cells into four groups: (1) “excitatory single-peaked,” cells with positive modulation that had one single temporal peak of directional tuning; (2) “excitatory double-peaked,” cells with positive modulation which had two temporal peaks of directional tuning; (3) “inhibitory single-peaked,” cells with negative (no positive) modulation and single temporal peak of directional tuning; and (4) “not tuned,” cells with no temporal and/or spatial modulation (note that no “inhibitory double-peaked cells were encountered). Only cells with significant temporal and spatial modulation (i.e., groups 1, 2, and 3) were considered for further analysis (n = 50, vestibular; n = 15, visual).
Color contour maps were used to illustrate the 3D directional tuning of each cell (Fig. 1A,B). In this representation, response amplitude was transformed using the Lambert cylindrical equal-area projection and the result plotted as a function of azimuth and elevation on Cartesian axes (Gu et al., 2006). The color scale in the contour map reflected the response amplitude of the neuron rounded to its nearest 10 spikes/s (sp/s). The preferred direction of each significantly modulated neuron was computed as a vector sum of its response, described by azimuth and elevation angles.
A direction discrimination index (DDI) was used to quantify the strength of directional tuning at each peak time (Takahashi et al., 2007), computed as follows:
 |
where Rmax and Rmin are the maximum and minimum responses from the 3D tuning analysis, respectively. SSE is the sum squared error around the mean response, N is the total number of observation (trials), and M is the number of stimulus directions (M = 26). DDI varies from 0 to 1 and indicates the difference in firing rate between the null and preferred directions against response variability. DDI values close to 1 indicate neurons with large response modulations relative to the noise level, whereas DDI values close to 0 correspond to neurons with weak response modulation.
Spatiotemporal model fit.
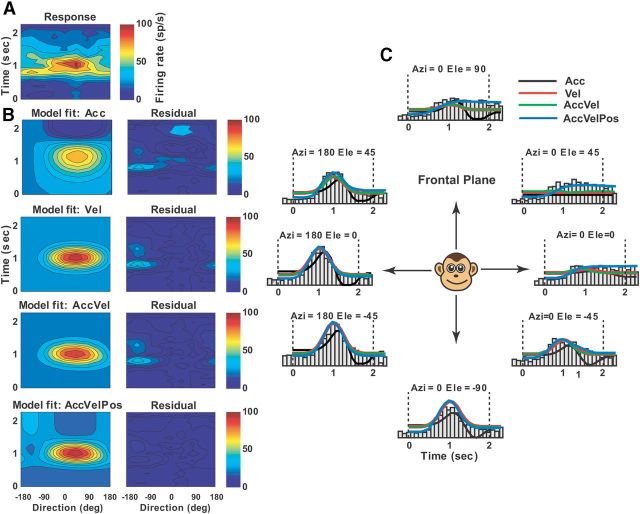
To better understand the spatiotemporal information carried by NU Purkinje cells and for direct comparison with responses in other areas, average PSTHs (100 ms bins) were fit by the same models used previously in cortical areas (MSTd, PIVC, VIP; Chen et al., 2011a,b,c). These models inform us of the type of signals NU Purkinje cells carry: acceleration, velocity, and/or position. The fitting was performed in one or all of the three cardinal planes (horizontal, frontal, and median), as long as each plane exhibited significant spatiotemporal tuning and significant space-time structure (p < 0.001, two-way ANOVA, significant main effect of space and time and significant interaction; Chen et al., 2011a,b,c). The space–time structure was visualized by plotting the data as a color-contour map of response amplitude, in which stimulus direction is plotted along the abscissa and time (during the 0–2 s stimulus profile) is plotted along the ordinate (see Figs. 7–10). For each cell we show results of model fitting from the cardinal plane with the strongest response.
Figure 7.
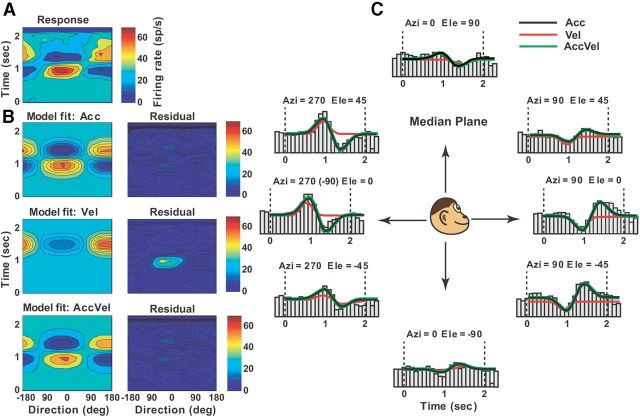
Example of best-fit acceleration model (Acc) to the spatiotemporal vestibular responses of a double-peaked Purkinje cell (same example as shown in Fig. 2). A, Direction-time color plot illustrating how direction tuning evolves over the time course of the response (spatial and temporal resolution: 45° and 100 ms, respectively). B, Model fits (left) and corresponding response residuals (right): acceleration (model Acc, r2 = 0.735), velocity (model Vel, r2 = 0.35), acceleration + velocity (model AccVel, r2 = 0.74, wa = 0.9, wv = 0.1), and acceleration + velocity + position (model AccVelPos, r2 = 0.741, wa = 0.9, wv = 0.1, wp = 0.07). C, Response PSTHs for eight directions in the median plane together with superimposed curve-fitting lines for each model: Acc (black), Vel (red), AccVel (green).
Figure 8.
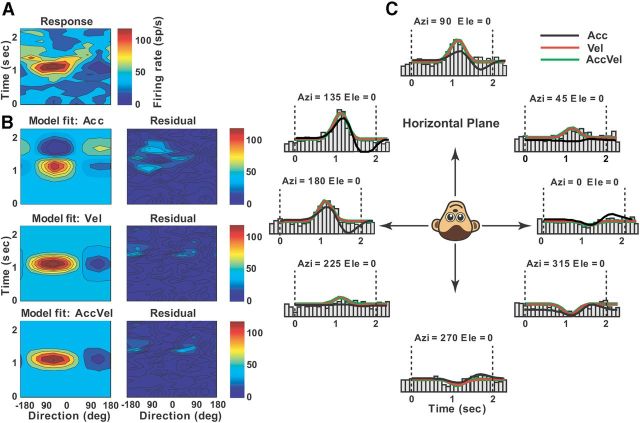
Example of best-fit velocity model (Vel) to the spatiotemporal vestibular responses of a single-peaked Purkinje cell. A, Direction-time color plot illustrating how direction tuning evolves over the time course of the response (spatial and temporal resolution: 45° and 100 ms, respectively). B, Model fits (left) and corresponding response residuals (right): model Acc, r2 = 0.4; model Vel, r2 = 0.77; model AccVel, r2 = 0.775, wa = 0.08, wv = 0.92), model AccVelPos, r2 = 0.78, wp = 0.1). C, Response PSTHs for eight directions in the horizontal plane together with superimposed curve-fitting lines for each model: Acc (black), Vel (red), AccVel (green).
Figure 9.
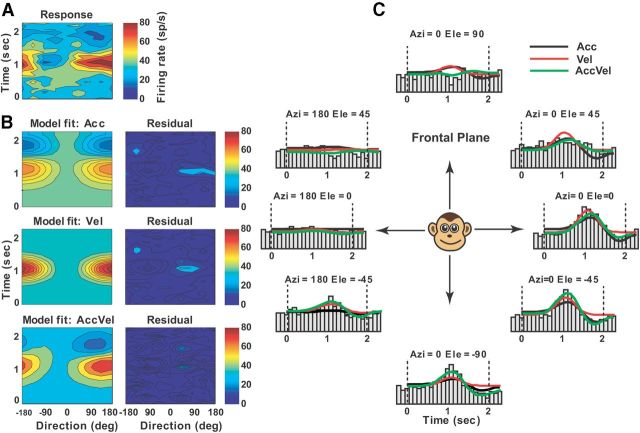
Example of best-fit acceleration + velocity model (AccVel) to the spatiotemporal vestibular responses of a single-peaked Purkinje cell. A, Direction-time color plot illustrating how direction tuning evolves over the time course of the response (spatial and temporal resolution: 45° and 100 ms, respectively). B, Model fits (left) and corresponding response residuals (right): model Acc (r2 = 0.53); model Vel (r2 = 0.59); model AccVel (r2 = 0.81, wa = 0.54, wv = 0.46); model AccVelPos (r2 = 0.816, wp = 0.03). C, Response PSTHs for eight directions in the frontal plane together with superimposed curve-fitting lines for each model: Acc (black), Vel (red), AccVel (green).
Figure 10.
Example of best-fit acceleration + velocity + position model (AccVelPos) to the spatiotemporal vestibular responses of a single-peaked Purkinje cell. A, Direction-time color plot illustrating how direction tuning evolves over the time course of the response (spatial and temporal resolution: 45° and 100 ms, respectively). B, Model fits (left) and corresponding response residuals (right): model Acc (r2 = 0.49); model Vel (r2 = 0.51); model AccVel (r2 = 0.6, wa = 0.49, wv = 0.51); model AccVelPos (r2 = 0.714, wp = 0.6). C, Response PSTHs for eight directions in the frontal plane together with superimposed curve-fitting lines for each model: Acc (black), Vel (red), AccVel (green), AccVelPos (blue).
There were four models fitted. (1) The first, “velocity” (Vel) model consisted of the product of a modified cosine function of stimulus direction (space) and a Gaussian velocity profile in time, computed as follows:
(2) The second, “acceleration” (Acc) model represented the product of the cosine spatial tuning function and an acceleration profile in time [derivative of G(t)], given by the following:
 |
In these models, R(θ, t) represents the response amplitude of the neuron (in sp/s) as a function of stimulus direction and time, A is the overall response amplitude, θ0 corresponds to the preferred direction, DC indicates a baseline shift of the spatial tuning (range: 0–0.5), R0 is a constant accounting for the resting firing rate of the neuron, and G(t) is a temporal Gaussian function defined as follows:
 |
where t0 is the time at which the peak response occurs and σt represents SD. Response latency was computed as t0 − 1 (since t = 0 reflects the start of the 2 s stimulus). Both models (Acc and Vel) contain seven free parameters: A, DC, θ0, n, σt, t0, and R0.
(3) The third, “acceleration + velocity” (AccVel) model contains a mixture of velocity and acceleration components with weights wv and wa (1 − wv), respectively, as follows:
 |
The AccVel model has two additional parameters, the weight, wv, and the difference between direction preferences for the velocity and acceleration components, Δθ0. If the neuron encodes pure velocity, then wv = 1; if it encodes pure acceleration, then wv = 0; if it encodes equal combinations of velocity and acceleration, then wv = 0.5. A ratio of the acceleration to velocity weights was computed as wa/wv = (1 − wv)/wv.
(4) The fourth, “acceleration + velocity + position” (AccVelPos) model incorporated an additional spatiotemporal component to allow for a position contribution. The position component was represented as the product of an offset spatial tuning curve and a position profile in time (integral of G(t)), as follows:
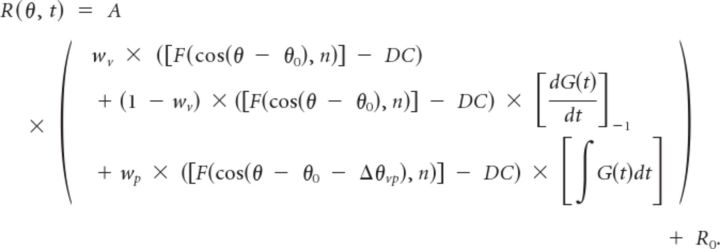 |
The additional parameters in this model are as follows: (1) the difference in direction preference between the velocity and position components, Δθvp and (2) the relative weight of the position component, wp, ranging from 0 to 1 (Chen et al., 2011 a,b).
The relative quality of the different model fits was evaluated using a sequential F test (p < 0.01). We first compared the fits of the two 7 parameter models (Acc and Vel) with the fit of the 9 parameter AccVel model to distinguish acceleration-only, velocity-only, and acceleration + velocity cells. For cells for which p < 0.01, in support of the AccVel model, an additional sequential F test between the AccVelPos and AccVel models determined the significance of the position component.
Results
We analyzed the simple spike activity of 70 Purkinje cells in the cerebellar nodulus and uvula (animal V: n = 38; animal P: n = 15; animal F: n = 17) during 3D translation (“vestibular condition”) and simulated translation (optic flow, “visual condition”). Of these, 42 Purkinje cells were tested during both stimuli, whereas a smaller number was tested during only the vestibular (n = 14) or only the visual (n = 14) conditions. A small subgroup of these NU Purkinje cells were also tested during 3D rotation: vestibular and visual (n = 13), only vestibular (n = 1), and only visual (n = 12). Because only one Purkinje cell showed significant modulation during rotational optic flow and three cells during vestibular rotation, we present here only responses of NU Purkinje cells during 3D translation.
Spatiotemporal tuning during vestibular and visual translation
Two types of multisensory vestibular/visual directional tuning were observed: (1) “congruent” Purkinje cells had similar vestibular/visual direction preferences (Fig. 1A) and (2) “opposite” Purkinje cells had nearly opposite vestibular/visual direction preferences (Fig. 1B). For example, the preferred directions for the congruent example in Figure 1A had azimuth/elevation = −86°/−18° (vestibular) and −94°/−12° (visual), corresponding to a backward and slightly upward direction. In contrast, preferred directions for the opposite Purkinje cell in Figure 1B were azimuth/elevation = 131°/22° (vestibular) and −48°/25° (visual). In general, visual responses were weaker than vestibular responses for both congruent and opposite multisensory cells.
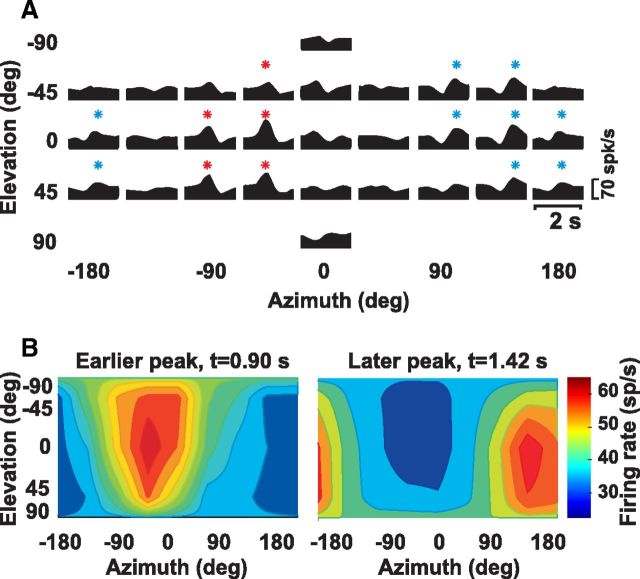
Both example neurons showed a single peak in their tuning, occurring simultaneously along different directions (Fig. 1A,B, red dots). Neurons with this type of responsiveness were classified as single-peaked excitatory (Chen et al., 2010). Similar to cortical areas (Chen et al., 2010, 2011a,b), we also encountered excitatory double-peaked NU Purkinje cells, having two significant peak times, as illustrated in Figure 2. This neuron showed a first peak at 0.9 s (azimuth = 130°, elevation = 15°) and a second peak at 1.42 s (azimuth = −55°, elevation = −10°), corresponding to backward and forward vestibular motion, respectively. We also observed Purkinje cells that were spatially tuned, but decreased their firing rate during stimulation; these neurons were classified as inhibitory tuned (Chen et al., 2010). Other cells were unresponsive based on our criteria for significant temporal and spatial modulation (see Materials and Methods) and thus classified as not tuned.
Figure 2.
Double-peaked example of NU Purkinje cell responses during 3D vestibular translation. A, Response PSTHs. Red (t = 0.9 s) and blue (t = 1.42 s) stars indicate significant responses at the two peak times. B, Color-contour maps, showing 3D direction tuning profiles (Lambert cylindrical projection) at the two peak times: first peak [azimuth = 130°, elevation = 15°], second peak [azimuth = −55°, elevation = −10°].
We found that 89% (50/56) of Purkinje cells were significantly tuned to vestibular translation. Of these, approximately half (32/56, 57%) were identified as excitatory single-peaked, about a quarter (15/56, 27%) as excitatory double-peaked, and few (3/56, 5%) as inhibitory tuned (Fig. 3A). The percentage of double-peaked cells in the NU was similar to VIP (31%) and MSTd (34%), but lower than in PIVC (52%) (Chen et al., 2010, 2011a). In contrast to vestibular translation, only 27% (15/56) of Purkinje cells were tuned to optic flow. Of these, 10 (18%) were identified as excitatory single-peaked, 2 (4%) as excitatory double-peaked, and 3 (5%) as inhibitory tuned (Fig. 3B).
Figure 3.
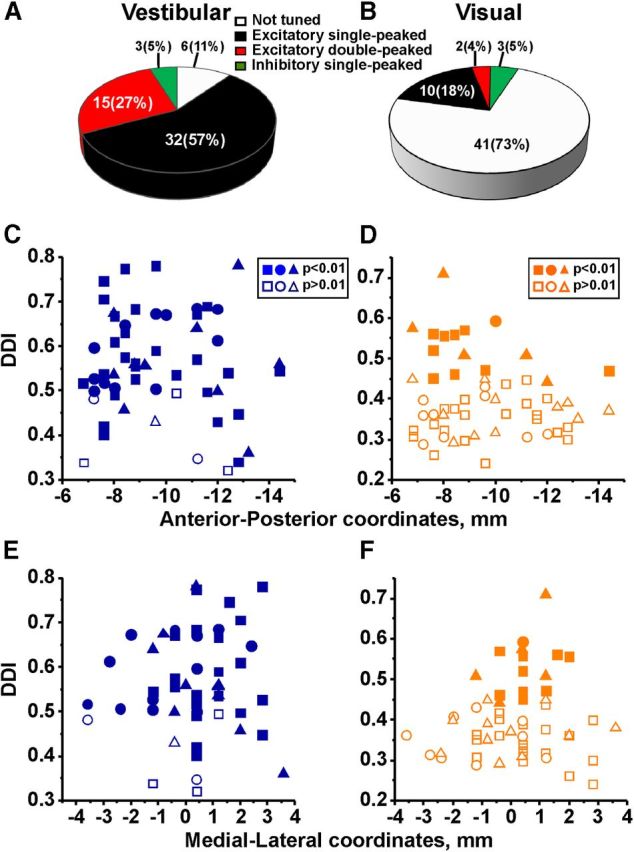
Summary of vestibular and visual response types and location along anterior–posterior and mediolateral coordinates. A, B, Percentage of different categories of neurons in response to vestibular (A) and visual (B) translation. C–F, Reconstructed locations of Purkinje cells recorded during vestibular (n = 56, blue) and visual (n = 56, orange) stimulation. DDI plotted as a function of anterior–posterior (C and D; 0 corresponds to the location of the abducens nuclei) and mediolateral (E and F; 0 corresponds to the midline) coordinates. Data are shown separately for each animal and each symbol corresponds to a single neuron: squares (animal V: vestibular, n = 31; visual, n = 30); circles (animal P: vestibular, n = 14; visual, n = 10); and triangles (animal F: vestibular, n = 11; visual, n = 16). Filled and open symbols represent cells with significant and not significant modulation, respectively.
The majority (25/42, 60%) of Purkinje cells tested during both vestibular and visual stimulation were “vestibular only” neurons, 26% (11/42) were tuned to both vestibular and visual stimulation (“multisensory”), and 14% (6/42) were not significantly tuned to any stimulus. We did not encounter any “visual only” neurons in the NU. Thus, in contrast to cortical areas MSTd and VIP (Gu et al., 2006; Chen et al., 2011b) only a small percentage of NU Purkinje cells showed significant spatiotemporal tuning to optic flow. This percentage was, however, larger than in PIVC and thalamic neurons (Chen et al., 2010; Meng and Angelaki, 2010). As also demonstrated previously (Yakusheva et al., 2007), Purkinje cells tuned to vestibular translation were relatively uniformly distributed in anterior–posterior and mediolateral locations (Fig. 3C; r = −0.003, p = 0.23; Fig. 3E; r = 0.01, p = 0.15, Spearman's rank correlation, applied to absolute values). In contrast, Purkinje cells tuned to optic flow tended to cluster in anterior and medial parts of the NU (Fig. 3D,F), as demonstrated by significant correlations between the DDI and recording location (Fig. 3D; r = −0.56, p < 0.001; Fig. 3F; r = −0.31, p = 0.05, Spearman's rank correlation, applied to absolute values). Thus, Purkinje cells with the highest visual DDI and strongest visual tuning were most likely located in the midline nodulus.
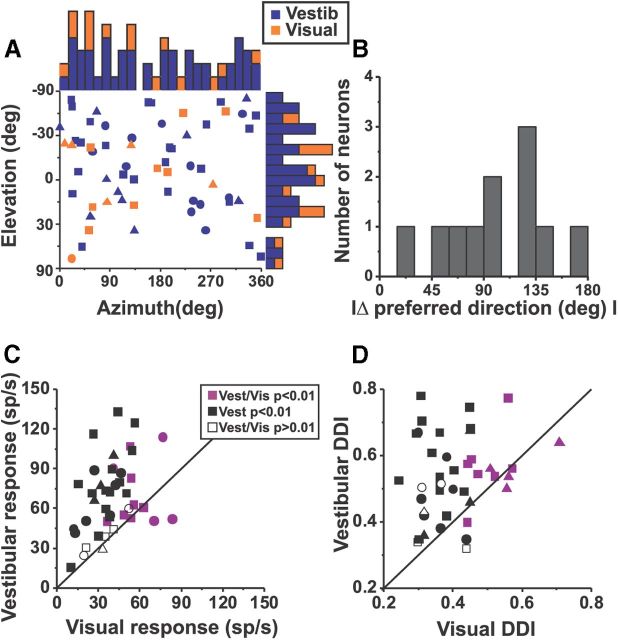
We previously reported that SS preferred directions during sinusoidal translation clustered around oblique axes, and this distribution was bimodal (Yakusheva et al., 2008). Here neither azimuth nor elevation preferences was bimodally distributed (Fig. 4A; p > 0.15, uniformity test), possibly because of the smaller sample size. Similarly, azimuth and elevation preferences during optic flow stimulation were also uniformly distributed (p = 0.4, uniformity test). These results contrast with those in VIP and MSTd neurons, where the majority of vestibular and visual neurons preferred lateral translation (Gu et al., 2006, 2010; Chen et al., 2011b). The difference in 3D direction preference (|Δ preferred direction|) between vestibular and visual preferred directions was nonuniform but unimodal (p < 0.01, uniformity test; puni > 0.54; Fig. 4B). Approximately half of multisensory Purkinje cells (5/11, 46%) were of the opposite type (|Δ preferred direction| > 120°; Fig. 1B) and only a few cells (2/11, 18%) were of the congruent type (|Δ preferred direction| < 60°; Fig. 1A). However, many Purkinje cells (4/11, 36%) had their absolute difference in 3D direction preference between 60 and 120°. In comparison, MSTd and VIP showed nearly equal distribution of congruent and opposite cells and these distributions were significantly bimodal (Gu et al., 2006; Chen et al., 2011b). We cannot exclude the possibility that the lack of bimodality in the distribution of |Δ preferred direction| in the NU is due to the small number of cells tuned to both stimuli.
Figure 4.
Comparison between vestibular and visual responses. A, Distribution of preferred directions in 3D. Each data point represents a preferred azimuth and elevation of a single cell for vestibular (blue symbols, n = 50) and visual (orange symbols, n = 15) conditions (only significantly tuned cells are included): squares (animal V: vestibular, n = 28; visual, n = 9); circles (animal P: vestibular, n = 12; visual, n = 1); and triangles (animal F: vestibular, n = 10; visual, n = 5). Data are plotted on Cartesian axes that represent the Lambert cylindrical equal-area projections of the spherical stimulus space. Histograms along the top and right sides show the corresponding marginal distributions (blue filled bars for vestibular and orange bars for visual). B, Distribution of the absolute difference between vestibular and visual preferred directions (|Δ preferred direction|) (n = 11). C, D, Scatter plots of the maximum response amplitude and DDI for Purkinje cells tested with both vestibular and visual stimuli (n = 42). Purple symbols indicate cells with significant tuning to both visual and vestibular stimuli (n = 11, ANOVA, p < 0.01). Black symbols show cells that were spatially and temporally tuned during only vestibular, but not during visual stimuli (n = 25). Open symbols correspond to cells with no significant tuning for both vestibular and visual stimuli (n = 6).
How response magnitude and DDI for vestibular and visual responses compare with each other is illustrated in Figure 4C and D. Purkinje cells tuned to both stimuli (purple symbols) had smaller visual than vestibular response amplitude (mean ± SE, 78 ± 4 sp/s vs 51 ± 5 sp/s, respectively; Wilcoxon signed rank test, p < 0.001; Fig. 4C), but there was no difference between the vestibular and visual DDI for the same group of cells (0.57 ± 0.01 and 0.52 ± 0.01, respectively; Wilcoxon signed rank test, p = 0.21; Fig. 4D, purple symbols). However, both differences were significant when comparing all neurons together (purple, black, open symbols; Wilcoxon signed rank test, p < 0.001; Fig. 4C,D; most data falling above the diagonal).
Optic flow tuning in NU Purkinje cells was also weaker when compared with cortical multisensory areas. Figure 5 shows cumulative distributions of vestibular and visual DDIs, Rmax-Rmin and response variability (PIVC data are only shown for vestibular responses, as there is negligible optic flow tuning; Chen et al., 2010). Vestibular DDIs for NU Purkinje cells (mean ± SE, 0.57 ± 0.017) were smaller than cortical neurons: PIVC (0.70 ± 0.01), VIP (0.67 ± 0.01), and MSTd (0.64 ± 0.01; p < 0.001, Wilcoxon rank sum test; Fig. 5A). The same was true for visual DDIs: NU Purkinje cells: 0.52 ± 0.01; MSTd: 0.77 ± 0.01; VIP: 0.71 ± 0.01 (Fig. 5B; p < 0.001, Wilcoxon rank sum test). DDI depends on both peak-to-trough modulation (Rmax-Rmin) and response variability (SSE, Eq. 1, see Materials and Methods). For vestibular translation (Fig. 5C), Rmax-Rmin in NU (mean ± SE, 47 ± 4 sp/s) was greater than in MSTd and VIP (39 ± 2 and 28 ± 1.5 sp/s, respectively; p < 0.014, Wilcoxon rank sum test), but similar to PIVC (45 ± 2 sp/s; p = 0.76, Wilcoxon rank sum test). For optic flow (Fig. 5D), Rmax-Rmin in NU (31 ± 1.8 sp/s) is similar to VIP (37 ± 1.8 sp/s; p = 0.11; Wilcoxon rank sum test), but smaller than in MSTd (68 ± 3 sp/s; p < 0.001). The fact that DDIs are weaker for NU Purkinje cells despite large peak-to-trough modulation, particularly for vestibular responses, suggests higher response variability in the NU, as illustrated in Figure 5E and F (p < 0.001, Wilcoxon rank sum tests).
Figure 5.
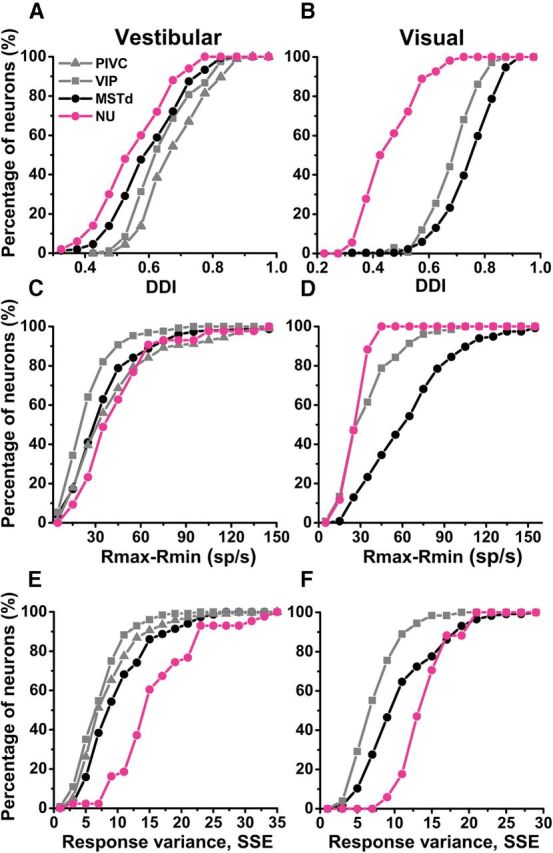
Comparison of responses of cerebellar NU and cortical areas (PIVC, VIP, and MSTd). Cumulative distributions were plotted for vestibular (left) and visual (right) responses. A, B, DDIs. C, D, Peak-to-trough response amplitude (Rmax-Rmin). E, F, Neural response variance, computed as the SSE around the mean response. Data for cortical areas have been replotted from Chen et al. (2011a,b).
How the timing of maximum response modulation (peak time) compares with stimulus velocity peak (1 s, red curve, Fig. 6A) and acceleration/deceleration (0.82/1.18 s; Fig. 6A, green curve) is shown in Figure 6B and C. Vestibular single-peaked responses reached their peak at 1.11 ± 0.033 s (mean ± SE), which is later than peak velocity (1 s, p = 0.002, Wilcoxon rank sum test; Fig. 6B, dark gray bars). These peak times are similar to those of cortical neurons (MSTd: 1.08 ± 0.01 s; PIVC: 0.98 ± 0.03 s; VIP: 1.08 ± 0.02 s; p > 0.13, Wilcoxon rank sum test; Fig. 6D). The average peak time of visual single-peaked Purkinje cell responses was not significantly different than the timing of peak stimulus velocity (1.01 ± 0.033 s; p = 0.41 Wilcoxon rank sum test; Fig. 6B, light gray bars) and these values are similar to MSTd (1.02 ± 0.01 s; p = 0.15, Wilcoxon rank sum test) and VIP (1.07 ± 0.01 s; p = 0.21, Wilcoxon rank sum test).
Vestibular double-peaked cells had early and late response peak times (Fig. 6C, dark filled and open dashed bars) at 0.99 ± 0.034 s and 1.42 ± 0.054 s, respectively, and occurred later than the stimulus acceleration and deceleration peak times (0.82 and 1.18 s, respectively; p < 0.001, Wilcoxon rank sum test). These peak times did not differ from those in MSTd (early and late peak times: 1.03 ± 0.03 and 1.50 ± 0.03 s, respectively; p > 0.27, Wilcoxon rank sum test; Fig. 6E,F), but were longer than in PIVC neurons (0.82 ± 0.02 and 1.25 ± 0.02 s, respectively; p < 0.001, Wilcoxon rank sum test; Fig. 6E,F). Only the early response peak time in Purkinje cells was longer than in VIP neurons (early peak time: 0.85 ± 0.02 s; p = 0.002, Wilcoxon rank sum test; late peak time: 1.38 ± 0.01 s; p = 0.21, Wilcoxon rank sum test). Since only two Purkinje cells were classified as double peaked based on visual responses, no further comparisons are made here.
Spatiotemporal dynamics: model fitting
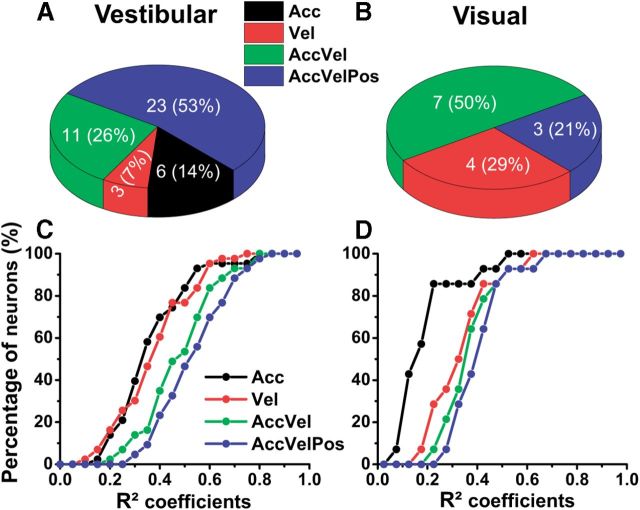
To quantify response dynamics further, four different models, reflecting coding of acceleration (model Acc), velocity (model Vel), acceleration + velocity (model AccVel), or acceleration + velocity + position (model AccVelPos), were fit to the spatiotemporal responses of each neuron (see Materials and Methods; Chen et al., 2011a). For simplicity, each model was fit to 2D data with significant spatiotemporal structure from the horizontal, frontal, and median planes of the stimulus space, as described in Materials and Methods. Forty-three and 14 Purkinje cells met the above criteria for vestibular and visual translation responses, respectively. We report results from the plane with the strongest response modulation for each neuron. Figures 7–10 illustrate example planar cell responses with best fits provided by the Acc, Vel, AccVel, and AccVelPos models, respectively. For the cell in Figure 7 (same cell as in Fig. 2), the acceleration weight (wa = 0.9) calculated from the AccVel model suggests that the acceleration component accounts for 90% of temporal modulation, as illustrated by biphasic responses (Fig. 7B). In contrast, the spatiotemporal responses of the example in Figure 8 were significantly better fit by the Vel model (red) and the velocity component accounted for 92% of the temporal modulation (wv = 0.92). The responses of the Purkinje cell illustrated in Figure 9 were better fit by the AccVel model (green), with wv = 0.52 and wa = 0.48. Adding a position parameter did not significantly improve the fit (AccVel vs AccVelPos, F test, p = 0.11). Finally, the spatiotemporal responses of the example cell in Figure 10 were significantly better fit by the AccVelPos model (blue, wv = 0.51, wa = 0.49, wp = 0.6), as illustrated by the fact that prestimulus and poststimulus firing rate were often different. Figure 11, A and B, summarizes the population results. During vestibular translation, 7% of NU Purkinje cells (3/43) were better fit by the Vel model, 14% (6/43) by the Acc model, 26% (11/43) by the AccVel model, and 53% (23/43) by the AccVelPos model (Fig. 11A). Thus, similarly to MSTd (Chen et al., 2011a), most NU Purkinje cells carry information about linear displacement, in addition to linear velocity and acceleration.
Figure 11.
Population summary of curve-fitting analysis in cerebellar NU for vestibular (left) and visual (right) responses. A, B, Percentage of Purkinje cells according to the best-fit model (Acc, Vel, AccVel, AccVelPos) for vestibular (A) and visual (B) responses. C, D, Cumulative distribution of fit model coefficients (r2) for vestibular (C) and visual (D) responses.
During visual stimulation, 29% (4/14) of NU Purkinje cells were best fit by the Vel model, 50% (7/14) by the AccVel model, and 21% (3/14) by the AccVelPos model. In contrast, no cell was best fit by the Acc model (Fig. 11B). Note that the percentage of visually driven neurons best fit by the Vel model was higher in cortical areas (VIP = 58%, MSTd = 67%) than in cerebellar NU (see Discussion). As expected, most double-peaked cells were better fit by the Acc or AccVel model, while most of the single-peaked cells were better fit by the Vel, AccVel, or AccVelPos model (Table 1). There was no systematic relationship between model fit and vestibular/visual congruency. Figure 11, C and D, illustrates the cumulative distribution of the correlation coefficients (r2) for all model fits. During vestibular translation the Acc and Vel model fits had similar r2 (Fig. 11C, black and red symbols/lines; p = 0.21, Wilcoxon signed rank test), but during visual translation the Vel model had substantially larger r2 than the Acc model (Fig. 11D, black vs red; p < 0.001, Wilcoxon signed rank test). AccVel and AccVelPos models significantly improved the fits for both the vestibular and visual responses (Fig. 11C,D, green and blue; p < 0.001, Wilcoxon signed rank test). Only Purkinje cells with r2 > 0.45 for the best-fit model (n = 39 for vestibular and n = 11 for visual responses) were further analyzed and compared with cortical areas, as described next.
Table 1.
Best model-fitting and type of Purkinje cell responses to visual and vestibular translation
| Vel model | Acc model | AccVel model | AccVelPos model | |
|---|---|---|---|---|
| Vestibular | Exc single-peaked | Exc single-peaked | Exc single-peaked | |
| N = 2 | N = 7 | N = 21 | ||
| Inh single-peaked | Exc double-peaked | Exc double-peaked | Exc double-peaked | |
| N = 1 | N = 6 | N = 4 | N = 2 | |
| Visual | Exc single-peaked | N/A | Exc single-peaked | Exc single-peaked |
| N = 2 | N = 5 | N = 3 | ||
| Inh single-peaked | Exc double-peaked | Exc double-peaked | ||
| N = 2 | N = 1 | N = 1 |
The majority of double-peaked cells were better fit with Acc or AccVel models, whereas single-peaked cells were mainly better fit by AccVelPos model. Exc, excitatory; Inh, inhibitory.
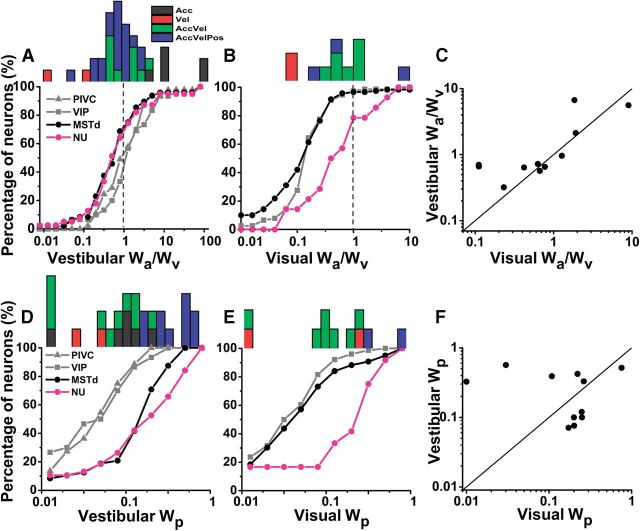
The contribution of velocity, acceleration, and position components to NU Purkinje cell responses (defined by their respective weights: wa, wv, and wp) are summarized in Figure 12). The fact that most (70%, 30/39) cells had vestibular wa/wv ratios smaller than 1 (geometric mean ± SE, 0.69 ± 0.05) indicates a larger contribution of velocity than acceleration to vestibular responses in the NU (Fig. 12A; marginal distribution). Remarkably, wa/wv ratios for NU Purkinje cells were similar to MSTd neurons (0.7 ± 0.72; p = 0.5, Wilcoxon rank sum test), but smaller than PIVC and VIP neurons (1.57 ± 0.72 and 1.59 ± 0.86, respectively; p < 0.001, Wilcoxon rank sum test).
Figure 12.
Summary of model weights. Comparison of weights (wa, wv, wp) calculated from best-fit model for NU and PIVC, VIP, and MSTd. A, B, Cumulative distributions of the ratio of acceleration to velocity weights (wa/wv) from model AccVel during vestibular (NU, n = 39; PIVC, n = 45; VIP, n = 30; MSTd, n = 48) and visual (NU, n = 11; VIP, n = 76; MSTd, n = 119) stimuli. Histograms along the top show the distributions of vestibular and visual weight ratios (wa/wv) for NU Purkinje cells, color coded according to the best model fit. C, Comparison of vestibular and visual weight ratios (wa/wv) for multisensory Purkinje cells (n = 11). D, E, Cumulative distributions of the position weights (wp) from model AccVelPos during vestibular (NU, n = 39; PIVC, n = 45; VIP, n = 30; MSTd, n = 48) and visual (NU, n = 11; VIP, n = 76; MSTd, n = 119) stimuli. Histograms along the top show the distributions of vestibular and visual position weights for NU Purkinje cells, color coded according to the best model fit. F, Comparison of vestibular and visual position weights (wp) for multisensory Purkinje cells (n = 11). Data for cortical areas have been replotted from Chen et al. (2011a,b).
The visual wa/wv ratio for Purkinje cells (0.70 ± 0.5; Fig. 12B; marginal distribution) was larger than in VIP (0.22 ± 0.32, p < 0.001, Wilcoxon rank sum test) and MSTd (0.17 ± 0.42, p < 0.001, Wilcoxon rank sum test). Furthermore, wa/wv ratios were similar for visual and vestibular responses in the NU (p = 0.24, Wilcoxon rank sum test), as also shown in the scatter plot of Figure 12C for multisensory cells (type II regression: r = 0.7, p = 0.01, slope = 0.82, 95% confidence interval: [0.63, 1.01]). Thus, acceleration visual responses were more prominent in the NU than in cortical areas, perhaps to match the vestibular response dynamics. Remarkably, vestibular acceleration and velocity contributions in the NU matched at the population level those previously reported for area MSTd (Chen et al., 2011a). The similarities in vestibular dynamics between NU and MSTd also extended to the position contribution: the position weight, wp, for NU (0.15 ± 0.42) was similar to that for MSTd (0.14 ± 0.41, p = 0.6, Wilcoxon rank sum test), but significantly greater than that for PIVC and VIP (0.04 ± 0.55 and 0.05 ± 0.55, respectively, p < 0.001, Wilcoxon rank sum test; Fig. 12D). In contrast, the visual position weight of NU Purkinje cells was substantially greater than that of MSTd and VIP neurons (NU: 0.15 ± 0.41; MSTd: 0.05 ± 0.31; VIP: 0.04 ± 0.31; p < 0.001, Wilcoxon rank sum test; Fig. 12E). Although there was no significant correlation between vestibular wp and visual wp on a cell-by-cell basis for multisensory Purkinje cells (type II regression, p = 0.19; Fig. 12F), the average vestibular wp (0.2 ± 0.31) was not significantly different from the average visual wp (0.15 ± 0.42; p = 0.7, Wilcoxon signed rank sum test). These findings suggest strong similarities in vestibular spatiotemporal response properties between NU and MSTd. In contrast, the visual spatiotemporal properties of NU Purkinje cells differed from MSTd neurons and were instead similar as the vestibular responses in the NU.
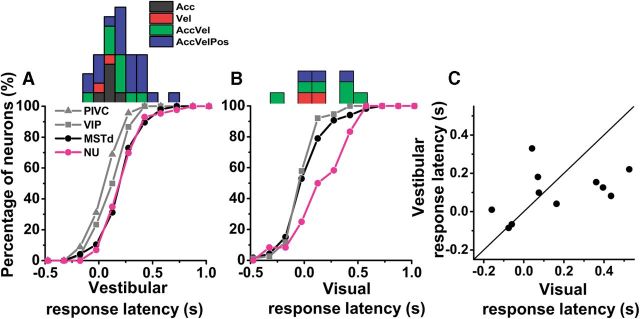
The model-fitting analysis also allowed estimation of response latency that, unlike response peak time, was independent of dynamics. Figure 13, A and B, illustrates the distributions of the response latency of NU Purkinje cells calculated from the best-fit model. Purkinje cells with responses best fit by Acc and Vel models had smaller vestibular response latencies (mean ± SE; 109 ± 4 and 102 ± 10 ms) than those with responses best fitted by AccVel (179 ± 4 ms) and AccVelPos models (244 ± 4 ms) (p < 0.001, Wilcoxon rank sum test; Fig. 13A). No such difference was seen for visual responses (Fig. 13B).
Figure 13.
Summary of response latency obtained from the best-fit model. A, B, Cumulative distributions of response latency for vestibular (NU, n = 39; PIVC, n = 45; VIP, n = 30, MSTd, n = 48) and visual (NU, n = 11; VIP, n = 76, MSTd, n = 119) stimuli. Marginal histograms on top show the distributions of vestibular and visual response latencies for NU Purkinje cells, color coded according to the best model fit. C, Comparison of vestibular and visual response latency for multisensory Purkinje cells (n = 11). Solid line illustrates the diagonal.
The average vestibular response latency of all NU Purkinje cells (188 ± 18 ms) was similar to that of MSTd neurons (193 ± 26 ms, p = 0.24, Wilcoxon rank sum test) but larger than the latency of PIVC and VIP neurons (65 ± 26 ms and 112 ± 26 ms, respectively, p < 0.001, Wilcoxon rank sum test), as illustrated by the cumulative distributions in Figure 13A. The visual response latency (169 ± 26 ms) was significantly longer compared with MSTd and VIP neurons (77 ± 19 and 48 ± 18 ms, respectively, p < 0.001, Wilcoxon rank sum test; Fig. 13B), but similar to the vestibular latency (p = 0.16; Wilcoxon rank sum test). Furthermore, there was a significant correlation between visual and vestibular response latency for multisensory Purkinje cells in the NU (Fig. 13C; type II regression: r = 0.63, p = 0.03, slope = 0.57, 95% confidence interval: [0.54, 0.81]). Thus, both response dynamics and latency measurements reveal a remarkable similarity between NU and MSTd vestibular responses. In contrast, the NU optic flow responses match the vestibular properties and differ strongly from MSTd visual response properties. However, given the small number of visually tuned cells in the NU, the latter comparisons must be interpreted cautiously.
Discussion
The major goals of this study were to quantify the responses of NU Purkinje cells during 3D transient vestibular and visual stimulation (optic flow), and to compare these responses to those already described in cortical areas (PIVC, VIP, and MSTd). We found that most Purkinje cells responded to vestibular translation, whereas fewer (27%) responded to visual translation. Visual responses were in general weaker in the NU than in cortical areas, although we did find strong visual responses in medial and anterior parts of the NU. Remarkably, NU vestibular responses showed striking similarities to MSTd, but not PIVC or VIP neurons. Peak times and response latencies, as well as the relative contributions of velocity, acceleration, and position signals, were similar to those in MSTd neurons. Multisensory Purkinje cells in the NU could have either congruent or opposite preferred directions as was also shown previously in cortical areas MSTd and VIP (Gu et al., 2006; Chen et al., 2011b). However, unlike cortical neurons, the distribution of 3D preferred direction differences of Purkinje cells was not bimodal. Since this could easily be the result of the small number of visually tuned Purkinje cells, this result must be interpreted cautiously. Furthermore, unlike MSTd (Chen et al., 2011b), the visual and vestibular responses of multisensory Purkinje cells had similar acceleration and velocity contributions. This match in temporal response properties may play a role for long-term plasticity in the spatial orientation properties of the NU (Waespe et al., 1985; Angelaki and Hess, 1995; Wearne et al., 1998; Pettorossi et al., 2001; Cohen et al., 2002; Yakusheva et al., 2007, 2008). Next we discuss further these observations in relationship to potential roles of the NU in multisensory visual/vestibular processing.
Vestibular responses of NU Purkinje cells
The transient stimuli used here are better suited than sinusoidal stimuli to characterize response dynamics because position, velocity, and acceleration signals can be temporally dissociated. Thus, a major goal for these experiments was to extend the sinusoidal analysis of Yakusheva et al. (2008) by showing that NU Purkinje cells carry information about all three components: linear acceleration, velocity, and displacement (position) signals. Given the particular stimulus profile used, sensitivity to linear velocity appears as a single peak in the cell's spatiotemporal response profile (Fig. 1), whereas sensitivity to linear acceleration is manifested as double peaks in the 3D response tuning (Fig. 2). Because the NU receives direct otolith afferent inputs (Kevetter and Perachio, 1986; Maklad and Fritzsch, 2003; Newlands et al., 2003), which carry linear acceleration signals, one might have expected that most Purkinje cells should exhibit double-peaked responses to vestibular translation. Instead we found that most NU Purkinje cells showed single-peaked, velocity-like responses, whereas only a quarter exhibited double-peaked modulation. In fact, such velocity-dominated responsiveness has also been found in MSTd (Gu et al., 2006; Fetsch et al., 2010; Chen et al., 2011a,b), but not in PIVC (Chen et al., 2010, 2011a). These results provide strong evidence that the NU plays key role in the temporal transformation of otolith signals (Yakusheva et al., 2007, 2008; Walker et al., 2008, 2010).
Similarly to MSTd neurons, about half of the Purkinje cells carried a position (i.e., linear displacement) signal. This signal could be important for postural control and/or autonomic functions. For instance, areas of the vestibular and fastigial nuclei that receive inputs from the NU are known to project to the spinal cord and thought to play a critical role for postural control (Peterson et al., 1981; Dietrichs, 1983; Wilson et al., 1990; Wylie et al., 1994; Xiong and Matsushita, 2000; Kleine et al., 2004; Shaikh et al., 2004). In addition, the NU is involved in cardiovascular and respiratory functions (Bradley et al., 1987; Henry et al., 1989; Sadakane et al., 2000; Holmes et al., 2002; Barman and Gebber, 2009). Moreover, the position signal carried by Purkinje cells could be of great importance for providing a source of idiothetic cues to other brain structures involved in spatial navigation (Sharp et al., 1995; Jeffery et al., 1997; Stackman and Taube, 1997). Indeed, cerebellar protein kinase C-dependent plasticity is necessary for proper spatial navigation (Burguière et al., 2010; Rochefort et al., 2011; Passot et al., 2012), suggesting a functional link between the cerebellum and forebrain navigation areas (Rochefort et al., 2013). Although no direct connectivity has been established between the NU and hippocampus, they could be indirectly connected via the cerebellar nuclei (Heath and Harper, 1974; Newman and Reza, 1979; Angaut et al., 1985; Aumann et al., 1994).
Response latencies of Purkinje cells estimated by model fits were similar to those of MSTd neurons, but longer than PIVC and VIP neurons (Chen et al., 2011a,b). This finding is rather surprising given that the NU receives direct vestibular afferent inputs (Carpenter et al., 1972; Kevetter and Perachio, 1986; Gerrits et al., 1989; Maklad and Fritzsch, 2003; Newlands et al., 2003). These long latencies might be due to the extensive computational processing needed to transform net gravito-inertial acceleration into inertial information (Angelaki et al., 1999; Green and Angelaki, 2004, 2007, 2010; Laurens and Angelaki, 2011). One of the major differences between the NU and cortical vestibular responses was the lower tuning strength of Purkinje cells, as measured with the DDI (Fig. 5A). The lower DDI is due to higher response variability (Fig. 5E), despite similar response magnitude for Purkinje versus cortical cells (Yakusheva et al., 2007, 2008; Liu and Angelaki, 2009; Liu et al., 2011; Fig. 5C).
The remarkable similarities in the spatiotemporal properties of NU and MSTd neurons, in terms of both latency and response dynamics, raise the question of whether these two areas are interconnected by corticocerebellar pathways as recently shown for other areas of the cerebellum and cortex (Strick et al., 2009). MSTd projections to the NU could involve the pontine nuclei (Wiesendanger et al., 1979; Brodal and Bjaalie, 1992; Akaogi et al., 1994; Glickstein et al., 1994). Alternatively, the observed similarities could reflect parallel computations performed in the cerebellar and cerebral cortical areas independently.
Optic flow responses of NU Purkinje cells
Previous neurophysiological studies had shown optokinetic responses in NU Purkinje cells of anesthetized nonprimate species (Precht et al., 1976; Kano et al., 1990, 1991a, b; Wylie et al., 1991, 1993, 1999; Barmack, 2003) and such responses have also been demonstrated in the macaque dorsal uvula (Heinen and Keller, 1992, 1996). Here we found responses of macaque NU Purkinje cells to translational but not rotational optic flow. Visually driven Purkinje cells tend to cluster in the anterior part of the NU near the midline (Fig. 3), where visual DDIs could be as strong as vestibular DDIs (Fig. 4). Based on our previous histological reconstruction of recording locations in the macaque NU (Yakusheva et al., 2007, 2008) most visually driven Purkinje cells are likely located within the medial nodulus. Functional differences between the medial and lateral NU have been noted previously. For example, the medial part in the NU controls the vertical/roll time constants, whereas lateral portion of the NU modulate the horizontal vestibular and optokinetic time constants (Wearne et al., 1998).
Visual signals in the nodulus might arise through projections from the vestibular and/or prepositus hypoglossi (PH) nuclei (Rubertone and Haines, 1981; Brodal and Brodal, 1985; Sato et al., 1989; Thunnissen et al., 1989; Epema et al., 1990; Barmack et al., 1993; Voogd et al., 1996; Ruigrok, 2003; Pakan et al., 2008). Although vestibular mossy fibers project to the nodulus without clear mediolateral preference (Akaogi et al., 1994), the PH project to an area 0.5–1 mm lateral to the midline (Belknap and McCrea, 1988). The vestibular, PH, and pontine nuclei receive direct projections from the optic tract and accessory optic system nuclei, which are directly innervated by afferents from MST (Mustari et al., 1994; Kato et al., 1995; Büttner-Ennever et al., 1996; Gamlin, 2006; Giolli et al., 2006). Optokinetic modulation has been reported in the PH (Lannou et al., 1984) and vestibular nuclei (Waespe and Henn, 1977; Keller and Precht, 1979; Cazin et al., 1980; Boyle et al., 1985), although responses were reduced during fixation (Bryan and Angelaki, 2009). However, whether or not vestibular and PH nuclei respond to optic flow remains unknown.
Finally, the NU also receives visual information through climbing fibers originating in the dorsal cap and ventrolateral outgrowth (Takeda and Maekawa, 1984; Voogd et al., 2012). In this study we have not characterized complex spike modulation during optic flow because this would necessitate a considerable larger amount of trials than was available. However, NU complex spikes modulate during translational optic flow in pigeons (Wylie et al., 1991, 1999) and during optokinetic stimulation in rabbits and cats (Precht et al., 1976; Kano et al., 1990; Barmack and Shojaku, 1995; Barmack, 2003). Climbing fibers could carry an error signal necessary to calibrate motion processing in the NU and future experiments will address this hypothesis.
Footnotes
This work was supported by National Institutes of Health grants R01-EY12814 and R03-DC011142.
References
- Akaogi K, Sato Y, Ikarashi K, Kawasaki T. Mossy fiber projections from the brain stem to the nodulus in the cat. An experimental study comparing the nodulus, the uvula and the flocculus. Brain Res. 1994;638:12–20. doi: 10.1016/0006-8993(94)90627-0. [DOI] [PubMed] [Google Scholar]
- Angaut P, Cicirata F, Serapide F. Topographic organization of the cerebellothalamic projections in the rat. An autoradiographic study. Neuroscience. 1985;15:389–401. doi: 10.1016/0306-4522(85)90221-0. [DOI] [PubMed] [Google Scholar]
- Angelaki DE, Hess BJ. Lesion of the nodulus and ventral uvula abolish steady-state off-vertical axis otolith response. J Neurophysiol. 1995;73:1716–1720. doi: 10.1152/jn.1995.73.4.1716. [DOI] [PubMed] [Google Scholar]
- Angelaki DE, McHenry MQ, Dickman JD, Newlands SD, Hess BJ. Computation of inertial motion: neural strategies to resolve ambiguous otolith information. J Neurosci. 1999;19:316–327. doi: 10.1523/JNEUROSCI.19-01-00316.1999. [DOI] [PMC free article] [PubMed] [Google Scholar]
- Angelaki DE, Shaikh AG, Green AM, Dickman JD. Neurons compute internal models of the physical laws of motion. Nature. 2004;430:560–564. doi: 10.1038/nature02754. [DOI] [PubMed] [Google Scholar]
- Aumann TD, Rawson JA, Finkelstein DI, Horne MK. Projections from the lateral and interposed cerebellar nuclei to the thalamus of the rat: a light and electron microscopic study using single and double anterograde labelling. J Comp Neurol. 1994;349:165–181. doi: 10.1002/cne.903490202. [DOI] [PubMed] [Google Scholar]
- Barmack NH. Central vestibular system: vestibular nuclei and posterior cerebellum. Brain Res Bull. 2003;60:511–541. doi: 10.1016/S0361-9230(03)00055-8. [DOI] [PubMed] [Google Scholar]
- Barmack NH, Shojaku H. Vestibular and visual climbing fiber signals evoked in the uvula-nodulus of the rabbit cerebellum by natural stimulation. J Neurophysiol. 1995;74:2573–2589. doi: 10.1152/jn.1995.74.6.2573. [DOI] [PubMed] [Google Scholar]
- Barmack NH, Baughman RW, Errico P, Shojaku H. Vestibular primary afferent projection to the cerebellum of the rabbit. J Comp Neurol. 1993;327:521–534. doi: 10.1002/cne.903270405. [DOI] [PubMed] [Google Scholar]
- Barman SM, Gebber GL. The posterior vermis of the cerebellum selectively inhibits 10-Hz sympathetic nerve discharge in anesthetized cats. Am J Physiol Regul Integr Comp Physiol. 2009;297:R210–R217. doi: 10.1152/ajpregu.90989.2008. [DOI] [PMC free article] [PubMed] [Google Scholar]
- Belknap DB, McCrea RA. Anatomical connections of the prepositus and abducens nuclei in the squirrel monkey. J Comp Neurol. 1988;268:13–28. doi: 10.1002/cne.902680103. [DOI] [PubMed] [Google Scholar]
- Bernard JF. Topographical organization of olivocerebellar and corticonuclear connections in the rat–an WGA-HRP study: I. Lobules IX, X, and the flocculus. J Comp Neurol. 1987;263:241–258. doi: 10.1002/cne.902630207. [DOI] [PubMed] [Google Scholar]
- Boyle R, Büttner U, Markert G. Vestibular nuclei activity and eye movements in the alert monkey during sinusoidal optokinetic stimulation. Exp Brain Res. 1985;57:362–369. doi: 10.1007/BF00236542. [DOI] [PubMed] [Google Scholar]
- Bradley DJ, Pascoe JP, Paton JF, Spyer KM. Cardiovascular and respiratory responses evoked from the posterior cerebellar cortex and fastigial nucleus in the cat. J Physiol. 1987;393:107–121. doi: 10.1113/jphysiol.1987.sp016813. [DOI] [PMC free article] [PubMed] [Google Scholar]
- Brodal A. The olivocerebellar projection in the cat as studied with the method of retrograde axonal transport of horseradish peroxidase. II. The projection to the uvula. J Comp Neurol. 1976;166:417–426. doi: 10.1002/cne.901660404. [DOI] [PubMed] [Google Scholar]
- Brodal A, Brodal P. Observations on the secondary vestibulocerebellar projections in the macaque monkey. Exp Brain Res. 1985;58:62–74. doi: 10.1007/BF00238954. [DOI] [PubMed] [Google Scholar]
- Brodal P, Bjaalie JG. Organization of the pontine nuclei. Neurosci Res. 1992;13:83–118. doi: 10.1016/0168-0102(92)90092-Q. [DOI] [PubMed] [Google Scholar]
- Bryan AS, Angelaki DE. Optokinetic and vestibular responsiveness in the macaque rostral vestibular and fastigial nuclei. J Neurophysiol. 2009;101:714–720. doi: 10.1152/jn.90612.2008. [DOI] [PMC free article] [PubMed] [Google Scholar]
- Burguière E, Arabo A, Jarlier F, De Zeeuw CI, Rondi-Reig L. Role of the cerebellar cortex in conditioned goal-directed behavior. J Neurosci. 2010;30:13265–13271. doi: 10.1523/JNEUROSCI.2190-10.2010. [DOI] [PMC free article] [PubMed] [Google Scholar]
- Büttner-Ennever JA, Cohen B, Horn AK, Reisine H. Efferent pathways of the nucleus of the optic tract in monkey and their role in eye movements. J Comp Neurol. 1996;373:90–107. doi: 10.1002/(SICI)1096-9861(19960909)373:1<90::AID-CNE8>3.0.CO%3B2-8. [DOI] [PubMed] [Google Scholar]
- Carpenter MB, Stein BM, Peter P. Primary vestibulocerebellar fibers in the monkey: distribution of fibers arising from distinctive cell groups of the vestibular ganglia. Am J Anat. 1972;135:221–249. doi: 10.1002/aja.1001350209. [DOI] [PubMed] [Google Scholar]
- Cazin L, Precht W, Lannou J. Optokinetic responses of vestibular nucleus neurons in the rat. Pflugers Arch. 1980;384:31–38. doi: 10.1007/BF00589511. [DOI] [PubMed] [Google Scholar]
- Chen A, DeAngelis GC, Angelaki DE. Macaque parieto-insular vestibular cortex: responses to self-motion and optic flow. J Neurosci. 2010;30:3022–3042. doi: 10.1523/JNEUROSCI.4029-09.2010. [DOI] [PMC free article] [PubMed] [Google Scholar]
- Chen A, DeAngelis GC, Angelaki DE. A comparison of vestibular spatiotemporal tuning in macaque parietoinsular vestibular cortex, ventral intraparietal area, and medial superior temporal area. J Neurosci. 2011a;31:3082–3094. doi: 10.1523/JNEUROSCI.4476-10.2011. [DOI] [PMC free article] [PubMed] [Google Scholar]
- Chen A, DeAngelis GC, Angelaki DE. Representation of vestibular and visual cues to self-motion in ventral intraparietal cortex. J Neurosci. 2011b;31:12036–12052. doi: 10.1523/JNEUROSCI.0395-11.2011. [DOI] [PMC free article] [PubMed] [Google Scholar]
- Chen A, DeAngelis GC, Angelaki DE. Convergence of vestibular and visual self-motion signals in an area of the posterior sylvian fissure. J Neurosci. 2011c;31:11617–11627. doi: 10.1523/JNEUROSCI.1266-11.2011. [DOI] [PMC free article] [PubMed] [Google Scholar]
- Cohen B, John P, Yakushin SB, Buettner-Ennever J, Raphan T. The nodulus and uvula: source of cerebellar control of spatial orientation of the angular vestibulo-ocular reflex. Ann N Y Acad Sci. 2002;978:28–45. doi: 10.1111/j.1749-6632.2002.tb07553.x. [DOI] [PubMed] [Google Scholar]
- Dieterich M, Bucher SF, Seelos KC, Brandt T. Cerebellar activation during optokinetic stimulation and saccades. Neurology. 2000;54:148–155. doi: 10.1212/WNL.54.1.148. [DOI] [PubMed] [Google Scholar]
- Dietrichs E. The cerebellar corticonuclear and nucleocortical projections in the cat as studied with anterograde and retrograde transport of horseradish peroxidase. V. The posterior lobe vermis and the flocculo-nodular lobe. Anat Embryol. 1983;167:449–462. doi: 10.1007/BF00315681. [DOI] [PubMed] [Google Scholar]
- Duffy CJ. MST neurons respond to optic flow and translational movement. J Neurophysiol. 1998;80:1816–1827. doi: 10.1152/jn.1998.80.4.1816. [DOI] [PubMed] [Google Scholar]
- Epema AH, Gerrits NM, Voogd J. Secondary vestibulocerebellar projections to the flocculus and uvulo-nodular lobule of the rabbit: a study using HRP and double fluorescent tracer techniques. Exp Brain Res. 1990;80:72–82. doi: 10.1007/BF00228849. [DOI] [PubMed] [Google Scholar]
- Fetsch CR, Rajguru SM, Karunaratne A, Gu Y, Angelaki DE, Deangelis GC. Spatiotemporal properties of vestibular responses in area MSTd. J Neurophysiol. 2010;104:1506–1522. doi: 10.1152/jn.91247.2008. [DOI] [PMC free article] [PubMed] [Google Scholar]
- Gamlin PD. The pretectum: connections and oculomotor-related roles. Prog Brain Res. 2006;151:379–405. doi: 10.1016/S0079-6123(05)51012-4. [DOI] [PubMed] [Google Scholar]
- Gerrits NM, Epema AH, van Linge A, Dalm E. The primary vestibulocerebellar projection in the rabbit: absence of primary afferents in the flocculus. Neurosci Lett. 1989;105:27–33. doi: 10.1016/0304-3940(89)90006-2. [DOI] [PubMed] [Google Scholar]
- Giolli RA, Blanks RH, Lui F. The accessory optic system: basic organization with an update on connectivity, neurochemistry, and function. Prog Brain Res. 2006;151:407–440. doi: 10.1016/S0079-6123(05)51013-6. [DOI] [PubMed] [Google Scholar]
- Glickstein M, Gerrits N, Kralj-Hans I, Mercier B, Stein J, Voogd J. Visual pontocerebellar projections in the macaque. J Comp Neurol. 1994;349:51–72. doi: 10.1002/cne.903490105. [DOI] [PubMed] [Google Scholar]
- Green AM, Angelaki DE. An integrative neural network for detecting inertial motion and head orientation. J Neurophysiol. 2004;92:905–925. doi: 10.1152/jn.01234.2003. [DOI] [PubMed] [Google Scholar]
- Green AM, Angelaki DE. Coordinate transformations and sensory integration in the detection of spatial orientation and self-motion: from models to experiments. Prog Brain Res. 2007;165:155–180. doi: 10.1016/S0079-6123(06)65010-3. [DOI] [PubMed] [Google Scholar]
- Green AM, Angelaki DE. Internal models and neural computation in the vestibular system. Exp Brain Res. 2010;200:197–222. doi: 10.1007/s00221-009-2054-4. [DOI] [PMC free article] [PubMed] [Google Scholar]
- Gu Y, Watkins PV, Angelaki DE, DeAngelis GC. Visual and nonvisual contributions to three-dimensional heading selectivity in the medial superior temporal area. J Neurosci. 2006;26:73–85. doi: 10.1523/JNEUROSCI.2356-05.2006. [DOI] [PMC free article] [PubMed] [Google Scholar]
- Gu Y, Fetsch CR, Adeyemo B, Deangelis GC, Angelaki DE. Decoding of MSTd population activity accounts for variations in the precision of heading perception. Neuron. 2010;66:596–609. doi: 10.1016/j.neuron.2010.04.026. [DOI] [PMC free article] [PubMed] [Google Scholar]
- Heath RG, Harper JW. Ascending projections of the cerebellar fastigial nucleus to the hippocampus, amygdala, and other temporal lobe sites: evoked potential and histological studies in monkeys and cats. Exp Neurol. 1974;45:268–287. doi: 10.1016/0014-4886(74)90118-6. [DOI] [PubMed] [Google Scholar]
- Heinen SJ, Keller EL. Cerebellar uvula involvement in visual motion processing and smooth pursuit control in monkey. Ann N Y Acad Sci. 1992;656:775–782. doi: 10.1111/j.1749-6632.1992.tb25256.x. [DOI] [PubMed] [Google Scholar]
- Heinen SJ, Keller EL. The function of the cerebellar uvula in monkey during optokinetic and pursuit eye movements: single-unit responses and lesion effects. Exp Brain Res. 1996;110:1–14. doi: 10.1007/BF00241368. [DOI] [PubMed] [Google Scholar]
- Henry RT, Connor JD, Balaban CD. Nodulus-uvula depressor response: central GABA-mediated inhibition of alpha-adrenergic outflow. Am J Physiol. 1989;256:H1601–1608. doi: 10.1152/ajpheart.1989.256.6.H1601. [DOI] [PubMed] [Google Scholar]
- Hoddevik GH, Brodal A. The olivocerebellar projection studied with the method of retrograde axonal transport of horseradish peroxidase. V. The projections to the flocculonodular lobe and the paraflocculus in the rabbit. J Comp Neurol. 1977;176:269–280. doi: 10.1002/cne.901760208. [DOI] [PubMed] [Google Scholar]
- Holmes MJ, Cotter LA, Arendt HE, Cass SP, Yates BJ. Effects of lesions of the caudal cerebellar vermis on cardiovascular regulation in awake cats. Brain Res. 2002;938:62–72. doi: 10.1016/S0006-8993(02)02495-2. [DOI] [PubMed] [Google Scholar]
- Jeffery KJ, Donnett JG, Burgess N, O'Keefe JM. Directional control of hippocampal place fields. Exp Brain Res. 1997;117:131–142. doi: 10.1007/s002210050206. [DOI] [PubMed] [Google Scholar]
- Kano MS, Kano M, Maekawa K. Receptive field organization of climbing fiber afferents responding to optokinetic stimulation in the cerebellar nodulus and flocculus of the pigmented rabbit. Exp Brain Res. 1990;82:499–512. doi: 10.1016/S0079-6123(08)62640-0. [DOI] [PubMed] [Google Scholar]
- Kano M, Kano MS, Maekawa K. Optokinetic response of simple spikes of Purkinje cells in the cerebellar flocculus and nodulus of the pigmented rabbit. Exp Brain Res. 1991a;87:484–496. doi: 10.1007/BF00227074. [DOI] [PubMed] [Google Scholar]
- Kano M, Kano MS, Maekawa K. Simple spike modulation of Purkinje cells in the cerebellar nodulus of the pigmented rabbit to optokinetic stimulation. Neurosci Lett. 1991b;128:101–104. doi: 10.1016/0304-3940(91)90769-P. [DOI] [PubMed] [Google Scholar]
- Kato I, Watanabe S, Sato S, Norita M. Pretectofugal fibers from the nucleus of the optic tract in monkeys. Brain Res. 1995;705:109–117. doi: 10.1016/0006-8993(95)01145-5. [DOI] [PubMed] [Google Scholar]
- Keller EL, Precht W. Visual-vestibular responses in vestibular nuclear neurons in the intact and cerebellectomized, alert cat. Neuroscience. 1979;4:1599–1613. doi: 10.1016/0306-4522(79)90023-X. [DOI] [PubMed] [Google Scholar]
- Kevetter GA, Perachio AA. Distribution of vestibular afferents that innervate the sacculus and posterior canal in the gerbil. J Comp Neurol. 1986;254:410–424. doi: 10.1002/cne.902540312. [DOI] [PubMed] [Google Scholar]
- Kevetter GA, Leonard RB, Newlands SD, Perachio AA. Central distribution of vestibular afferents that innervate the anterior or lateral semicircular canal in the Mongolian gerbil. J Vestib Res. 2004;14:1–15. [PubMed] [Google Scholar]
- Kleine JF, Guan Y, Kipiani E, Glonti L, Hoshi M, Büttner U. Trunk position influences vestibular responses of fastigial nucleus neurons in the alert monkey. J Neurophysiol. 2004;91:2090–2100. doi: 10.1152/jn.00849.2003. [DOI] [PubMed] [Google Scholar]
- Kleinschmidt A, Thilo KV, Büchel C, Gresty MA, Bronstein AM, Frackowiak RS. Neural correlates of visual-motion perception as object- or self-motion. Neuroimage. 2002;16:873–882. doi: 10.1006/nimg.2002.1181. [DOI] [PubMed] [Google Scholar]
- Korte GE, Mugnaini E. The cerebellar projection of the vestibular nerve in the cat. J Comp Neurol. 1979;184:265–277. doi: 10.1002/cne.901840204. [DOI] [PubMed] [Google Scholar]
- Lannou J, Cazin L, Precht W, Le Taillanter M. Responses of prepositus hypoglossi neurons to optokinetic and vestibular stimulations in the rat. Brain Res. 1984;301:39–45. doi: 10.1016/0006-8993(84)90400-1. [DOI] [PubMed] [Google Scholar]
- Laurens J, Angelaki DE. The functional significance of velocity storage and its dependence on gravity. Exp Brain Res. 2011;210:407–422. doi: 10.1007/s00221-011-2568-4. [DOI] [PMC free article] [PubMed] [Google Scholar]
- Liu S, Angelaki DE. Vestibular signals in macaque extrastriate visual cortex are functionally appropriate for heading perception. J Neurosci. 2009;29:8936–8945. doi: 10.1523/JNEUROSCI.1607-09.2009. [DOI] [PMC free article] [PubMed] [Google Scholar]
- Liu S, Dickman JD, Angelaki DE. Response dynamics and tilt versus translation discrimination in parietoinsular vestibular cortex. Cereb Cortex. 2011;21:563–573. doi: 10.1093/cercor/bhq123. [DOI] [PMC free article] [PubMed] [Google Scholar]
- Maklad A, Fritzsch B. Partial segregation of posterior crista and saccular fibers to the nodulus and uvula of the cerebellum in mice, and its development. Brain Res Dev Brain Res. 2003;140:223–236. doi: 10.1016/S0165-3806(02)00609-0. [DOI] [PubMed] [Google Scholar]
- Meng H, Angelaki DE. Responses of ventral posterior thalamus neurons to three-dimensional vestibular and optic flow stimulation. J Neurophysiol. 2010;103:817–826. doi: 10.1152/jn.00729.2009. [DOI] [PMC free article] [PubMed] [Google Scholar]
- Mustari MJ, Fuchs AF, Kaneko CR, Robinson FR. Anatomical connections of the primate pretectal nucleus of the optic tract. J Comp Neurol. 1994;349:111–128. doi: 10.1002/cne.903490108. [DOI] [PubMed] [Google Scholar]
- Newlands SD, Vrabec JT, Purcell IM, Stewart CM, Zimmerman BE, Perachio AA. Central projections of the saccular and utricular nerves in macaques. J Comp Neurol. 2003;466:31–47. doi: 10.1002/cne.10876. [DOI] [PubMed] [Google Scholar]
- Newman PP, Reza H. Functional relationships between the hippocampus and the cerebellum: an electrophysiological study of the cat. J Physiol. 1979;287:405–426. doi: 10.1113/jphysiol.1979.sp012667. [DOI] [PMC free article] [PubMed] [Google Scholar]
- Ono S, Kushiro K, Zakir M, Meng H, Sato H, Uchino Y. Properties of utricular and saccular nerve-activated vestibulocerebellar neurons in cats. Exp Brain Res. 2000;134:1–8. doi: 10.1007/s002210000424. [DOI] [PubMed] [Google Scholar]
- Pakan JM, Graham DJ, Iwaniuk AN, Wylie DR. Differential projections from the vestibular nuclei to the flocculus and uvula-nodulus in pigeons (Columba livia) J Comp Neurol. 2008;508:402–417. doi: 10.1002/cne.21623. [DOI] [PubMed] [Google Scholar]
- Passot JB, Sheynikhovich D, Duvelle É, Arleo A. Contribution of cerebellar sensorimotor adaptation to hippocampal spatial memory. PLoS One. 2012;7:e32560. doi: 10.1371/journal.pone.0032560. [DOI] [PMC free article] [PubMed] [Google Scholar]
- Peterson BW, Bilotto G, Goldberg J, Wilson VJ. Dynamics of vestibulo-ocular, vestibulocollic, and cervicocollic reflexes. Ann N Y Acad Sci. 1981;374:395–402. doi: 10.1111/j.1749-6632.1981.tb30885.x. [DOI] [PubMed] [Google Scholar]
- Pettorossi VE, Grassi S, Errico P, Barmack NH. Role of cerebellar nodulus and uvula on the vestibular quick phase spatial constancy. Acta Otolaryngol Suppl. 2001;545:155–159. doi: 10.1080/000164801750388342. [DOI] [PubMed] [Google Scholar]
- Precht W, Simpson JI, Llinás R. Responses of Purkinje cells in rabbit nodulus and uvula to natural vestibular and visual stimuli. Pflugers Arch. 1976;367:1–6. doi: 10.1007/BF00583649. [DOI] [PubMed] [Google Scholar]
- Rochefort C, Arabo A, André M, Poucet B, Save E, Rondi-Reig L. Cerebellum shapes hippocampal spatial code. Science. 2011;334:385–389. doi: 10.1126/science.1207403. [DOI] [PubMed] [Google Scholar]
- Rochefort C, Lefort JM, Rondi-Reig L. The cerebellum: a new key structure in the navigation system. Front Neural Circuits. 2013;7:35. doi: 10.3389/fncir.2013.00035. [DOI] [PMC free article] [PubMed] [Google Scholar]
- Rubertone JA, Haines DE. Secondary vestibulocerebellar projections to flocculonodular lobe in a prosimian primate, Galago senegalensis. J Comp Neurol. 1981;200:255–272. doi: 10.1002/cne.902000206. [DOI] [PubMed] [Google Scholar]
- Ruigrok TJ. Collateralization of climbing and mossy fibers projecting to the nodulus and flocculus of the rat cerebellum. J Comp Neurol. 2003;466:278–298. doi: 10.1002/cne.10889. [DOI] [PubMed] [Google Scholar]
- Sadakane K, Kondo M, Nisimaru N. Direct projection from the cardiovascular control region of the cerebellar cortex, the lateral nodulus-uvula, to the brainstem in rabbits. Neurosci Res. 2000;36:15–26. doi: 10.1016/S0168-0102(99)00103-0. [DOI] [PubMed] [Google Scholar]
- Sato Y, Kanda K, Ikarashi K, Kawasaki T. Differential mossy fiber projections to the dorsal and ventral uvula in the cat. J Comp Neurol. 1989;279:149–164. doi: 10.1002/cne.902790113. [DOI] [PubMed] [Google Scholar]
- Schlack A, Hoffmann KP, Bremmer F. Interaction of linear vestibular and visual stimulation in the macaque ventral intraparietal area (VIP) Eur J Neurosci. 2002;16:1877–1886. doi: 10.1046/j.1460-9568.2002.02251.x. [DOI] [PubMed] [Google Scholar]
- Shaikh AG, Meng H, Angelaki DE. Multiple reference frames for motion in the primate cerebellum. J Neurosci. 2004;24:4491–4497. doi: 10.1523/JNEUROSCI.0109-04.2004. [DOI] [PMC free article] [PubMed] [Google Scholar]
- Shaikh AG, Green AM, Ghasia FF, Newlands SD, Dickman JD, Angelaki DE. Sensory convergence solves a motion ambiguity problem. Curr Biol. 2005;15:1657–1662. doi: 10.1016/j.cub.2005.08.009. [DOI] [PubMed] [Google Scholar]
- Sharp PE, Blair HT, Etkin D, Tzanetos DB. Influences of vestibular and visual motion information on the spatial firing patterns of hippocampal place cells. J Neurosci. 1995;15:173–189. doi: 10.1523/JNEUROSCI.15-01-00173.1995. [DOI] [PMC free article] [PubMed] [Google Scholar]
- Shojaku H, Barmack NH, Mizukoshi K. Influence of vestibular and visual climbing fiber signals on Purkinje cell discharge in the cerebellar nodulus of the rabbit. Acta Otolaryngol Suppl. 1991;481:242–246. doi: 10.3109/00016489109131391. [DOI] [PubMed] [Google Scholar]
- Stackman RW, Taube JS. Firing properties of head direction cells in the rat anterior thalamic nucleus: dependence on vestibular input. J Neurosci. 1997;17:4349–4358. doi: 10.1523/JNEUROSCI.17-11-04349.1997. [DOI] [PMC free article] [PubMed] [Google Scholar]
- Strick PL, Dum RP, Fiez JA. Cerebellum and nonmotor function. Annu Rev Neurosci. 2009;32:413–434. doi: 10.1146/annurev.neuro.31.060407.125606. [DOI] [PubMed] [Google Scholar]
- Takahashi K, Gu Y, May PJ, Newlands SD, DeAngelis GC, Angelaki DE. Multimodal coding of three-dimensional rotation and translation in area MSTd: comparison of visual and vestibular selectivity. J Neurosci. 2007;27:9742–9756. doi: 10.1523/JNEUROSCI.0817-07.2007. [DOI] [PMC free article] [PubMed] [Google Scholar]
- Takeda T, Maekawa K. Collateralized projection of visual climbing fibers to the flocculus and nodulus of the rabbit. Neurosci Res. 1984;2:125–132. doi: 10.1016/0168-0102(84)90011-7. [DOI] [PubMed] [Google Scholar]
- Takeda T, Maekawa K. Olivary branching projections to the flocculus, nodulus and uvula in the rabbit. II. Retrograde double labeling study with fluorescent dyes. Exp Brain Res. 1989;76:323–332. doi: 10.1007/BF00247892. [DOI] [PubMed] [Google Scholar]
- Thunnissen IE, Epema AH, Gerrits NM. Secondary vestibulocerebellar mossy fiber projection to the caudal vermis in the rabbit. J Comp Neurol. 1989;290:262–277. doi: 10.1002/cne.902900207. [DOI] [PubMed] [Google Scholar]
- Voogd J, Gerrits NM, Ruigrok TJ. Organization of the vestibulocerebellum. Ann N Y Acad Sci. 1996;781:553–579. doi: 10.1111/j.1749-6632.1996.tb15728.x. [DOI] [PubMed] [Google Scholar]
- Voogd J, Schraa-Tam CK, van der Geest JN, De Zeeuw CI. Visuomotor cerebellum in human and nonhuman primates. Cerebellum. 2012;11:392–410. doi: 10.1007/s12311-010-0204-7. [DOI] [PMC free article] [PubMed] [Google Scholar]
- Waespe W, Henn V. Vestibular nuclei activity during optokinetic after-nystagmus (OKAN) in the alert monkey. Exp Brain Res. 1977;30:323–330. doi: 10.1007/BF00237259. [DOI] [PubMed] [Google Scholar]
- Waespe W, Cohen B, Raphan T. Dynamic modification of the vestibulo-ocular reflex by the nodulus and uvula. Science. 1985;228:199–202. doi: 10.1126/science.3871968. [DOI] [PubMed] [Google Scholar]
- Walker MF, Tian J, Shan X, Tamargo RJ, Ying H, Zee DS. Lesions of the cerebellar nodulus and uvula in monkeys: effect on otolith-ocular reflexes. Prog Brain Res. 2008;171:167–172. doi: 10.1016/S0079-6123(08)00622-5. [DOI] [PMC free article] [PubMed] [Google Scholar]
- Walker MF, Tian J, Shan X, Tamargo RJ, Ying H, Zee DS. The cerebellar nodulus/uvula integrates otolith signals for the translational vestibulo-ocular reflex. PLoS One. 2010;5:e13981. doi: 10.1371/journal.pone.0013981. [DOI] [PMC free article] [PubMed] [Google Scholar]
- Wearne S, Raphan T, Cohen B. Control of spatial orientation of the angular vestibuloocular reflex by the nodulus and uvula. J Neurophysiol. 1998;79:2690–2715. doi: 10.1152/jn.1998.79.5.2690. [DOI] [PubMed] [Google Scholar]
- Wiesendanger R, Wiesendanger M, Rüegg DG. An anatomical investigation of the corticopontine projection in the primate (Macaca fascicularis and Saimiri sciureus)–II. The projection from frontal and parental association areas. Neuroscience. 1979;4:747–765. doi: 10.1016/0306-4522(79)90004-6. [DOI] [PubMed] [Google Scholar]
- Wilson VJ, Yamagata Y, Yates BJ, Schor RH, Nonaka S. Response of vestibular neurons to head rotations in vertical planes. III. Response of vestibulocollic neurons to vestibular and neck stimulation. J Neurophysiol. 1990;64:1695–1703. doi: 10.1152/jn.1990.64.6.1695. [DOI] [PubMed] [Google Scholar]
- Wylie DR, Frost BJ. Purkinje cells in the vestibulocerebellum of the pigeon respond best to either translational or rotational wholefield visual motion. Exp Brain Res. 1991;86:229–232. doi: 10.1007/BF00231059. [DOI] [PubMed] [Google Scholar]
- Wylie DR, Frost BJ. Complex spike activity of Purkinje cells in the ventral uvula and nodulus of pigeons in response to translational optic flow. J Neurophysiol. 1999;81:256–266. doi: 10.1152/jn.1999.81.1.256. [DOI] [PubMed] [Google Scholar]
- Wylie DR, Kripalani T, Frost BJ. Responses of pigeon vestibulocerebellar neurons to optokinetic stimulation. I. Functional organization of neurons discriminating between translational and rotational visual flow. J Neurophysiol. 1993;70:2632–2646. doi: 10.1152/jn.1993.70.6.2632. [DOI] [PubMed] [Google Scholar]
- Wylie DR, De Zeeuw CI, DiGiorgi PL, Simpson JI. Projections of individual Purkinje cells of identified zones in the ventral nodulus to the vestibular and cerebellar nuclei in the rabbit. J Comp Neurol. 1994;349:448–463. doi: 10.1002/cne.903490309. [DOI] [PubMed] [Google Scholar]
- Xiong G, Matsushita M. Connections of Purkinje cell axons of lobule X with vestibulospinal neurons projecting to the cervical cord in the rat. Exp Brain Res. 2000;131:491–499. doi: 10.1007/s002219900306. [DOI] [PubMed] [Google Scholar]
- Yakusheva TA, Shaikh AG, Green AM, Blazquez PM, Dickman JD, Angelaki DE. Purkinje cells in posterior cerebellar vermis encode motion in an inertial reference frame. Neuron. 2007;54:973–985. doi: 10.1016/j.neuron.2007.06.003. [DOI] [PubMed] [Google Scholar]
- Yakusheva T, Blazquez PM, Angelaki DE. Frequency-selective coding of translation and tilt in macaque cerebellar nodulus and uvula. J Neurosci. 2008;28:9997–10009. doi: 10.1523/JNEUROSCI.2232-08.2008. [DOI] [PMC free article] [PubMed] [Google Scholar]
- Yakusheva T, Blazquez PM, Angelaki DE. Relationship between complex and simple spike activity in macaque caudal vermis during three-dimensional vestibular stimulation. J Neurosci. 2010;30:8111–8126. doi: 10.1523/JNEUROSCI.5779-09.2010. [DOI] [PMC free article] [PubMed] [Google Scholar]


