

Abstract
Odorant cues are recognized by receptors expressed on olfactory sensory neurons, the primary sensory neurons of the olfactory epithelium. Odorant receptors typically obey the “one receptor, one neuron” rule, in which the receptive field of the olfactory neuron is determined by the singular odorant receptor that it expresses. Odor-evoked receptor activity across the population of olfactory neurons is then interpreted by the brain to identify the molecular nature of the odorant stimulus. In the present study, we characterized the properties of a C family G-protein-coupled receptor that, unlike most other odorant receptors, is expressed in a large population of microvillous sensory neurons in the zebrafish olfactory epithelium and the mouse vomeronasal organ. We found that this receptor, OlfCc1 in zebrafish and its murine ortholog Vmn2r1, is a calcium-dependent, low-sensitivity receptor specific for the hydrophobic amino acids isoleucine, leucine, and valine. Loss-of-function experiments in zebrafish embryos demonstrate that OlfCc1 is required for olfactory responses to a diverse mixture of polar, nonpolar, acidic, and basic amino acids. OlfCc1 was also found to promote localization of other OlfC receptor family members to the plasma membrane in heterologous cells. Together, these results suggest that the broadly expressed OlfCc1 is required for amino acid detection by the olfactory system and suggest that it plays a role in the function and/or intracellular trafficking of other olfactory and vomeronasal receptors with which it is coexpressed.
Introduction
The vertebrate olfactory system receives and processes sensory information from myriad chemical cues through the activation of receptors expressed on olfactory sensory neurons in the nose (Mombaerts, 2004). A large multigene family of olfactory-specific G-protein-coupled receptors (GPCRs) was initially identified in the rat (Buck and Axel, 1991) and belongs to what is now referred to as the OR family of odorant receptors. ORs are expressed according to the “one receptor, one neuron” rule, in which each olfactory sensory neuron expresses a single OR allele that endows upon each cell its functional identity (Chess et al., 1994; Serizawa et al., 2003; Lewcock and Reed, 2004; DeMaria and Ngai, 2010). Members of the trace amine-associated receptor family, which detect amine cues, are expressed in olfactory sensory neurons distinct from cells expressing ORs (Liberles and Buck, 2006). In the vomeronasal epithelium, sensory neurons express receptors from three unrelated GPCR families, the V1R, V2R, and formyl peptide-like receptors (Mombaerts, 2004; Liberles et al., 2009; Riviere et al., 2009).
The V2R vomeronasal receptors and the related OlfC receptors in fish belong to the C family of GPCRs, whose members contain a long N-terminal domain that forms the receptor's orthosteric ligand binding site (Takahashi et al., 1993; Wellendorph and Brauner-Osborne, 2009). Phylogenetic analysis reveals that the vomeronasal/olfactory C family GPCRs, comprising 60–70 members in either fish or rodents, can be divided into distinct subfamilies: the majority comprise one large group in a particular species (Group I in zebrafish and Group IV/V or Family A/B in mice), and a small subset of orthologous genes (7 genes in mice, 1 gene in zebrafish) comprise Group II (also referred to as Family C in mice) (Grus et al., 2005; Yang et al., 2005; Alioto and Ngai, 2006; Silvotti et al., 2011). The Group II receptors are expressed broadly in the sensory epithelia of rodents and fish, whereas Group 1 or Group 4/5 subfamily members are expressed in a punctate pattern characteristic of other odorant receptors, together with a common Group II receptor (Speca et al., 1999; Martini et al., 2001; Alioto and Ngai, 2006; Silvotti et al., 2011).
The coexpression of Group II receptors with individual V2R/OlfC receptors raises a number of interesting questions. For example, what is the role of the ubiquitously expressed Group II receptor? Does it play a role in the function or trafficking of punctate V2R/OlfC receptors? Are Group II receptors directly activated by chemosensory cues? We addressed these questions by functionally characterizing Group II receptors. We found that zebrafish OlfCc1 and an orthologous mammalian receptor, Vmn2r1, are calcium-dependent, low-sensitivity receptors activated by isoleucine, leucine, and valine. Knockdown of OlfCc1 expression in zebrafish further revealed that OlfCc1 is required for the detection of structurally diverse amino acids by the olfactory system in vivo. Together with results showing that punctate OlfC receptors require OlfCc1 for cell surface expression in heterologous cells, these observations provide prima facie evidence that Group II receptors form heteromeric complexes with other V2R/OlfC receptors necessary for receptor function.
Materials and Methods
Zebrafish.
Zebrafish were maintained at 28.5°C and bred naturally using a timed light cycle. Fish of either sex were used for all studies. Wild-type Tuebingen Longfin and AB* fish were obtained from the Zebrafish International Resource Center. UAS-eGFP (Scott et al., 2007), UAS-GCaMP1.6 (Del Bene et al., 2010), and HuC-Gal4 (Paquet et al., 2009) transgenic lines were provided by the Baier laboratory (University of California, San Francisco). The OMP-Gal4 transgenic line was generated using a plasmid construct containing 1.4 kb olfactory marker protein (OMP) 5′ promoter sequence inserted upstream of Gal4 (Celik et al., 2002; T. Ferreira and J. Ngai, unpublished observation); the TrpC2-Gal4 line contains a 4.5 kb transient receptor potential cation channel C2 (TrpC2) 5′ promoter sequence inserted upstream of Gal4 (Sato et al., 2005; V. Lakhina and J. Raper, unpublished observation). Embryos were raised in E3 embryo media (150 mm NaCl, 4.5 mm KCl, 1 mm CaCl2). Fish used in functional imaging experiments were raised in embryo media containing 0.2 mm 1-phenyl 2-thiourea to prevent pigmentation.
Zebrafish immunohistochemistry and RNA in situ hybridization.
The following primary antibodies were used in this study: α-SV2 (1:20 dilution; Developmental Studies Hybridoma Bank, University of Iowa); α-calretinin (1:500 dilution; Swant); α-GFP (1:200 dilution; Abcam); α-acetylated tubulin (1:1000 dilution; Sigma); α-OlfCc1 (1:100; Duggan et al., 2008). Complementary RNA probes for in situ hybridizations were synthesized for OMP (gene ID 317636), TrpC2 (gene ID 562120), and for receptors OlfCc1, OlfCu1, and OlfCv1 (Alioto and Ngai, 2006), as described previously (Alioto and Ngai, 2006; Duggan et al., 2008). Zebrafish embryos (24 hpf to 7 dpf) were fixed in 4% paraformaldehyde in PBS or 2% trichloroacetic acid in PBS for SV2 immunohistochemistry. Immunohistochemistry and RNA in situ hybridization were performed on zebrafish embryos or on frozen tissue sections of adult heads essentially as described previously (Duggan et al., 2008). Quantitation of immunohistochemical features in morphant and control embryos was performed blind on coded images, which were later decoded for statistical analysis. Images were analyzed in NIH ImageJ.
DNA plasmids.
Protein coding sequences were subcloned in a mammalian cell expression plasmid containing the human cytomegalovirus immediate-early promoter/enhancer plus intron A sequence (CMVI vector) (Speca et al., 1999), as follows: OlfCc1 (Alioto and Ngai, 2006; gene ID 566039); Vmn2r1 (gene ID 56544); OlfCu1 (Alioto and Ngai, 2006); OlfCv1 (Alioto and Ngai, 2006); and amino acids 284–409 of human β-arrestin2 (DN β-arrestin) (Orsini and Benovic, 1998). An N-terminal CD8 signal sequence (NH2-MALPVTALLLPLALLLHAARP-COOH) followed by the Flag- or HA-epitope sequence was also included in the receptor expression constructs.
Cell culture and immunocytochemistry.
Human embryonic kidney (HEK) 293 cells were maintained in DMEM (Invitrogen) supplemented with 10% FBS. For immunocytochemistry, cells in poly-d-lysine-coated 8-chamber slides were transfected with plasmid DNA using the Lipofectamine 2000 reagent (Invitrogen) according to the manufacturer's instructions. Cells were fixed 24–48 h after transfection in 4% PFA for 30 min at room temperature and incubated with a rabbit anti-Flag antibody (Invitrogen; 1:1000 dilution) and/or a mouse anti-HA antibody (Sigma; 1;1000 dilution) at 4°C for 1 h in the absence of detergent. Subsequently, cells were washed with PBS, fixed with 4% PFA, and washed in 0.1 m Tris-HCl, pH 7.5, 0.15 m NaCl, 0.1% Triton X-100. Slides were incubated with AlexaFluor 488- or AlexaFluor 568-conjugated secondary antibodies, washed, mounted in VectaShield (Vector Laboratories), and imaged by confocal microscopy.
HEK cell calcium imaging.
HEK293 cells were plated on 20-mm-diameter poly-d-lysine-coated glass coverslips in 35 mm tissue culture dishes and transfected using the Lipofectamine reagent with 2 μg of CMV expression plasmid encoding Flag-tagged OlfCc1 or Vmn2r1 coding sequence. Cells were incubated for 24 h and then loaded with either 2 μm Fluo-4 or 5 μm Fura-2 in calcium imaging buffer (CIB) (Caterina et al., 1997) containing 1 mm CaCl2, and assayed for changes in intracellular calcium, essentially as described previously (Luu et al., 2004). Calcium responses were imaged on a Nikon inverted epifluorescence microscope equipped with a CCD camera on continuous acquisition with alternating 340 nm/380 nm excitation/530 nm emission for Fura-2 and 488 nm excitation/520 nm emission for Fluo-4 (Luu et al., 2004). Data were acquired using Imaging Workbench version 6 (INDEC BioSystems), which records total fluorescent response and baseline-subtracted fluorescent response (DeltaF).
Responses of cells to pools of amino acids were obtained in CIB containing 10 mm CaCl2, using Fura-2 as the calcium indicator. Amino acid pools were composed of 100, 250, and 500 μm concentrations of each l-amino acid (Sigma) as follows: hydrophilic (asparagine, glutamate, glutamine, histidine, lysine, arginine, aspartate); hydrophobic (valine, leucine, isoleucine, methionine); polar (glycine, serine, threonine, tyrosine, cysteine); and nonpolar (alanine, tryptophan, proline, phenylalanine). Responses to individual l-amino acids were assayed by first incubating Fluo-4-loaded cells in CIB containing 10 mm CaCl2 to establish a baseline for the cells in elevated calcium, and then introducing the amino acid pools in CIB containing 10 mm CaCl2. All 20 naturally occurring l-amino acids were tested individually in 10 mm calcium; isoleucine, leucine, and valine were tested at additional concentrations of calcium ranging from 1 to 20 mm. Responses to isoleucine and leucine in 10 mm Ca2+ were also assayed in the presence of 100 nm La3+ (prepared from a stock solution of LaCl3; Sigma) or 50 μm 2-aminoethyl diphenylborinate (2-APB) (Santa Cruz Biotechnology).
Data were background subtracted and processed to generate Delta F/F values. These values were recorded and calculated for each individual cell, represented as a single user-selected ROI during recording. DeltaF/F values were averaged across cells within a single field of view per coverslip (which constitutes a single experiment), and a response curve and EC50 were calculated for each experiment; average EC50 values were calculated from multiple experiments. GraphPad Prism version 5.0c (GraphPad Software) was used to plot dose–response curves and perform statistical analyses.
Dose–response curves measuring increasing concentrations of calcium were obtained using solutions containing 250 μm isoleucine in CIB with variable concentrations of CaCl2. Cells were first stabilized in CIB containing a given concentration of calcium and then switched into 250 μm isoleucine in CIB with the same concentration of calcium; this procedure was repeated for successively higher concentrations of CaCl2. For calculating calcium dose–response curves, we scored the fraction of cells within a population that responded to 250 μm in a given concentration of CaCl2. Cells were determined to be “responsive” if they displayed a peak DeltaF/F ≥ 3× average baseline variation. Each population contained 15–25 cells, with the maximum response determined by the number of cells exhibiting activity in the presence of 20 mm CaCl2.
Morpholino antisense oligonucleotide injections.
A morpholino oligonucleotide blocking the first splice junction of the OlfCc1 transcript and a five base mismatch control oligonucleotide were obtained from Gene Tools. The sequences of these morpholinos were as follows: OlfCc1 perfect match (PM), ATATTTTATCATACCCCTGGCAATC; and OlfCc1 mismatch (MM), ATtTTaTATCTAgCCCTcGCAtTC.
Morpholinos were diluted to a final concentration of 2 ng/nl in 0.2 mm KCl and 0.5 μl of Phenol Red and injected into the yolks of 1 or 2 cell embryos as described previously (Duggan et al., 2008). The minimal volume/concentration of morpholino required to achieve efficient knockdown was 2.3 nl/embryo, as determined by immunohistochemistry using the OlfCc1 antibody.
Zebrafish in vivo functional imaging.
Four- to 7-d-old zebrafish expressing GCaMP1.6 in different neuronal populations were used for functional imaging experiments. Embryos were briefly cooled, mounted in 2% LMP agarose dissolved in Zebrafish Ringer's solution (116 mm NaCl, 2.9 mm KCl, 1.6 mm CaCl2, 5 mm HEPES, 11 mm glucose), and then paralyzed by injection of 2.3 nl of 1 mg/ml α-bungarotoxin (Sigma) into the spinal column at the base of the hindbrain. Paralyzed embryos were remounted in a custom imaging chamber designed to allow laminar flow of solutions over the nares and head. An 8 channel pneumatically controlled perfusion system (AutoMate Scientific) was used to switch between a constant 2 ml/min flow of control Ringer's solution and Ringer's solution containing various odorants. Amino acids, amines, and bile acids were obtained from Sigma. The following odorant mixtures were used: food extract, prepared as described previously (Li et al., 2005); l-amino acid pool: glutamate, alanine, valine, phenylalanine, isoleucine, lysine, arginine, tryptophan, and methionine (100 μm each); bile acid pool: taurochenodeoxycholic acid, glycocholic acid, taurocholic acid, and taurodeoxycholic acid (10 μm each); amine pool: cyclohexamine, phenylethylamine, trimethylamine, N-methylpiperidine, tyramine, and octopamine (5 μm each).
Images were acquired at 4 Hz on a Zeiss Live 5 line scanning confocal microscope using a 60× water-immersion objective. For each trial, odorant was applied for 4 s, 30 s after image acquisition was triggered; image acquisition continued for another 40 s after switching the flow back to control Ringer's solution. Two minutes of washout and recovery was allowed between each odor application and interval that we determined empirically to allow complete recovery from desensitization. At the beginning of each acquisition period, the focus was manually adjusted to a reference plane to ensure the same features were in the field of view for each trial. Each fish was imaged at multiple planes through the olfactory epithelium or olfactory bulb. For some experiments, the vital membrane dye BODIPY (Invitrogen) was used as a back label to provide better identification of glomerular position.
Data from individual trials (acquired using Zeiss LSM 510 software) were imported as .lsm files into National Institutes of Health ImageJ running the MacBiophotonics plug-in collection. Each image series was processed with the Image Stabilizer plug-in for ImageJ (Li, 2008) using translation settings to minimize any potential artifacts resulting from lateral X-Y shifts. For the generation of DeltaF/F0 values for a particular ROI, F0 was calculated as the numerical average of the first 6 frames in each series and subsequent frames were normalized against this value. Five consecutive frames spanning the maximal response in the resultant DeltaF/F0 image series were combined to generate heat maps. Responding microvillous sensory neurons in the TrpC2-Gal4;UAS-GCaMP line were quantified by counting the number of cells showing an increase in fluorescence compared with the total number of GCaMP-labeled cells in the 10 s after odorant application. For quantitation of the percentage area of the bulb responding, an average threshold mask was applied to the activity map to clearly mark nonresponding areas, and the area of responding regions was calculated from ROIs drawn around unmasked regions. A smooth RBG spectrum look-up table was applied to the activity map for data visualization. In most cases, the false color map was set to 50% transparency and superimposed over the average F0 image to provide anatomical reference points for the responses and to clearly delineate the out-of-focus regions subject to stochastic noise without cropping the image. If an image was cropped, a reference F0 image is provided to indicate out-of-plane (and thus nonfluorescent) regions. Pairwise comparisons between values for mismatch and morphant populations were evaluated using a two-tailed Student's t test.
Results
Zebrafish OlfCc1 is coexpressed with other OlfC receptors in microvillous olfactory sensory neurons
The Group II receptors from mouse and goldfish are expressed broadly in most, if not all, of the microvillous olfactory neurons of the mammalian VNO or fish olfactory epithelium (Speca et al., 1999; Martini et al., 2001; Alioto and Ngai, 2006), suggesting that they are coexpressed with other members of the V2R or OlfC receptor gene family (Martini et al., 2001; Silvotti et al., 2011). We performed double-label in situ hybridizations to characterize the expression of the zebrafish Group II receptor OlfCc1 in the adult zebrafish olfactory epithelium. In the fish, the ciliated and microvillous olfactory sensory neurons, whose analogous cell types localize in higher vertebrates to the main olfactory epithelium and vomeronasal epithelium, respectively, are intermingled in a single olfactory epithelium. Figure 1A shows that OlfCc1 is expressed by cells distinct from those expressing olfactory marker protein (OMP), a marker of ciliated olfactory sensory neurons (Sato et al., 2005). In contrast, the majority of cells labeled with OlfCc1 are colabeled by a probe for TrpC2 (Fig. 1B), an ion channel expressed by microvillous olfactory neurons (Sato et al., 2005). Additional double-label in situ hybridizations performed with probes for OlfCc1 and two individual representative receptors, OlfCu1 or Olfcv1, reveal coexpression of OlfCc1 with “punctate” OlfC receptors (Fig. 1C,D). In accord with previous studies showing V2R receptor coexpression in the mammalian VNO (Martini et al., 2001; Silvotti et al., 2011), these results demonstrate that individual punctate OlfC receptors are coexpressed with the ubiquitous OlfCc1 receptor in zebrafish microvillous olfactory neurons.
Figure 1.

Localization of OlfCc1 to microvillous neurons in the zebrafish olfactory epithelium. Double-label RNA in situ hybridizations were performed on tissue sections of adult zebrafish olfactory epithelium (A–D). A, OlfCc1 (magenta) is expressed in a population of cells distinct from the ciliated olfactory neurons, which are labeled by OMP (green). B, OlfCc1 (magenta) colocalizes with cells expressing TrpC2 (green), a marker of microvillous olfactory neurons. C, Punctate receptor OlfCu1 (green) is coexpressed with OlfCc1 (magenta). D, Similarly, punctate receptor OlfCv1 (green) is coexpressed with OlfCc1 (magenta). C, D, Arrows and insets indicate cells coexpressing punctate receptor with OlfCc1. E, Tissue section of adult olfactory epithelium stained with an antibody to OlfCc1 (green); nonsensory epithelium is identified by acetylated tubulin (magenta). Inset, Higher-magnification view of tissue stained with OlfCc1 antibody (apical surface is toward the top). F, Projected confocal stack of a 3-d-old zebrafish embryo labeled with OlfCc1 (green) and calretinin (magenta), demonstrating expression of OlfCc1 in embryonic microvillous olfactory sensory neurons. OE, Olfactory epithelium; OB, olfactory bulb. Scale bars: A–E, 100 μm; C–E insets, F, 50 μm.
We also performed immunohistochemistry using an antibody generated against a peptide from the N-terminal domain of OlfCc1 (Duggan et al., 2008). Consistent with the results from our RNA in situ hybridizations, OlfCc1 protein localizes to cells in the apical domain of the sensory epithelium of adult zebrafish, the location of the microvillous neurons' cell bodies (Fig. 1E). OlfCc1 protein expression is also detected in the olfactory epithelium of 3-d-old zebrafish embryos, where it is coexpressed in a large fraction of cells expressing calretinin, a marker of microvillous neurons in embryonic zebrafish (Koide et al., 2009) (Fig. 1F). We speculate that the calretinin-positive, OlfCc1-negative cells, which are found predominantly in the basal regions of the embryonic olfactory epithelium, represent immature microvillous neurons or their progenitors. In both adult and embryonic tissue, OlfCc1 immunoreactivity is observed throughout the cell bodies of positive cells and is apparently excluded from axons. Although present, the receptor is not concentrated in the apical dendrites or microvilli.
Zebrafish OlfCc1 and mouse Vmn2r1 are calcium-dependent amino acid receptors
If the broadly expressed Group II receptors themselves can be activated by chemosensory cues, each sensory neuron's receptive field would be determined by the ligand tuning properties of the Group II receptor in addition to the punctate receptor that it expresses. We therefore wished to identify the activating ligands for OlfCc1 and its mammalian ortholog Vmn2r1 (also known as V2R2) (Martini et al., 2001). To this end, we isolated a full-length cDNA for OlfCc1 and cloned it together with an N-terminal FLAG-epitope tag into a plasmid for heterologous expression in HEK293 cells. Others have reported that localization of cloned mammalian V2R receptors to the plasma membrane of HEK293 requires coexpression of calreticulin (Dey and Matsunami, 2011). We nonetheless observed robust expression of epitope-tagged OlfCc1 at the surface of HEK293 cells transfected with the OlfCc1 expression plasmid alone, as judged by immunocytochemistry using an anti-epitope antibody on unpermeablized cells (data not shown; see also Fig. 8).
Figure 8.

OlfCc1 facilitates cell surface expression of punctate OlfC receptors in heterologous cells. HEK 293 cells were transfected with DNA expression constructs and assessed for cell surface expression of epitope-tagged OlfC receptors by immunohistochemistry on unpermeabilized cells. Cell surface expression of Flag-tagged OlfCc1 (A) is enhanced by coexpression with DN-β-arrestin (B). Punctate Olfcu1 (C) and OlfCv1 (G) show little to no detectable cell surface expression when transfected alone (insets show antibody staining in the presence of detergent). Localization of these receptors to the plasma membrane is facilitated by coexpression with OlfCc1 and DN-β-arrestin (D–F,H–J). Cotransfection of punctate receptors with DN-β-arrestin alone had no discernible effect on their localization to the cell surface. Labeled cells were visualized by confocal microscopy. Scale bar, 50 μm. F, J insets, original magnification ×2.
HEK293 cells were transfected with Flag-tagged OlfCc1, loaded with a calcium-sensitive dye, and screened for activating ligands. In selecting compounds to test as OlfCc1 agonists, we took into account the following considerations. First, regions of the zebrafish olfactory bulb responsive to amino acid stimuli are innervated preferentially by microvillous neurons, whereas other regions of the bulb responsive to other classes of cues are innervated by ciliated neurons (Friedrich and Korsching, 1997, 1998; Li et al., 2005; Sato et al., 2005; Koide et al., 2009). Second, all members of the zebrafish OlfC receptor family contain a conserved 8 residue motif that is found in the periplasmic binding protein-like I family of amino acid binding proteins and is required for binding to amino acid ligands (Acher and Bertrand, 2005; Alioto and Ngai, 2006). We therefore hypothesized that OlfCc1 and other members of the zebrafish OlfC receptor family may be activated by amino acids or their derivatives. In initial experiments, however, we failed to observe activation of OlfCc1-expressing HEK293 cells by a mixture of amino acids. Upon closer examination of the phylogeny of C family GPCRs (Alioto and Ngai, 2006), we realized that the phylogenetic proximity of zebrafish and mammalian Group II receptors to the calcium sensing receptor may reflect a dependence on calcium for activation of these olfactory/vomeronasal receptors. Indeed, under conditions of elevated extracellular Ca2+ (10 mm vs 1–2 mm typically found in standard assay buffers), we found activation of OlfCc1 by a pool containing hydrophobic l-amino acids (valine, leucine, isoleucine, methionine), but not by pools containing the other 16 naturally occurring l-amino acids (Fig. 2A). Receptor activation assays performed with individual components of this hydrophobic amino acid pool revealed that isoleucine, leucine, and valine are the active components of this mixture, with EC50 values of 245, 377, and 233 μm, respectively, in the presence of 10 mm Ca2+ (Table 1). Methionine showed no detectable activity in our assays at concentrations up to 1 mm (data not shown). Leucine and valine consistently elicited lower peak activation values than isoleucine, suggesting that they are partial agonists of OlfCc1. Representative dose–response curves are shown in Figure 2B.
Figure 2.

OlfCc1 and Vmn2r1 are calcium-dependent amino acid-sensing receptors. HEK293 cells were transfected with DNA plasmids encoding zebrafish OlfCc1 or mouse Vmn2r1 and assayed for receptor activation by calcium imaging. A, Representative traces of cells loaded with Fura-2 in response to pools of amino acids in the presence of 10 mm CaCl2. Ligands were applied to the cells as indicated; concentrations (100, 250, 500 μm) refer to concentrations of individual amino acids within each pool. Only the pool containing the hydrophobic amino acids valine, leucine, isoleucine, and methionine elicited activity above background. B, E, Representative dose–response curves of activity in Fluo-4-loaded HEK cells expressing OlfCc1 (B) or Vmn2r1 (E) elicited by isoleucine, leucine, and valine in the presence of 10 mm CaCl2. These three ligands were the only amino acids that elicited activity in OlfCc1- and Vmn2r1-expressing HEK293 cells. Isoleucine consistently elicited the peak responses larger than those for leucine and valine. C, F, Representative dose–response curves of activity in Fluo-4-loaded cells expressing OlfCc1 (C) or Vmn2r1 (F) elicited by 250 μm isoleucine in the presence of varying concentrations of CaCl2. D, Assays were also conducted in the absence or presence of either 50 μm 2-APB or 100 nm La3+, inhibitors of calcium release-activated calcium channels. Data from multiple experiments are summarized in Table 1.
Table 1.
Quantitation of receptor activation in HEK293 cellsa
| EC50 | Maximum amplitude (ΔF/F) | Number of experiments (n) | |
|---|---|---|---|
| OlfCc1 | |||
| Isoleucine | 245 ± 19 μm | 5.5 ± 0.1 | 10 |
| Leucine | 377 ± 18 μm | 2.5 ± 0.1 | 10 |
| Valine | 233 ± 12 μm | 1.1 ± 0.03 | 10 |
| Ca2+ | 4.7 ± 0.2 mm | — | 10 |
| Isoleucine + 2-APB | 304 ± 26 μm | 5.0 ± 0.2 | 3 |
| Isoleucine + La3+ | 236 ± 15 μm | 4.8 ± 0.2 | 3 |
| Leucine + 2-APB | 292 ± 37 μm | 2.3 ± 0.1 | 3 |
| Leucine + La3+ | 352 ± 24 μm | 3.4 ± 0.2 | 3 |
| Vmn2r1 | |||
| Isoleucine | 263 ± 8.0 μm | 3.4 ± 0.1 | 5 |
| Leucine | 279 ± 24 μm | 1.7 ± 0.02 | 5 |
| Valine | 183 ± 32 μm | 2.1 ± 0.1 | 3 |
| Ca2+ | 8.4 ± 0.7 mm | — | 5 |
a Data are mean ± SEM. Activation of OlfCc1 or Vmn2r1 in response to isoleucine, leucine, and valine was measured in the presence of 10 mm CaCl2. Dependence of receptor activation on varying concentrations of calcium was assayed in the presence of 250 μm isoleucine. Activation of OlfCc1 by isoleucine and leucine was also tested in the presence of 50 μm 2-APB or 100 nm La3+, inhibitors of calcium release-activated calcium channels. Mean EC50 for each receptor–ligand combination was derived from multiple experiments, as indicated.
To characterize the calcium dependence of receptor activation, OlfCc1-expressing HEK293 cells were exposed to 250 μm isoleucine in varying concentrations of Ca2+; under these conditions, the receptor demonstrates an EC50 of 4.5 mm Ca2+ (Fig. 2C; Table 1), comparable to the calcium activation profile of the human calcium sensing receptor; OlfCc1 is not activated by Ca2+ alone, however (data not shown). One explanation for the calcium dependency of OlfCc1 is that Ca2+ is not a cofactor for agonist-dependent receptor activation but rather enhances the signal in this cell-based assay by stimulating calcium release-activated calcium channels. To test this possibility, we conducted the assays in the presence of either 50 μm 2-APB or 100 nm La3+, inhibitors of calcium release-activated calcium channels (Aussel et al., 1996; Prakriya and Lewis, 2001). The responses of OlfCc1 to isoleucine or leucine in the presence of 10 mm Ca2+ were unaffected by these inhibitors (representative traces are shown in Fig. 2D and data from multiple experiments are tabulated in Table 1), ruling out the possibility that the observed responses are the result of receptor-independent release of Ca2+ from internal stores. Previously characterized olfactory amino acid receptors from goldfish and zebrafish exhibit micromolar EC50 values (Speca et al., 1999; Luu et al., 2004), consistent with nanomolar behavioral detection thresholds for amino acids in fish in vivo (Hara, 1994). Thus, OlfCc1 appears to be a low-sensitivity, calcium-dependent isoleucine/leucine receptor that is expressed widely within the population of microvillous neurons in the zebrafish olfactory epithelium.
Our characterization of OlfCc1 as a calcium-dependent amino acid receptor led us to ask whether its orthologous mammalian vomeronasal receptors exhibit similar functional properties. We therefore tested the functional properties of Vmn2r1, one of seven mouse Group II receptors, in HEK293 cells. Unlike the majority of mammalian V2R receptors, Vmn2r1 and the other mammalian Group II receptors contain the 8-residue signature motif characteristic of amino acid receptors (Acher and Bertrand, 2005; Alioto and Ngai, 2006). As we observed with zebrafish OlfCc1, Vmn2r1 is activated preferentially by isoleucine (EC50 = 263 μm) with an EC50 of 8.4 mm Ca2+ when measured in the presence of 250 μm isoleucine (Fig. 2E,F; Table 1). Leucine and valine also activate Vmn2r1, but as we observed with OlfCc1, elicit lower peak activities than isoleucine, suggesting that they are partial agonists of Vmn2r1 (Fig. 2E; Table 1). Together, these results show that the orthologous zebrafish OlfCc1 and mammalian Vmn2r1 receptors are similar, both in terms of their ligand-activation properties and their widespread expression within the population of microvillous neurons of the olfactory (fish) and vomeronasal (mouse) epithelium.
Microvillous olfactory neurons are activated by amino acids
The results presented thus far demonstrate that OlfCc1 and Vmn2r1 are amino acid receptors that are expressed broadly in the microvillous neurons of the zebrafish olfactory and mammalian vomeronasal epithelia, respectively. What role do these receptors play in microvillous olfactory/vomeronasal neurons in vivo? One approach toward answering this question would be to assess the consequences of a Vmn2r1 knock-out in the mouse. However, analysis of a single gene knock-out could be confounded by the presence of any one of the other six Vmn2r1-like (Group II) isoforms encoded in the mouse genome (Silvotti et al., 2011). We therefore focused our attention on loss-of-function studies in the zebrafish, which are facilitated by the presence of only one Group II receptor, OlfCc1, encoded in the zebrafish genome.
Previous studies have shown that glomeruli in the lateral portion of the zebrafish olfactory bulb receive innervation from microvillous olfactory neurons and are preferentially activated by amino acids (Li et al., 2005; Sato et al., 2005). In addition, inhibition of synaptic transmission by primary sensory cells projecting to this region of the olfactory bulb attenuates attractive swimming behaviors elicited by olfactory amino acid cues (Koide et al., 2009). Although these studies suggest that olfactory amino acid cues are received by microvillous olfactory neurons, activation of these cells by amino acids has yet to be demonstrated directly. Thus, before assessing the role OlfCc1in microvillous neurons by loss-of-function studies, we first sought to confirm that these cells are principally activated by amino acids.
We used the genetically encoded calcium indicator GCaMP to measure odorant-induced neuronal activity in zebrafish embryos. For these experiments, zebrafish carrying a UAS- GCaMP reporter gene construct (Del Bene et al., 2010) were crossed to transgenic lines containing the following promoters driving the Gal4 transactivator: OMP for expression in ciliated olfactory sensory neurons (Celik et al., 2002), TrpC2 for expression in microvillous olfactory neurons (Sato et al., 2005), and HuC for pan-neuronal expression in excitatory neurons throughout the CNS, including the olfactory bulb (Park et al., 2000; Li et al., 2005; Paquet et al., 2009). Noses of transgenic fish were perfused with solutions containing odorant stimuli and neuronal activity in the olfactory epithelium or olfactory bulb was monitored by fast scanning confocal microscopy. Mixtures of different classes of odorant stimuli (see Materials and Methods for details) were used to maximize the number of responsive cells. In particular, a pool of glutamate, alanine, valine, phenylalanine, isoleucine, lysine, arginine, tryptophan, and methionine (at 100 μm each) was assembled with the idea that such a combination of structurally diverse ligands at this relatively high concentration would stimulate most if not all olfactory sensory neurons that are normally responsive to amino acids (Friedrich and Korsching, 1997, 1998; Li et al., 2005). As shown in Figure 3A–F, activity was elicited in ciliated olfactory neurons (as assayed in OMP-Gal4;UAS-GCaMP fish) by food extract, amines, and bile acids, but not by amino acids. In contrast, microvillous neurons visualized in the TrpC2-Gal4;UAS-GCaMP transgenic reporter line showed responses to food extract and the amino acid pool, but not to amines or bile acids (Fig. 3G–L). Odor-evoked increases in intracellular calcium localized mainly to the responding cells' apical dendrites (see also Fig. 4). The nucleotides ATP and ITP evoked detectable responses in the OMP- but not the TrpC2-reporter line (data not shown).
Figure 3.

Amino acids activate microvillous olfactory sensory neurons in zebrafish embryos. Activity elicited by a panel of odorant mixtures was assessed in 4.5-d-old transgenic zebrafish embryos expressing the genetically encoded calcium sensor GCaMP1.6 in different classes of neurons: A–F, ciliated olfactory sensory neurons (OMP-Gal4;UAS-GCaMP1.6). G–L, microvillous olfactory sensory neurons (TrpC2-Gal4;GCaMP1.6). M–R, excitatory neurons in the olfactory bulb (HuC-Gal4;GCaMP1.6). Some neurons in the olfactory epithelium also express GCaMP under the control of the HuC-Gal4 driver. A, G, M, Baseline GCaMP fluorescence for each transgenic line. Fish were exposed to the following odorant mixtures (for specific mixture compositions, see Materials and Methods): food extract (B,H,N), bile acids (C,I,O), amines (D,J,P), and amino acids (E,K,Q). F, L, R, Traces of DeltaF/F0 for representative regions of interest responding to food extract. Food extract elicits activity broadly within the ciliated and microvillous olfactory sensory neurons, as well as across the olfactory bulb. Bile acids elicit activity mainly in ciliated neurons, whereas amino acids elicit activity in microvillous neurons and in the lateral olfactory bulb. Heat maps of DeltaF/F0 represent data acquired from a single optical plane and spanning the peak response (see Materials and Methods). OE, Olfactory epithelium; OB, olfactory bulb. Scale bar, 100 μm.
Figure 4.

Patterns of activity elicited by amino acids in microvillous olfactory sensory neurons. Response of microvillous olfactory sensory neurons to food extract, a mixture of all 20 naturally occurring l-amino acids, and subpools of amino acids with different side chain properties was assessed in 4.5-d-old TrpC2-Gal4;GCaMP1.6 transgenic zebrafish embryos. A, Baseline GCaMP fluorescence for microvillous olfactory sensory neurons (TrpC2-Gal4;GCaMP1.6) in the representative fish displayed in this figure; heat maps showing responses to (B) food extract, (C) mixture of 20 amino acids at 100 μm each, (E) 100 μm glutamate (acidic), (F) isoleucine and leucine (hydrophobic) at 100 μm each, and (G) arginine and lysine (basic) at 100 μm each. D, Overlaid activity maps for food extract (pseudocolored in green) and total amino acids (pseudocolored in magenta) show widespread activity in largely overlapping populations of microvillous neurons. H, Schematic of responding cells derived from regions of activity circled in (D) illustrates that distinct subsets of cells are activated by individual subpools of amino acids. Heat maps of DeltaF/F0 represent data acquired from a single optical plane and spanning the peak response (see Materials and Methods). Scale bar, 50 μm.
Different classes of amino acids elicit activity in distinct regions of the zebrafish olfactory bulb (Friedrich and Korsching, 1997). Together with the results shown in Figure 3, these observations suggest that individual microvillous olfactory neurons respond to subsets of amino acids. We were particularly interested in learning whether isoleucine and leucine, the cognate ligands for OlfCc1, would elicit activity broadly across the population of microvillous neurons, considering this receptor's ubiquitous expression in these cells. We therefore extended our analysis of odor-evoked activity in TrpC2-Gal4;UAS-GCaMP-labeled microvillous neurons to ask whether subsets of amino acids activate subsets of microvillous sensory neurons. As shown in Figure 4B, C, food extract or a mixture of all 20 amino acids (at 100 μm each) activate a significant fraction of the microvillous neurons; cells showing activity with either mixture are largely overlapping (Fig. 4D), suggesting that the microvillous neurons are responding mainly to amino acids contained in the crude food extract. Stimulation with either 100 μm glutamate (acidic) or smaller pools of structurally related amino acids, arginine + lysine (basic) or isoleucine + leucine at 100 μm each (Fig. 4E–G), elicits activity in smaller and distinct subsets of cells (Fig. 4H). Partial overlap is observed in the case of arginine + lysine and isoleucine + leucine, perhaps reflecting recognition of a chemical structure shared by the n-aliphatic side chains of these two classes of amino acids. It is noteworthy that isoleucine + leucine does not elicit a broad response across a large fraction of the microvillous cell population, as one might expect if the ubiquitously expressed OlfCc1 were activated under these conditions.
We also assayed odor-evoked neuronal activity in the olfactory bulb using the HuC-Gal4;UAS-GCaMP transgenic reporter, which is expressed predominantly, if not exclusively, in the excitatory neurons of the olfactory bulb (Li et al., 2005). The four odorant mixtures (food extract, bile acids, amines, and amino acids) each elicited distinct patterns of activity in the olfactory bulb, with food extract giving the most robust and widespread response, likely reflecting the complex mixture of odorous compounds in this extract (Fig. 3M–R). Consistent with previous studies (Friedrich and Korsching, 1997; Li et al., 2005; Sato et al., 2005), amino acids evoked activity in the lateral olfactory bulb (Fig. 3Q), the main site of innervation in the bulb by microvillous neurons. Together, these results provide direct evidence that amino acids elicit activity in microvillous olfactory neurons.
Knockdown of OlfCc1 expression in vivo
To enable a loss-of-function analysis of OlfCc1 in zebrafish in vivo, an antisense morpholino oligonucleotide was designed against the first exon–intron junction of OlfCc1 (perfect match or PM) together with a control mismatch (MM) oligonucleotide identical to the PM sequence, except for a 5-base mismatch. Morpholino oligonucleotides were injected into 1 or 2 cell embryos and analyzed for OlfCc1 protein expression between 3 and 5 d post-fertilization (dpf), corresponding to the time when zebrafish embryos become responsive to amino acid and other olfactory stimuli (Lindsay and Vogt, 2004) and olfactory sensory neurons form glomeruli in the olfactory bulb (Dynes and Ngai, 1998; Li et al., 2005). Whereas OlfCc1 expression persists in embryos previously injected with the control MM oligonucleotide, the PM oligonucleotide was highly effective at knocking down OlfCc1 expression, reducing OlfCc1 to levels undetectable by immunohistochemistry at 5 d of development (Fig. 5A,B). The effect of the PM oligonucleotide appears to be specific for OlfCc1 expression, as the presence of microvillous neurons (identified by staining for calretinin) and ciliated neurons (identified using the OMP-Gal4;UAS-EGFP transgenic reporter) and the patterns of their projections in the olfactory bulb are similar between PM and MM oligonucleotide-injected fish (Fig. 5C–F). Moreover, staining for the presynaptic marker SV2 to visualize olfactory bulb glomeruli further reveals that the overall pattern of innervation in the olfactory bulb is unperturbed by OlfCc1 knockdown (Fig. 5G,H). We did, however, observe an ∼30% reduction in the total number of microvillous and ciliated neurons, as well as their glomerular “footprint” in the olfactory bulb (data not shown). This effect may reflect previously described sequence-specific, off-target effects of some morpholino oligonucleotides, which in some instances have been attributed to enhanced cell death in the nervous system independent of the targeted gene of interest (Robu et al., 2007). Aside from exhibiting somewhat hypomorphic nervous systems, fish injected with the PM oligonucleotide possess ciliated and microvillous neurons in ratios similar to those observed in control fish, with normal patterns of innervation in the olfactory bulb. We conclude that OlfCc1 expression is not strictly required for the development of the microvillous neurons or their stereotyped projections in the olfactory bulb, although it is formally possible that knockdown of OlfCc1 expression perturbs gene expression in microvillous neurons beyond downregulation of OlfCc1. In the following section, we describe experiments in which we examined the effects of the OlfCc1 knockdown on odor-evoked responses.
Figure 5.
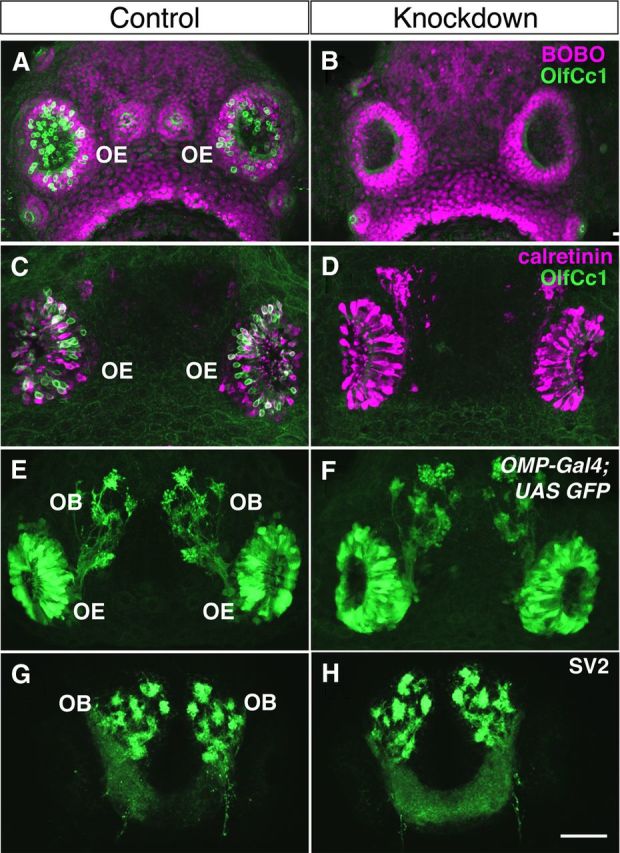
Morpholino antisense oligonucleotide-mediated knockdown of OlfCc1 expression in zebrafish embryos. One or two cell zebrafish embryos were injected with a morpholino antisense oligonucleotide designed against OlfCc1 (“Knockdown”) or a 5-base mismatch control oligonucleotide (“Control”), fixed at 4 d of development, and analyzed by immunohistochemistry. A, B, Staining with an antibody against OlfCc1 (green) demonstrates loss of OlfCc1 expression in knockdown versus control. Embryos were counterstained with the nuclear counterstain BOBO (magenta). C, D, Simultaneous staining for calretinin (magenta) and OlfCc1 (green) indicates persistence of microvillous olfactory sensory neurons in the absence of OlfCc1 expression. E, F, Localization of ciliated olfactory sensory neurons and their axonal projections by staining for GFP in OMP-Gal4;UAS-GFP transgenic fish demonstrates that this sensory neuron population is largely unperturbed by the knockdown of OlfCc1 expression. G, H, Localization of the synaptic vesicle protein SV2 to visualize presynaptic terminals in olfactory bulb glomeruli reveals normal formation of the olfactory sensory map. All images represent projected confocal stacks through the entire olfactory epithelium (OE) and olfactory bulb (OB). Scale bar, 100 μm.
OlfCc1 is required for amino acid-evoked olfactory responses
Morpholino oligonucleotides were injected into TrpC2-Gal4;UAS-GCaMP zebrafish embryos, which were then subjected to functional imaging at 4 dpf. As shown in Figure 6A–C, microvillous olfactory neurons in embryos previously injected with the control (MM) oligonucleotide exhibited robust responses to food extract or to a mixture of 9 structurally diverse l-amino acids (representing polar, nonpolar, acidic, and basic amino acids, and tested at 100 μm each; see Materials and Methods). In contrast, the number of cells responding to either odorant mixture was greatly reduced in embryos previously injected with the perfect match (PM) antisense oligonucleotide directed against OlfCc1 (Fig. 6D–F). A large fraction of fish injected with the OlfCc1 antisense oligonucleotide displayed no responses at all, in contrast to control fish, in which ∼30% of GCaMP-positive neurons typically showed odor-evoked activity. Quantitation of the number of responsive cells reveals a highly significant reduction in the knockdown compared with control for both food extract and pooled amino acid stimuli (p < 0.01, Student's t test; Fig. 6G). Similar results were observed with a mixture containing all 20 naturally occurring l-amino acids tested at a concentration of 10 μm each (data not shown).
Figure 6.

OlfCc1 is required for amino acid-evoked activity in microvillous olfactory sensory neurons. Transgenic TrpC2-Gal4;UAS-GCaMP embryos previously injected with perfect match (“Knockdown”) or mismatch (“Control”) OlfCc1 morpholino antisense oligonucleotides were assayed at 4.5 dpf for odorant-stimulated activity in the olfactory epithelium. A–C, Olfactory epithelium from a representative fish injected with the mismatch control oligonucleotide. D–F, Olfactory epithelium from a representative fish injected with the perfect match experimental oligonucleotide. A, D, Baseline GCaMP fluorescence for each condition. Fish were exposed to food extract (B,E) or a mixture of 9 amino acids at 100 μm each (C,F). There is a dramatic reduction in the number of responding cells in the knockdown condition. Heat maps of DeltaF/F0 represent data acquired from a single optical plane and spanning the peak response (see Materials and Methods for details). Scale bar, 100 μm. G, Odor-evoked activity was scored as the percentage of GCaMP-positive cells responding to a given stimulus; data were averaged from 14 control fish and 13 knockdown fish. Histograms represent mean ± SEM. ***p < 0.01 using a two-tailed Student's t test.
Our analysis of OlfCc1 morphant fish indicates that OlfCc1 is required for microvillous neurons to respond to odorants, in particular to amino acids. To verify that the effect of the morpholino antisense oligonucleotide-mediated knockdown is specific to microvillous neurons and not the result of a generalized, nonspecific effect on the olfactory system, odor-evoked activity in the olfactory bulb was measured using the HuC-Gal4;UAS-GCaMP reporter line. As we observed in normal zebrafish embryos (Fig. 3), embryos previously injected with the control oligonucleotide showed strong responses to food extract, bile acids, amines, and amino acids (Fig. 7A–D, left-hand column). Whereas odor-evoked activity in response to food extract, bile acids, and amines in olfactory bulbs of fish treated with the OlfCc1 antisense oligonucleotide was similar to activity observed in controls (Fig. 7A–C), responses to amino acids were strikingly reduced in the OlfCc1 morphant fish (Fig. 7D,E). The area of the olfactory bulb responding to amino acids was reduced on average sevenfold in the OlfCc1 knockdown (p < 0.001, Student's t test; Fig. 7F); no significant differences were found with the other odorant stimuli (p > 0.1). Our observations of odor-evoked activity in the olfactory epithelium and olfactory bulb in control versus OlfCc1 morphant fish demonstrate that this receptor is required for the detection of amino acid cues by microvillous olfactory neurons. Importantly, the OlfCc1 knockdown does not perturb the responses to other odorant classes to which the ciliated olfactory neurons respond.
Figure 7.

Effects of OlfCc1 knockdown are specific to amino acid-evoked activity. Transgenic HuC-Gal4;UAS-GCaMP embryos previously injected with perfect match (“Knockdown”) or mismatch (“Control”) OlfCc1 morpholino antisense oligonucleotides were assayed at 4.5 dpf for odorant-stimulated activity in the olfactory bulb. A–D, Activity heat maps are shown for two representative fish in response to food extract (A), bile acid pool (B), amine pool (C), and amino acid pool (D). Heat maps of DeltaF/F0 represent data acquired from a single optical plane and spanning the peak response (see Materials and Methods). Activity in response to food extract, bile acids, and amines is broad in the olfactory bulb and persists in the OlfCc1 knockdown. In contrast, amino acids elicit activity mainly in a cluster of lateral glomeruli (D, arrows); this activity is greatly diminished in the OlfCc1 knockdown. E, Representative DeltaF/F0 traces from ROIs corresponding to anatomically equivalent lateral glomerular cluster in 4 control fish (blue lines) and 4 knockdown fish (orange lines) after exposure (arrow) to the 9 amino acid pool. F, The area of olfactory bulb exhibiting significant activity above background was calculated and expressed as a percentage of the total area within a given optical section. Data were acquired from 14 control and 14 knockdown fish. Histograms represent mean percentages ± SEM. No significant difference was found between control and knockdown groups in response to food extract, bile acids, or amine stimuli (n.s., Not significant; p > 0.1, two-tailed Student's t test). In contrast, a highly significant difference was found between these two groups in their responses to amino acids (***p < 0.001).
OlfCc1 promotes cell surface expression of other OlfC receptors in heterologous cells
Previous studies have shown that individual amino acids elicit distinct patterns of activation in the olfactory bulb (Friedrich and Korsching, 1997; Li et al., 2005), suggesting that such activity arises from the activation of subsets of microvillous olfactory neurons expressing OlfC receptors tuned for specific amino acids. Our analysis of OlfCc1 function in vivo shows that this receptor is required for microvillous neurons to respond to a structurally diverse array of amino acids (Figs. 6 and 7), even though it is a low-sensitivity amino acid receptor that is activated only by the hydrophobic amino acids isoleucine, leucine, and valine (Fig. 2). One possible explanation for this conundrum is that OlfCc1 does not interact with amino acid ligands at low concentrations but is nonetheless required for amino acid detection in vivo, perhaps through some physical interaction with punctate OlfC family members that function as high-affinity receptors. As an initial test of this hypothesis, we asked whether any evidence for receptor-receptor interactions could be observed in heterologous cells.
Mammalian cell expression plasmids encoding FLAG-tagged OlfCc1 and HA-tagged punctate OlfC receptors were used to transfect HEK293 cells individually or in combination. Cells were fixed and subjected to immunocytochemistry without permeabilization, using the appropriate anti-epitope antibodies for detection. As shown in Figure 8A, OlfCc1 localizes to the cell surface when transfected alone into HEK293 cells. Although OlfCc1 exhibits surface expression at levels sufficient to allow its functional characterization (Fig. 2), the signal by immunocytochemistry seems somewhat weak compared with the levels we have observed with other receptors, such as goldfish receptor 5.24 (Speca et al., 1999; data not shown). Because the tissue culture medium used to culture HEK293 cells contains millimolar concentrations of all 20 naturally occurring amino acids, we wondered whether OlfCc1 may be subject to internalization after its tonic activation. Some GPCRs, including the β2-adrenergic receptor and OR odorant receptors, are internalized through a mechanism in which β-arrestin mediates an interaction with clathrin and clathrin-coated pits (Mashukova et al., 2006; DeWire et al., 2007). This process can be blocked by overexpression of a peptide comprising amino acids 284–409 of human β-arrestin2 (DN β-arrestin), which functions in a dominant-negative manner to block clathrin-mediated endocytosis of β-arrestin–receptor complexes (Orsini and Benovic, 1998). We therefore asked whether blocking β-arrestin/clathrin-mediated endocytosis would enhance cell surface expression of OlfCc1. Accordingly, when HEK293 cells are cotransfected with expression plasmids encoding OlfCc1 and DN β-arrestin, the intensity of OlfCc1 signal and the number of cells expressing OlfCc1 at their surface are dramatically enhanced (compare Fig. 8B with Fig. 8A).
We next wished to determine whether any interaction between OlfCc1 and punctate OlfC receptors could be demonstrated in heterologous cells. Of 13 punctate receptors transfected individually into HEK293 cells, all failed to localize to the plasma membrane, as judged by immunocytochemistry using anti-epitope tag antibodies (data not shown). Representative examples are shown for two punctate receptors, HA-tagged OlfCu1 and HA-tagged OlfCv1 (Fig. 8C and Fig. 8G, respectively); staining of permeabilized cells with the anti-HA antibody revealed high levels of receptor localized to intracellular membranes (Fig. 8C,G, insets). Cotransfection of these receptor constructs together with DN β-arrestin alone had no effect on cell surface expression (data not shown). In contrast, coexpression with both OlfCc1 and DN β-arrestin resulted in cell surface localization of OlfCu1 and OlfCv1 (Fig. 8D–F and Fig. 8H–J, respectively). These results indicate that OlfCc1 can facilitate the accumulation of punctate OlfC receptors at the plasma membrane of heterologous cells and provide prima facie evidence for a physical interaction between OlfCc1 and the punctate receptors.
Discussion
In the present study, we investigated the functional properties of the orthologous OlfCc1 and Vmn2r1 receptors, Group II V2R/OlfC receptors, which are, respectively, expressed broadly in microvillous olfactory neurons of the fish olfactory epithelium and mammalian vomeronasal organ and coexpressed with the “punctate” members of the V2R/OlfC chemosensory receptor family (Martini et al., 2001; Silvotti et al., 2011). We show that OlfCc1 and Vmn2r1 are calcium-dependent, low-sensitivity amino acid receptors that are preferentially activated by the hydrophobic amino acids isoleucine, leucine, and valine. Loss of function of OlfCc1 in olfactory sensory neurons in embryonic zebrafish leads to dramatically diminished detection of a broad array of structurally diverse amino acids, as determined by functional imaging of olfactory sensory neurons and higher-order neurons in the olfactory bulb. Finally, analysis of receptor expression in heterologous cells indicates that OlfCc1 facilitates the trafficking of other OlfC receptors to the cell surface. Together, these results provide insights into the evolution of the family of V2R/OlfC receptors and the roles of the Group II receptors in chemosensation.
Functional conservation and divergence of mammalian and teleost V2R/OlfC receptors
Phylogenetic analysis of the fish OlfC and mammalian V2R receptors has demonstrated that, although the main subfamilies of punctate receptors are divergent between these two vertebrate classes, the Group II receptors are more highly conserved (Alioto and Ngai, 2006). The Group II receptors demonstrate functional conservation as well: the orthologous zebrafish OlfCc1 and mammalian Vmn2r1 receptors are similarly activated by hydrophobic amino acids in a calcium-dependent manner and are both expressed broadly within the population of microvillous neurons of the olfactory (fish) and vomeronasal (mouse) epithelium. The dependence of receptor activation on calcium likely reflects the similarity of these receptors to the calcium receptor (Alioto and Ngai, 2006), although neither OlfCc1 nor Vmn2r1 can be activated by calcium alone in heterologous cells.
The teleost and mammalian Group II receptors possess an eight-residue motif in their N-terminal domains that is required for binding amino acid ligands (Acher and Bertrand, 2005; Alioto and Ngai, 2006), consistent with our observation that these receptors can be activated by amino acids. The main group of fish OlfC receptors (Group I) is also predicted to comprise amino acid sensors based on the presence of this motif in all family members (Acher and Bertrand, 2005; Alioto and Ngai, 2006). Although activating ligands have yet to be identified for these receptors, the cells in which they are expressed can be activated by amino acids (current study; Koide et al., 2009). In contrast, the amino acid binding motif is absent from the mammalian punctate (Group IV/V) receptors (Alioto and Ngai, 2006), suggesting that they evolved instead to receive nonamino acid cues. Indeed, the V2R-expressing vomeronasal neurons in the mouse detect socially relevant peptides, such as the major urinary peptides (Chamero et al., 2007), and one member of the mouse V2R family can be activated by exocrine secreted peptide 1, a pheromonal cue in mice (Haga et al., 2010).
Group II receptors as chemical sensors in vivo?
The coexpression of mammalian and zebrafish Group II receptors with their respective punctate V2R and OlfC family members represents an intriguing exception to the “one receptor, one neuron” rule, a key tenet of widely held models of olfactory coding (Serizawa et al., 2004; DeMaria and Ngai, 2010). How might coexpression of these receptor subunits affect the reception and coding of olfactory sensory cues? Our present results indicate that OlfCc1 and Vmn2r1 are low-sensitivity receptors for hydrophobic amino acids, with EC50 values for hydrophobic amino acids ranging from ∼250 to ∼400 μm. By comparison, the fish olfactory system displays approximately nanomolar detection thresholds for amino acids (Hara, 1994). Detection of amino acids via the low-affinity Group II receptors could be conferred by virtue of their widespread expression in a large fraction of sensory neurons. In this model, the Group II receptors would signal the presence of the olfactory cue, although discrimination could not occur through the canonical olfactory-labeled line coding strategy involving segregation of receptor-specific inputs in the olfactory bulb (Mombaerts, 2006; DeMaria and Ngai, 2010). Alternatively, at environmentally relevant ligand concentrations, the Group II receptors may not serve as amino acid sensors in vivo. Consistent with this latter scenario, isoleucine and leucine elicit activity in a small number of neurons (Fig. 4), as if only punctate receptors, and not the ubiquitously expressed OlfCc1, are activated by OlfCc1's preferred ligands. Considering that the Group II receptors do not appear to function as amino acid sensors under normal physiological conditions, it is curious that their activation by amino acid ligands has been conserved in species as diverse as fish and mammals, albeit in some hypofunctional form.
Zebrafish have been shown in behavioral assays to discriminate between different amino acids (Miklavc and Valentincic, 2012). Considering that all the zebrafish OlfC receptors are predicted to bind amino acids (Alioto and Ngai, 2006) and different amino acids elicit distinct patterns of activation in the olfactory epithelium (Fig. 4) and olfactory bulb (Friedrich and Korsching, 1997), discrimination of amino acid cues in the environment is likely performed by the punctate OlfC receptors. Thus, the functional specificity of each sensory neuron can still be defined by the single punctate receptor it expresses, with the broadly expressed Group II receptor either providing a parallel stream of low-acuity, low-sensitivity chemosensory information, or serving as a coreceptor that is not itself activated by ligand, variations on the “one receptor, one neuron” rule.
Do the Group II receptors function as coreceptors?
OlfCc1 is required for responses to structurally diverse amino acids by zebrafish in vivo and can promote surface expression of other OlfC family members in cultured cells, suggesting that Group II receptors form heteromultimeric complexes with the punctate receptors with which they are coexpressed in vivo. It is possible that the effects of the antisense oligonucleotide-mediated knockdown of OlfCc1 are the result of other perturbations; downregulation of signaling molecules or even punctate OlfC receptors could explain why responses to amino acids are lost in the OlfCc1 knockdown. Nonetheless, our observation that OlfCc1 promotes cell surface expression of punctate OlfC receptors in HEK cells provides prima facie evidence for heterologous receptor multimerization and may offer hints of a physiological role of such interactions in vivo. For example, Group II receptors may serve as coreceptors that facilitate trafficking of punctate receptors to apical sensory membranes. Epitope-tagged punctate receptors localize diffusely throughout the dendrites and soma of microvillous neurons, however, making it difficult to discern whether knockdown of OlfCc1 expression causes any perturbations in intracellular localization of punctate receptors (data not shown).
Receptor oligomerization has been demonstrated in many GPCR classes (Lohse, 2010; Kniazeff et al., 2011; Audet and Bouvier, 2012), with oligomerization of heterologous subunits a distinctive feature of C family GPCRs (Kniazeff et al., 2011). In the case of the hetero-oligomeric GABAB receptor, the ligand-binding GABABR1 subunit oligomerizes with the GABABR2 subunit by forming C-terminal coiled-coil α-helices (Kammerer et al., 1999); this interaction masks an endoplasmic reticulum (ER) retention signal found in the R1 subunit and thereby allows the receptor complex to exit the ER and reach the cell surface (Margeta-Mitrovic et al., 2000). Although OlfCc1 and the other OlfC receptors lack readily identifiable C-terminal ER retention signals that may participate in such coiled-coil interactions, other mechanisms may facilitate receptor trafficking and/or function. Because OlfCc1 and Vmn2r1 can activate G-protein signaling when expressed on their own, in hetero-oligomeric complexes these receptors may also serve as a bridge between their high-affinity ligand binding partner subunits and downstream G-protein effectors (Lohse, 2010; Kniazeff et al., 2011). Unfortunately, a direct demonstration of OlfCc1-containing multimeric receptors is hampered by the irreversible insolubility of OlfC receptor complexes isolated biochemically from transfected mammalian cells (data not shown).
It is interesting to note that the mammalian T1R taste receptors, C family GPCRs related to the V2R/OlfC receptors, exist as hetero-oligomers comprising 2 of 3 subunit types: T1R1/T1R3 is activated by amino acids and T1R2/T1R3 is activated by sugars and artificial sweeteners (Nelson et al., 2002; Zhao et al., 2003; Chandrashekar et al., 2006). Paralleling our finding that Vmn2r1 and OlfCc1 are low affinity amino acid receptors, T1R3 alone can be activated by naturally occurring sugars, but only at concentrations significantly higher than those required for T1R2/T1R3 activation (Zhao et al., 2003). Similarly, in the Drosophila olfactory system, most odorant receptors, which are expressed in punctate patterns reminiscent of vertebrate ORs, require coexpression of a common receptor, Orco (formerly Or83b) (Vosshall and Hansson, 2011), for localization to apical sensory dendrites (Larsson et al., 2004). In contrast to all vertebrate odorant receptors identified to date, the Drosophila odorant receptors do not adopt a seven transmembrane-spanning topology typical of GPCRs (Benton et al., 2006) and indeed have been shown to comprise a family of ion channels (Sato et al., 2008; Wicher et al., 2008). Thus, the strategy of using a coreceptor has been conserved in diverse receptor types and chemosensory systems spanning vertebrate and invertebrate species.
Footnotes
This work was supported by National Institute on Deafness and Other Communication Disorders Grant R01 DC002253 to J.N., National Institute of General Medical Sciences Grant T32 GM007048 to S.D., and National Human Genome Research Institute Grant T32 HG00047 to S.D. and T.F.; A.P.B. was the recipient of a Graduate Research Fellowship from the National Science Foundation. We thank N. Ryba for providing Vmn2r1 cDNA plasmid; H. Baier, V. Lakhina, and J. Raper for providing transgenic zebrafish lines; and members of our laboratory for helpful discussions over the course of this project.
The authors declare no competing financial interests.
References
- Acher FC, Bertrand HO. Amino acid recognition by Venus flytrap domains is encoded in an 8-residue motif. Biopolymers. 2005;80:357–366. doi: 10.1002/bip.20229. [DOI] [PubMed] [Google Scholar]
- Alioto TS, Ngai J. The repertoire of olfactory C family G protein-coupled receptors in zebrafish: candidate chemosensory receptors for amino acids. BMC Genomics. 2006;7:309. doi: 10.1186/1471-2164-7-309. [DOI] [PMC free article] [PubMed] [Google Scholar]
- Audet M, Bouvier M. Restructuring G-protein-coupled receptor activation. Cell. 2012;151:14–23. doi: 10.1016/j.cell.2012.09.003. [DOI] [PubMed] [Google Scholar]
- Aussel C, Marhaba R, Pelassy C, Breittmayer JP. Submicromolar La3+ concentrations block the calcium release-activated channel, and impair CD69 and CD25 expression in CD3- or thapsigargin-activated Jurkat cells. Biochem J. 1996;313:909–913. doi: 10.1042/bj3130909. [DOI] [PMC free article] [PubMed] [Google Scholar]
- Benton R, Sachse S, Michnick SW, Vosshall LB. Atypical membrane topology and heteromeric function of Drosophila odorant receptors in vivo. PLoS Biol. 2006;4:e20. doi: 10.1371/journal.pbio.0040020. [DOI] [PMC free article] [PubMed] [Google Scholar]
- Buck L, Axel R. A novel multigene family may encode odorant receptors: a molecular basis for odor recognition. Cell. 1991;65:175–187. doi: 10.1016/0092-8674(91)90418-X. [DOI] [PubMed] [Google Scholar]
- Caterina MJ, Schumacher MA, Tominaga M, Rosen TA, Levine JD, Julius D. The capsaicin receptor: a heat-activated ion channel in the pain pathway. Nature. 1997;389:816–824. doi: 10.1038/39807. [DOI] [PubMed] [Google Scholar]
- Celik A, Fuss SH, Korsching SI. Selective targeting of zebrafish olfactory receptor neurons by the endogenous OMP promoter. Eur J Neurosci. 2002;15:798–806. doi: 10.1046/j.1460-9568.2002.01913.x. [DOI] [PubMed] [Google Scholar]
- Chamero P, Marton TF, Logan DW, Flanagan K, Cruz JR, Saghatelian A, Cravatt BF, Stowers L. Identification of protein pheromones that promote aggressive behaviour. Nature. 2007;450:899–902. doi: 10.1038/nature05997. [DOI] [PubMed] [Google Scholar]
- Chandrashekar J, Hoon MA, Ryba NJ, Zuker CS. The receptors and cells for mammalian taste. Nature. 2006;444:288–294. doi: 10.1038/nature05401. [DOI] [PubMed] [Google Scholar]
- Chess A, Simon I, Cedar H, Axel R. Allelic inactivation regulates olfactory receptor gene expression. Cell. 1994;78:823–834. doi: 10.1016/S0092-8674(94)90562-2. [DOI] [PubMed] [Google Scholar]
- Del Bene F, Wyart C, Robles E, Tran A, Looger L, Scott EK, Isacoff EY, Baier H. Filtering of visual information in the tectum by an identified neural circuit. Science. 2010;330:669–673. doi: 10.1126/science.1192949. [DOI] [PMC free article] [PubMed] [Google Scholar]
- DeMaria S, Ngai J. The cell biology of smell. J Cell Biol. 2010;191:443–452. doi: 10.1083/jcb.201008163. [DOI] [PMC free article] [PubMed] [Google Scholar]
- DeWire SM, Ahn S, Lefkowitz RJ, Shenoy SK. Beta-arrestins and cell signaling. Annu Rev Physiol. 2007;69:483–510. doi: 10.1146/annurev.physiol.69.022405.154749. [DOI] [PubMed] [Google Scholar]
- Dey S, Matsunami H. Calreticulin chaperones regulate functional expression of vomeronasal type 2 pheromone receptors. Proc Natl Acad Sci U S A. 2011;108:16651–16656. doi: 10.1073/pnas.1018140108. [DOI] [PMC free article] [PubMed] [Google Scholar]
- Duggan CD, DeMaria S, Baudhuin A, Stafford D, Ngai J. Foxg1 is required for development of the vertebrate olfactory system. J Neurosci. 2008;28:5229–5239. doi: 10.1523/JNEUROSCI.1134-08.2008. [DOI] [PMC free article] [PubMed] [Google Scholar]
- Dynes JL, Ngai J. Pathfinding of olfactory neuron axons to stereotyped glomerular targets revealed by dynamic imaging in living zebrafish embryos. Neuron. 1998;20:1081–1091. doi: 10.1016/S0896-6273(00)80490-0. [DOI] [PubMed] [Google Scholar]
- Friedrich RW, Korsching SI. Combinatorial and chemotopic odorant coding in the zebrafish olfactory bulb visualized by optical imaging. Neuron. 1997;18:737–752. doi: 10.1016/S0896-6273(00)80314-1. [DOI] [PubMed] [Google Scholar]
- Friedrich RW, Korsching SI. Chemotopic, combinatorial, and noncombinatorial odorant representations in the olfactory bulb revealed using a voltage-sensitive axon tracer. J Neurosci. 1998;18:9977–9988. doi: 10.1523/JNEUROSCI.18-23-09977.1998. [DOI] [PMC free article] [PubMed] [Google Scholar]
- Grus WE, Shi P, Zhang YP, Zhang J. Dramatic variation of the vomeronasal pheromone receptor gene repertoire among five orders of placental and marsupial mammals. Proc Natl Acad Sci U S A. 2005;102:5767–5772. doi: 10.1073/pnas.0501589102. [DOI] [PMC free article] [PubMed] [Google Scholar]
- Haga S, Hattori T, Sato T, Sato K, Matsuda S, Kobayakawa R, Sakano H, Yoshihara Y, Kikusui T, Touhara K. The male mouse pheromone ESP1 enhances female sexual receptive behaviour through a specific vomeronasal receptor. Nature. 2010;466:118–122. doi: 10.1038/nature09142. [DOI] [PubMed] [Google Scholar]
- Hara TJ. Olfaction and gustation in fish: an overview. Acta Physiol Scand. 1994;152:207–217. doi: 10.1111/j.1748-1716.1994.tb09800.x. [DOI] [PubMed] [Google Scholar]
- Kammerer RA, Frank S, Schulthess T, Landwehr R, Lustig A, Engel J. Heterodimerization of a functional GABAB receptor is mediated by parallel coiled-coil alpha-helices. Biochemistry. 1999;38:13263–13269. doi: 10.1021/bi991018t. [DOI] [PubMed] [Google Scholar]
- Kniazeff J, Prézeau L, Rondard P, Pin JP, Goudet C. Dimers and beyond: the functional puzzles of class C GPCRs. Pharmacol Ther. 2011;130:9–25. doi: 10.1016/j.pharmthera.2011.01.006. [DOI] [PubMed] [Google Scholar]
- Koide T, Miyasaka N, Morimoto K, Asakawa K, Urasaki A, Kawakami K, Yoshihara Y. Olfactory neural circuitry for attraction to amino acids revealed by transposon-mediated gene trap approach in zebrafish. Proc Natl Acad Sci U S A. 2009;106:9884–9889. doi: 10.1073/pnas.0900470106. [DOI] [PMC free article] [PubMed] [Google Scholar]
- Larsson MC, Domingos AI, Jones WD, Chiappe ME, Amrein H, Vosshall LB. Or83b encodes a broadly expressed odorant receptor essential for Drosophila olfaction. Neuron. 2004;43:703–714. doi: 10.1016/j.neuron.2004.08.019. [DOI] [PubMed] [Google Scholar]
- Lewcock JW, Reed RR. A feedback mechanism regulates monoallelic odorant receptor expression. Proc Natl Acad Sci U S A. 2004;101:1069–1074. doi: 10.1073/pnas.0307986100. [DOI] [PMC free article] [PubMed] [Google Scholar]
- Li J, Mack JA, Souren M, Yaksi E, Higashijima S, Mione M, Fetcho JR, Friedrich RW. Early development of functional spatial maps in the zebrafish olfactory bulb. J Neurosci. 2005;25:5784–5795. doi: 10.1523/JNEUROSCI.0922-05.2005. [DOI] [PMC free article] [PubMed] [Google Scholar]
- Li K. The image stabilizer plugin for ImageJ. 2008. http://www.cs.cmu.edu/∼kangli/code/Image_Stabilizer.html, February 2008.
- Liberles SD, Buck LB. A second class of chemosensory receptors in the olfactory epithelium. Nature. 2006;442:645–650. doi: 10.1038/nature05066. [DOI] [PubMed] [Google Scholar]
- Liberles SD, Horowitz LF, Kuang D, Contos JJ, Wilson KL, Siltberg-Liberles J, Liberles DA, Buck LB. Formyl peptide receptors are candidate chemosensory receptors in the vomeronasal organ. Proc Natl Acad Sci U S A. 2009;106:9842–9847. doi: 10.1073/pnas.0904464106. [DOI] [PMC free article] [PubMed] [Google Scholar]
- Lindsay SM, Vogt RG. Behavioral responses of newly hatched zebrafish (Danio rerio) to amino acid chemostimulants. Chem Senses. 2004;29:93–100. doi: 10.1093/chemse/bjh009. [DOI] [PubMed] [Google Scholar]
- Lohse MJ. Dimerization in GPCR mobility and signaling. Curr Opin Pharmacol. 2010;10:53–58. doi: 10.1016/j.coph.2009.10.007. [DOI] [PubMed] [Google Scholar]
- Luu P, Acher F, Bertrand HO, Fan J, Ngai J. Molecular determinants of ligand selectivity in a vertebrate odorant receptor. J Neurosci. 2004;24:10128–10137. doi: 10.1523/JNEUROSCI.3117-04.2004. [DOI] [PMC free article] [PubMed] [Google Scholar]
- Margeta-Mitrovic M, Jan YN, Jan LY. A trafficking checkpoint controls GABA(B) receptor heterodimerization. Neuron. 2000;27:97–106. doi: 10.1016/S0896-6273(00)00012-X. [DOI] [PubMed] [Google Scholar]
- Martini S, Silvotti L, Shirazi A, Ryba NJ, Tirindelli R. Co-expression of putative pheromone receptors in the sensory neurons of the vomeronasal organ. J Neurosci. 2001;21:843–848. doi: 10.1523/JNEUROSCI.21-03-00843.2001. [DOI] [PMC free article] [PubMed] [Google Scholar]
- Mashukova A, Spehr M, Hatt H, Neuhaus EM. Beta-arrestin2-mediated internalization of mammalian odorant receptors. J Neurosci. 2006;26:9902–9912. doi: 10.1523/JNEUROSCI.2897-06.2006. [DOI] [PMC free article] [PubMed] [Google Scholar]
- Miklavc P, Valentinèiè T. Chemotopy of amino acids on the olfactory bulb predicts olfactory discrimination capabilities of zebrafish Danio rerio. Chem Senses. 2012;37:65–75. doi: 10.1093/chemse/bjr066. [DOI] [PubMed] [Google Scholar]
- Mombaerts P. Genes and ligands for odorant, vomeronasal and taste receptors. Nat Rev Neurosci. 2004;5:263–278. doi: 10.1038/nrn1365. [DOI] [PubMed] [Google Scholar]
- Mombaerts P. Axonal wiring in the mouse olfactory system. Annu Rev Cell Dev Biol. 2006;22:713–737. doi: 10.1146/annurev.cellbio.21.012804.093915. [DOI] [PubMed] [Google Scholar]
- Nelson G, Chandrashekar J, Hoon MA, Feng L, Zhao G, Ryba NJ, Zuker CS. An amino-acid taste receptor. Nature. 2002;416:199–202. doi: 10.1038/nature726. [DOI] [PubMed] [Google Scholar]
- Orsini MJ, Benovic JL. Characterization of dominant negative arrestins that inhibit beta2-adrenergic receptor internalization by distinct mechanisms. J Biol Chem. 1998;273:34616–34622. doi: 10.1074/jbc.273.51.34616. [DOI] [PubMed] [Google Scholar]
- Paquet D, Bhat R, Sydow A, Mandelkow EM, Berg S, Hellberg S, Fälting J, Distel M, Köster RW, Schmid B, Haass C. A zebrafish model of tauopathy allows in vivo imaging of neuronal cell death and drug evaluation. J Clin Invest. 2009;119:1382–1395. doi: 10.1172/JCI37537. [DOI] [PMC free article] [PubMed] [Google Scholar]
- Park HC, Kim CH, Bae YK, Yeo SY, Kim SH, Hong SK, Shin J, Yoo KW, Hibi M, Hirano T, Miki N, Chitnis AB, Huh TL. Analysis of upstream elements in the HuC promoter leads to the establishment of transgenic zebrafish with fluorescent neurons. Dev Biol. 2000;227:279–293. doi: 10.1006/dbio.2000.9898. [DOI] [PubMed] [Google Scholar]
- Prakriya M, Lewis RS. Potentiation and inhibition of Ca(2+) release-activated Ca(2+) channels by 2-aminoethyldiphenyl borate (2-APB) occurs independently of IP(3) receptors. J Physiol. 2001;536:3–19. doi: 10.1111/j.1469-7793.2001.t01-1-00003.x. [DOI] [PMC free article] [PubMed] [Google Scholar]
- Rivière S, Challet L, Fluegge D, Spehr M, Rodriguez I. Formyl peptide receptor-like proteins are a novel family of vomeronasal chemosensors. Nature. 2009;459:574–577. doi: 10.1038/nature08029. [DOI] [PubMed] [Google Scholar]
- Robu ME, Larson JD, Nasevicius A, Beiraghi S, Brenner C, Farber SA, Ekker SC. p53 activation by knockdown technologies. PLoS Genet. 2007;3:e78. doi: 10.1371/journal.pgen.0030078. [DOI] [PMC free article] [PubMed] [Google Scholar]
- Sato K, Pellegrino M, Nakagawa T, Nakagawa T, Vosshall LB, Touhara K. Insect olfactory receptors are heteromeric ligand-gated ion channels. Nature. 2008;452:1002–1006. doi: 10.1038/nature06850. [DOI] [PubMed] [Google Scholar]
- Sato Y, Miyasaka N, Yoshihara Y. Mutually exclusive glomerular innervation by two distinct types of olfactory sensory neurons revealed in transgenic zebrafish. J Neurosci. 2005;25:4889–4897. doi: 10.1523/JNEUROSCI.0679-05.2005. [DOI] [PMC free article] [PubMed] [Google Scholar]
- Scott EK, Mason L, Arrenberg AB, Ziv L, Gosse NJ, Xiao T, Chi NC, Asakawa K, Kawakami K, Baier H. Targeting neural circuitry in zebrafish using GAL4 enhancer trapping. Nat Methods. 2007;4:323–326. doi: 10.1038/nmeth1033. [DOI] [PubMed] [Google Scholar]
- Serizawa S, Miyamichi K, Nakatani H, Suzuki M, Saito M, Yoshihara Y, Sakano H. Negative feedback regulation ensures the one receptor-one olfactory neuron rule in mouse. Science. 2003;302:2088–2094. doi: 10.1126/science.1089122. [DOI] [PubMed] [Google Scholar]
- Serizawa S, Miyamichi K, Sakano H. One neuron-one receptor rule in the mouse olfactory system. Trends Genet. 2004;20:648–653. doi: 10.1016/j.tig.2004.09.006. [DOI] [PubMed] [Google Scholar]
- Silvotti L, Cavalca E, Gatti R, Percudani R, Tirindelli R. A recent class of chemosensory neurons developed in mouse and rat. PLoS One. 2011;6:e24462. doi: 10.1371/journal.pone.0024462. [DOI] [PMC free article] [PubMed] [Google Scholar]
- Speca DJ, Lin DM, Sorensen PW, Isacoff EY, Ngai J, Dittman AH. Functional identification of a goldfish odorant receptor. Neuron. 1999;23:487–498. doi: 10.1016/S0896-6273(00)80802-8. [DOI] [PubMed] [Google Scholar]
- Takahashi K, Tsuchida K, Tanabe Y, Masu M, Nakanishi S. Role of the large extracellular domain of metabotropic glutamate receptors in agonist selectivity determination. J Biol Chem. 1993;268:19341–19345. [PubMed] [Google Scholar]
- Vosshall LB, Hansson BS. A unified nomenclature system for the insect olfactory coreceptor. Chem Senses. 2011;36:497–498. doi: 10.1093/chemse/bjr022. [DOI] [PubMed] [Google Scholar]
- Wellendorph P, Bräuner-Osborne H. Molecular basis for amino acid sensing by family C G-protein-coupled receptors. Br J Pharmacol. 2009;156:869–884. doi: 10.1111/j.1476-5381.2008.00078.x. [DOI] [PMC free article] [PubMed] [Google Scholar]
- Wicher D, Schäfer R, Bauernfeind R, Stensmyr MC, Heller R, Heinemann SH, Hansson BS. Drosophila odorant receptors are both ligand-gated and cyclic-nucleotide-activated cation channels. Nature. 2008;452:1007–1011. doi: 10.1038/nature06861. [DOI] [PubMed] [Google Scholar]
- Yang H, Shi P, Zhang YP, Zhang J. Composition and evolution of the V2r vomeronasal receptor gene repertoire in mice and rats. Genomics. 2005;86:306–315. doi: 10.1016/j.ygeno.2005.05.012. [DOI] [PubMed] [Google Scholar]
- Zhao GQ, Zhang Y, Hoon MA, Chandrashekar J, Erlenbach I, Ryba NJ, Zuker CS. The receptors for mammalian sweet and umami taste. Cell. 2003;115:255–266. doi: 10.1016/S0092-8674(03)00844-4. [DOI] [PubMed] [Google Scholar]