

Abstract
Neuropeptide Y (NPY) neurons in both the arcuate nucleus of the hypothalamus (ARH) and the dorsomedial hypothalamus (DMH) have been implicated in food intake and obesity. However, while ARH NPY is highly expressed in the lean animal, DMH NPY mRNA expression is observed only after diet-induced obesity (DIO). Furthermore, while ARH NPY neurons are inhibited by leptin, the effect of this adipokine on DMH NPY neurons is unknown. In this study we show that in contrast to the consistent expression in the ARH, DMH NPY mRNA expression was undetectable until after 10 weeks in mice fed a high-fat diet, and peaked at 20 weeks. Surprisingly, electrophysiological experiments demonstrated that leptin directly depolarized and increased the firing rate of DMH NPY neurons in DIO mice. To further differentiate the regulation of DMH and ARH NPY populations, fasting decreased expression of DMH NPY expression, while it increased ARH NPY expression. However, treatment with a leptin receptor antagonist failed to alter DMH NPY expression, indicating that leptin may not be the critical factor regulating mRNA expression. Importantly, we also demonstrated that DMH NPY neurons coexpress cocaine amphetamine-regulated transcript (CART); however, CART mRNA expression in the DMH peaked earlier in the progression of DIO. This study demonstrates novel and important findings. First, NPY and CART are coexpressed in the same neurons within the DMH, and second, leptin stimulates DMH NPY neurons. These studies suggest that during the progression of DIO, there is an unknown signal that drives the expression of the orexigenic NPY signal within the DMH, and that the chronic hyperleptinemia increases the activity of these NPY/CART neurons.
Introduction
A complex network of brain and peripheral systems interact to maintain body weight and energy balance. One of the key feedback signals from adipose tissue is leptin, which influences energy balance through actions in the brain (Zhang et al., 1994; Spiegelman and Flier, 2001; Friedman, 2009). In the arcuate nucleus of hypothalamus (ARH), neuropeptide Y (NPY)/agouti related peptide (AgRP) neurons promote feeding and are directly inhibited by leptin (Stephens et al., 1995; Ahima et al., 1996; Schwartz et al., 1996). In contrast, pro-opiomelanocortin (POMC)/cocaine amphetamine-regulated transcript (CART) neurons produce anorexigenic peptides under direct stimulation of leptin (Elias et al., 1998; Elmquist et al., 1999; Cowley et al., 2001).
The dorsomedial hypothalamus (DMH) is also an important orexigenic center, as animals with DMH lesions are hypophagia and loose weight (Bellinger et al., 1986; Bernardis et al., 1986; Bellinger and Bernardis, 2002). Additionally, rats with DMH lesions are partially resistant to diet-induced obesity (DIO) (Bernardis and Bellinger, 1986, 1991). Similar to the ARH, the DMH also contain NPY-expressing neurons. However, while NPY mRNA is constitutively expressed in the ARH, NPY is expressed in the DMH only during chronic hyperphagic conditions such as postnatal development, lactation, and chronic obesity (Kesterson et al., 1997; Guan et al., 1998; Li et al., 1998; Tritos et al., 1998; Grove et al., 2001). Previous studies by Chao et al. (2011) and Zheng et al. (2013) demonstrated that overexpression of DMH NPY caused hyperphagia and obesity, and knockdown of DMH NPY expression ameliorated the metabolic phenotypes in DIO rats, suggesting that DMH NPY induction is a key element either in the development or maintenance of obesity. One of the main characteristics of obese animal models is hyperleptinemia, which has been suggested to contribute to the state of leptin resistance (Lin et al., 2000; Münzberg et al., 2004). While leptin has been shown to have direct activation of neurons within the DMH, there is limited evidence about the neurochemical phenotype of leptin responsive neurons (Elias et al., 1998, 2001; Patterson et al., 2011; Bechtold et al., 2012; Laque et al., 2013; Lee et al., 2013).
CART is also expressed in the DMH, and the expression of this neuropeptide is under the direct regulation of circulating leptin (Elias et al., 2001). A previous study showed that CART mRNA expression is upregulated in the DMH in DIO mice (Yu et al., 2008). Although CART was initially discovered as an anorectic peptide (Kristensen et al., 1998), there is also evidence that it can be orexigenic (Abbott et al., 2001; Hou et al., 2010).
The primary purpose of this study was to investigate the time course of NPY mRNA induction in the DMH during the progression of DIO. Furthermore, we investigated the regulation of DMH NPY neurons by leptin through investigation of (1) cellular markers of leptin actions, (2) electrophysiological responses to leptin, and (3) effects of leptin receptor antagonist treatment. We also characterized the time course of CART induction during DIO and determined whether NPY mRNA is coexpressed in CART neurons.
Materials and Methods
Animals
Four-week-old C57BL/6 male mice were purchased from the Jackson Laboratory for in situ hybridization experiments. For immunohistochemical experiments, hemizygous NPY-hrGFP male mice on a C57BL/6 background were purchased from the Jackson Laboratory (stock #006417) for breeding. These mice express humanized renilla reniformis green fluorescent protein (hrGFP) under the control of the mouse NPY promoter. NPY-hrGFP male mice were bred to C57BL/6 female mice (purchased from Jackson Laboratory) to generate the experimental animals. The litters were normally born and the pups were toe-clipped for identification and genotyping. Five mice were group housed in the same cage and maintained under a 12 h light/dark cycle (lights on at 7:00 A.M.) and constant temperature (23 ± 2°C). Food and water were provided ad libitum. For the electrophysiology studies, NPY hrGFP mice on a C57BL/6 background were purchased from Jackson Laboratory, and were housed under a 12 h light/dark cycle. They were fed standard chow diet (CD; Purina lab chow #5001). Animals were housed in groups of four males and kept under standard laboratory conditions with access to food and water ad libitum. Mice were kept on a high-fat diet (HFD) for minimum of 3 months before experiments were started. All animal procedures were approved by the Oregon National Primate Research Center Institutional Animal Care and Use Committee or the Monash University Animal Ethics Committee.
Diet treatment
To generate DIO mice, 5-week-old C57BL/6 mice were fed a 60% HFD (Research Diets; catalog #D12492) or normal CD (Purina lab chow #5001) for 2, 10, 16, and 20 weeks (n = 5 for each group). A second cohort of the 20 week HFD animals were fasted for 24 h before being killed. C57BL/6 mice were chosen because they have been widely used and known to be more susceptible to DIO compared to other strains of mice (Surwit et al., 1988). The same diet treatment regime was used for the study with NPY-hrGFP mice. Animals were killed in the morning at the end of diet treatment, and food was removed from the cage 3 h before the tissue collection. HFD and CD mice brains were collected fresh frozen for in situ hybridization experiments and trunk bloods were collected for hormonal assay. The brains from NPY-hrGFP mice were collected after transcardial perfusion with 4% paraformaldehyde containing sodium phosphate buffer, pH 7.4.
Leptin and insulin measurements
For leptin and insulin measurements, the serum was separated from collected trunk blood samples and aliquoted for radioimmunoassay (RIA). Leptin and insulin RIAs were performed by the ONPRC Endocrine Service Lab using the leptin (Linco Research; catalog #ML-82K) and insulin (Linco Research; catalog #RI-13K) RIA kits with a lower detection threshold of 0.5 ng/ml.
In situ hybridization
The fresh frozen brains (n = 5 per group) were sectioned (20 μm) on a cryostat in a one-in-three coronal series through the caudal hypothalamus containing the DMH and ARH. For NPY antisense probe, the plasmid (obtained from Dr. S. L. Sabol, National Institutes of Health, Bethesda, MD) contained 511 bp NPY cDNA, and a cRNA probe was transcribed using T3 RNA polymerase in which 25% of the uridine 5-triphosphate was 35S-labeled (PerkinElmer) as described previously (Li et al., 1998). For CART antisense probe, the plasmid was obtained from Drs. J. K. Elmquist and C. F. Elias (University of Texas Southwestern Medical Center, Dallas, TX) (Elias et al., 2001) and the 35S-labeled cRNA probe was generated with the T3 RNA polymerase. Brain sections were fixed, dehydrated, delipidated, rehydrated, and then air dried, as previously described (Li et al., 1998). The sections were exposed to the labeled NPY or CART probe overnight in a humidified chamber at 55°C. After incubation, the slides were washed, dehydrated, and dried. The slides were then exposed to Kodak Biomax MR film (Fischer Scientific; catalog #870 1302) overnight and then developed. Following film exposure, slides were dipped in NBT2 emulsion (Kodak; catalog #889 5666) diluted 1:1 in 600 mm ammonium acetate, placed in light-tight boxes containing desiccant, and stored at 4°C for 7 d. The slides were developed and counterstained with thionin, and the distribution of silver grains was visualized by dark-field microscopy. For the analysis, DMH and ARH film images were captured using a CoolSNAP charge-coupled camera (Photometrics) and analyzed using the MetaMorph Imaging system (Universal Imaging). The images were analyzed using a sampling box that encompassed the entire region of interest and measured as the integrated intensity. Background labeling, determined using the same sampling box over an adjacent region that contained no NPY or CART mRNA expression, was subtracted from this measurement.
Double-label in situ hybridization
Simultaneous visualization of NPY and CART mRNA in the DIO mice brain (n = 3) was performed as reported previously (Scarlett et al., 2007), with slight modifications. Coronal sections (20 μm) were cut on a cryostat and thaw-mounted onto Superfrost Plus slides (VWR Scientific). Antisense 33P-labeled rat CART riboprobe and antisense digoxigenin-labeled rat NPY riboprobe were denatured, dissolved in hybridization buffer along with tRNA (1.7 mg/ml), and applied to slides. Slides were covered with glass coverslips, placed in a humid chamber, and incubated overnight at 55°C. The following day, slides were treated with RNase A and washed under conditions of increasing stringency. The sections were incubated in blocking buffer and then in Tris buffer containing anti-digoxigenin fragments conjugated to alkaline phosphatase (Roche Molecular Biochemicals), diluted 1:250 for 3 h at room temperature. NPY cells were visualized with Vector Red substrate (Vector Laboratories; catalog #SK-5100) according to the manufacturer's protocol. Slides were dipped in 100% ethanol, air dried, and then dipped in NTB-2 liquid emulsion (Eastman Kodak). Slides were developed 7 d later and coverslipped. NPY (red) and CART (black silver grain) mRNA-containing cells from both left and right side of the DMH were identified and counted under a bright-field microscope (3 sections per animal; n = 3).
Double-labeled immunofluorescence
NPY-hrGFP mice were used for the NPY and CART colocalization study because NPY immunoreactivity (ir) is not detectable in cell bodies. NPY-hrGFP mice (n = 3 per group) were anesthetized with tribromoethanol (20 mg/kg body weight, i.p) and perfused with 0.9% ice-cold saline solution and then 4% paraformaldehyde containing sodium phosphate buffer, pH 7.4. The brains were post-fixed in the paraformaldehyde overnight and transferred to 25% sucrose buffer solution. The brains were then frozen and sectioned at 25 μm on a microtome in one-in-six series. The tissue sections were washed in 0.05 m potassium PBS (KPBS) several times and preincubated in blocking buffer (KPBS plus 0.4% Triton X-100 plus 2% normal donkey serum) for 30 min before incubating in 1:5000 rabbit anti-CART (Phoenix Pharmaceuticals; catalog #CA H-003-62) containing blocking buffer for 48 h at 4°C. Following washes in KPBS, tissue sections were incubated for 1 h in 1:1000 Alexa Fluor 568 donkey anti-rabbit antibody (Invitrogen; catalog #A10042) at room temperature, then subsequently washed and mounted on gelatin-coated glass slides and coverslipped with SlowFade Gold antifade reagent (Invitrogen; catalog #S36936).
Leptin injection, pSTAT3, and c-fos immunohistochemistry
Leptin injection.
Leptin responsiveness was assessed by quantifying phosphorylated signal transducer and activator of transcription-3 (pSTAT3)-immunoreactive cells in response to leptin in 20 weeks HFD-fed versus CD diet-fed NPY-hrGFP mice. Animals were sham injected for 7 d before testing and fasted from 7:00 A.M. to 11:00 A.M. on testing day. Mice were injected with saline or leptin (Preprotech, catalog #450-31; 2 μg leptin per gram body weight, i.p.) at 11:00 A.M. After 45 min, mice were sedated with tribromoethanol and perfused transcardially with saline followed by ice-cold, borate-buffered 4% paraformaldehyde, pH 9.5. Perfused brains were sectioned (25 μm) on a microtome in a one-in-six coronal series through the hypothalamus.
pSTAT3.
pSTAT3 immunohistochemistry was performed as described previously (Draper et al., 2010) on every third section, using 1:250 rabbit anti-pSTAT3 antibody (Cell Signaling Technology; catalog #9145). For the leptin-induced pSTAT3-ir in NPY neurons, three sections per animal from three different animals were selected for the analysis. Sections were visualized with a 20× objective using a Nikon Eclipse E800 microscope. The area of interest was simultaneously illuminated with fluorescence to visualize the hrGFP and bright-field light to visualize the pSTAT3-ir. The total number of NPY-GFP neurons as well as the number of NPY neurons containing pSTAT3-ir was counted for each section.
c-Fos.
For c-Fos immunohistochemistry, a second series of sections were then incubated with rabbit anti-c-Fos antibody (1:20,000; Santa Cruz Biotechnology) in blocking buffer for 48 h. After incubation, the tissue was rinsed in KPBS, incubated in biotinylated donkey anti-rabbit IgG (1:600; Jackson ImmunoResearch) in KPBS with 0.4% Triton X-100 for 1 h and then washed and incubated in avidin-biotin solution (Vectastain; Vector Laboratories) for 1 h. c-Fos-ir was visualized with 3,3′-diaminobenzidine enhanced with nickel chloride. Tissue sections were mounted on gelatin-coated glass slides, and coverslipped. Two sections per animal from three different animals were selected for the analysis. Sections were visualized with a 20× objective using a Nikon Eclipse E800 microscope. The area of interest was simultaneously illuminated with fluorescence to visualize the hrGFP and bright-field light to visualize the c-Fos. The total number of NPY-GFP neurons as well as the number of NPY neurons containing c-Fos-ir were counted for each section.
Leptin receptor antagonist and NPY and CART expression
Male C57BL/6J mice were placed on a HFD (SF04–001 Specialty Feeds) at 4 weeks of age and remained on the HFD for 20 weeks. After 20 weeks, mice were implanted with lateral ventricle brain cannulas (−0.5 posterior, 1 mm lateral to bregma) under isoflurane anesthesia. Mice were then placed in home cages for 1 week of recovery; body weight and food intake were monitored daily. All mice were then injected into lateral ventricle cannulas twice daily (at the start of light period and twelve hours later just at the beginning of the dark period) with artificial CSF (aCSF; 0.5 μl). The following day, the mice were injected with either aCSF (n = 6) or leptin receptor antagonist (n = 6; 0.5 μl of 5 μg/μl mouse leptin antagonist mutant L39A/D40A/F41A; Protein Laboratories Rehovot) at the beginning of the light period, the end of the light period on day 1, and the beginning of the light period on day 2. Three hours following the final injection, mice were killed and the brains were fresh frozen, and in situ analysis for NPY mRNA was then performed (as described above). To confirm that intracerebroventricular leptin antagonist sufficiently blocked the effects of circulating leptin within the DMH, a separate cohort of cannulated DIO animals were treated with a single intracerebroventricular injection of the leptin antagonist (0.5 μl of 5 μg/μl), followed by peripheral administration of leptin (2 μg per gram of body weight). The animals were killed 45 min later and processed for histochemistry for pSTAT3-ir, as described above (n = 3–5 animals per group). Brains were serially sectioned at 30 μm. Every fourth section was stained for pSTAT3 IHC. All pSTAT3 positive cells were counted from four DMH sections per animal.
Electrophysiology of leptin actions on DMH and ARH NPY neurons
Brain slice preparation.
Mice were anesthetized with intraperitoneal injection of tribromoethanol and transcardially perfused with ice-cold oxygenated cutting solution containing the following (in mm): 208 sucrose, 2 KCl,1 MgCl2, 1.25 NaH2PO4, 26 NaHCO3, 2 MgSO4, 1 CaCl2, 10 HEPES, and 10 glucose, pH 7.4 with NaOH, continuously aerated. Brains were quickly dissected, and 250 μm hypothalamic slices were cut using a vibratome. Hypothalamic slices were incubated at 34°C for 20–30 min in warm oxygenated aCSF. All experiments were performed at room temperature and completed within 4–5 h of slicing to ensure cell viability. Artificial CSF consisted of the following (in mm): 124 NaCl, 5 KCl, 2 MgCl2, 2.6 NaH2PO4, 26 NaHCO3, 2 MgSO4, 2 CaCl2, 10 HEPES, and 10 glucose, pH 7.4 with NaOH2. Drugs 6-cyano-7-nitroquinoxaline-2,3-dione (CNQX) and dl-2-amino-5 phosphonovaleric acid (AP5) were obtained from Tocris Bioscience. Murine leptin was obtained from Pepro Tech.
Electrophysiology.
Whole-cell patch-clamp recordings were made from the soma of NPY neurons. Neurons were identified using a Carl Zeiss Axioskop 2 FS fitted with epifluorescence and infrared differential contrast video upright microscopy. The effects of inhibition and activation of NPY neurons were determined by analysis of spontaneous action potential firing and membrane potential change in whole-cell current-clamp conditions. We used an Axopatch 200B (Molecular Devices) amplifier interfaced to a Dell computer. Patch pipettes were pulled from borosilicate glass capillaries with inner filaments (World Precision Instruments) using a pp-830 electrode puller (Narishige Scientific Lab Instrument) and had resistances of 2–4 MΩ when filled with an internal pipette solution containing the following (in mm): 125 K-gluconate, 2 KCl, 5 MgATP, 0.3 NaGTP, 10 EGTA, 5 HEPES, and 0.05% neurobiotin, adjusted to pH 7.4 with NaOH.
Whole-cell capacitance and resistance were electronically compensated. Adequate whole cell access (Ra < 20 MΩ) and membrane resistance (>500 MΩ) were verified at the beginning and the end of recording. Slices were continuously perfused with aerated aCSF using a gravity-fed perfusion system with a flow rate of 2–3 ml/min. Data was collected using pCLAMP10 (Molecular Devices) at a sample frequency of 20 kHz, with low-pass filtering at 2 kHz.
Confocal microscopy
Confocal laser microscopy was used to analyze the double-label immunofluorescence images for colocalization. The Leica spectral confocal microscope system (Leica TCS SP), consisting of a Leica RBE inverted microscope, an Ar laser-producing light at 488 nm (for visualization of GFP), and a Kr laser-producing light at 568 nm (for visualizing Alexa 568) was used to scan the images. Various objectives (25×, 0.75 numerical aperture, and 40×, 1.25 numerical aperture) were used to scan and capture images. For each experiment, fluorophore signals were checked individually for bleed-through to the apposing detector. All bleed-through was eliminated by adjusting laser intensity and detector window width. To assess colocalization of two signals, a series of continuous optical sections, 1 μm intervals along the z-axis of the tissue section, were sequentially scanned for each fluorescent signal. The signals were obtained for each fluorophore on one series of optical sections and stored separately as a series of 512 × 512 pixel images. The stacks of individual optical slices were analyzed using the ImageJ software to determine colocalization. The brightness and contrast of the images were adjusted in Photoshop to match microscope visualization (Adobe Systems).
Data analysis
Results are shown as mean values ± SEM. Body weight measurements and HFD and time course effects on leptin/insulin levels and NPY/CART mRNA expression were analyzed by two-way ANOVA, followed by Bonferroni's post hoc test. For c-Fos and pSTAT3 IHC after intraperitoneal leptin treatment, t test was used to determine significant difference between groups. For leptin antagonist study, t test was used to compare the expression of NPY and CART mRNA in the DMH, and one-way ANOVA, followed by Bonferroni's test, was used to compare pSTAT3-ir in all groups. p < 0.05 was considered statistically significant. Analyses were performed with GraphPad Prism 5.0 (GraphPad Software).
Electrophysiological recordings were analyzed with Clampfit-10 software (Molecular Devices). All membrane potentials were corrected by −5 mV for liquid junction potential in final analysis. Paired t test was used to compare action potential firing percentage of NPY neurons between control and treatment duration; and the p value for significance was set at 0.05. Similar statistical parameters were used to analyze the change in membrane potential before and after treatment (GraphPad Software). All data are expressed as means ± SEM. For event analysis of spontaneous action potential firing under current-clamp conditions, Mini Analysis software (Synaptosoft) was used. The record was analyzed for action potential firing 3 min before and after 5 min treatment with leptin. To quantify the frequency of number of events before and after the application of leptin, the calculated events were divided by bin size (time).
Results
Characterization of DIO mice
Mice fed a HFD exhibited rapid weight gain during the first 10 weeks of diet treatment (Weeks 0–2, CD, 0.13 g/d; HFD, 0.40 g/d; Weeks 2–10, CD, 0.11 g/d; HFD, 0.30 g/d; Weeks 10–20, CD, 0.06 g/d; HFD, 0.13 g/d) and were 61% heavier than CD mice at 20 weeks (Fig. 1A). Serum leptin levels were tripled during the first 2 weeks on the HFD and were further increased in HFD mice after 10 weeks (Fig. 1B), at which time steady-state levels were achieved. Even though CD mice gained weight over the 20 weeks of study, there was not a significant change in leptin levels. While 20 week CD mice exhibited a significant decrease in serum leptin levels after 24 h fasting, no significant decrease in leptin levels was observed in HFD mice after the fast (Fig. 1C). In contrast to leptin, insulin levels did not change in HFD animals compared to CD animals during the first 2 weeks. However, a significant increase in serum insulin levels was detected at 10 weeks in HFD mice compared to the CD mice (Fig. 1D), with a further increase in HFD mice after 16 weeks. CD mice also showed an increase in insulin levels with age, but not until 20 weeks of study. Fasting caused a significant decrease in insulin levels in both groups, although the HFD animals retained elevated levels relative to the fasted CD mice (Fig. 1E).
Figure 1.

Progression of diet-induced obesity in mice. Five-week-old C57BL/6 male mice were fed with either HFD or CD for 2, 10, 16, and 20 weeks. For the fasted groups, 20 week HFD and CD mice were fasted for 24 h. A, The changes in body weight during 20 weeks HFD versus CD treatment. B, C, Serum leptin concentration. D, E, Serum insulin concentration. Results are shown as mean values ± SEM (n = 5, per group, per time point). *p < 0.05 (represents a diet effect at each time point analyzed by two-way ANOVA, for each group); #p < 0.05 (represents a within-diet-treatment effect caused by time or fasting, analyzed by two-way ANOVA).
Time course of NPY induction in the DMH
Using in situ hybridization, we demonstrated the time course of NPY mRNA induction in the DMH during development of obesity. Consistent with a previous report (Guan et al., 1998), there was no visible NPY mRNA expression in the DMH of CD mice at any time point (Fig. 2A,B). DMH NPY mRNA levels in 2 week HFD-fed mice were similar to that in CD-fed mice (Fig. 2B). However, after 10 weeks, NPY induction in the DMH was apparent in HFD mice, and NPY mRNA level was further significantly increased between 16 and 20 weeks of HFD feeding (Fig. 2A,B). In contrast, ARH NPY mRNA level was not different between HFD and CD mice at any time point, although there tended to be a decrease with age in the HFD animals (Fig. 2C). As expected, fasting increased NPY expression in the ARH in both CD and HFD mice (Fig. 2C). In contrast, 24 h fasting led to a significant reduction in DMH NPY expression in HFD mice (Fig. 2B).
Figure 2.
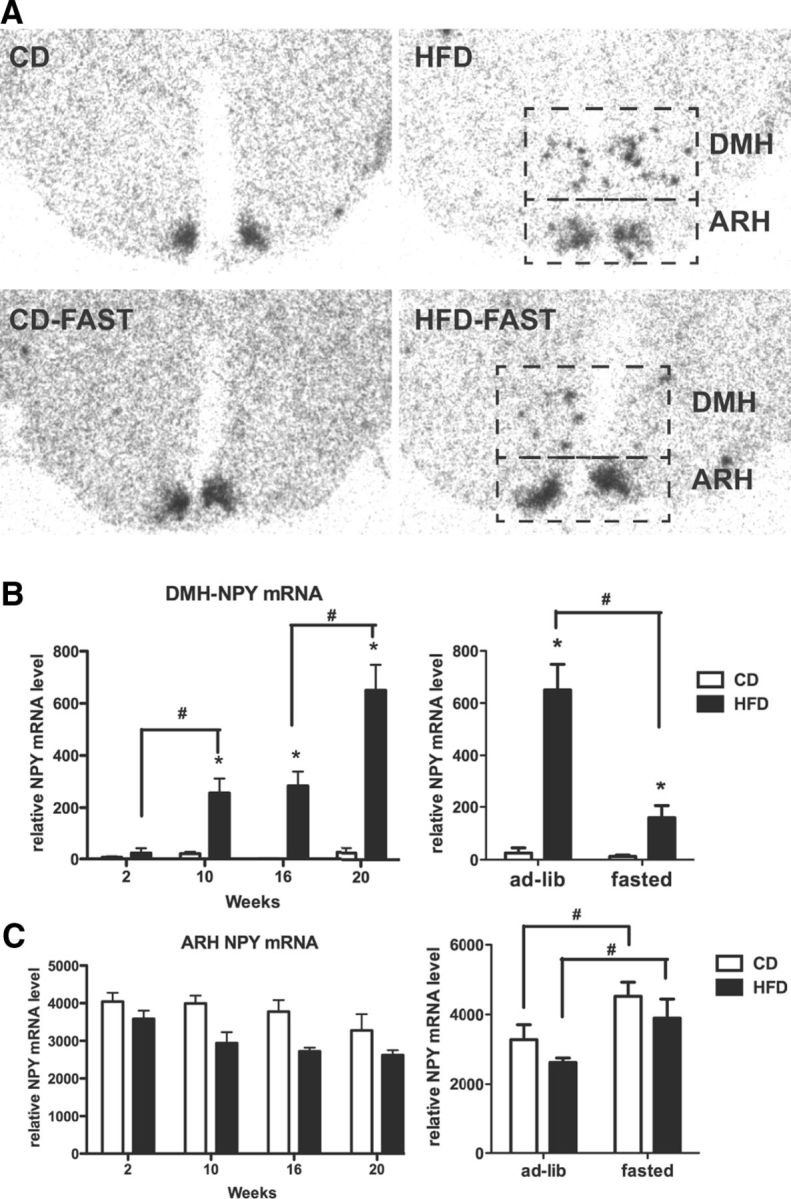
Progression of NPY mRNA induction in the DMH during DIO. A, Representative photomicrographs for DMH and ARH NPY mRNA expression in HFD and CD mice at 20 weeks (top panels) and 20 weeks with a 24 h fast (bottom panels). B, C, Quantitative analysis of mRNA expression in the DMH (B) and ARH (C) without (left panels) and with (right panels) a 24 h fast. A two way ANOVA was used to investigate a diet and time/fasted effect. *p < 0.05 (significant diet effect); #p < 0.05 (significant within-diet-group time effect). n = 4–5 per group.
NPY neurons in the DMH are leptin sensitive in DIO mice
Since ARH NPY neurons express a signaling form of leptin receptor ObRb (Bates et al., 2003), we investigated the presence of leptin signaling in DMH NPY neurons in DIO mice. DIO and CD NPY-hrGFP mice were injected with leptin (2 μg/g, i.p.) and pSTAT3-ir and c-Fos-ir were visualized in ARH and DMH NPY cells (Figs. 3A,B, 4A,B). As expected, the number of ARH NPY neurons colocalized with pSTAT3-ir were significantly higher in CD mice compared to that of HFD mice (Fig. 4A–C), confirming the presence of leptin resistance in the ARH. Consistent with previous reports (Münzberg et al., 2004; Enriori et al., 2007; Glavas et al., 2010), pSTAT3-ir staining was abundant in the DMH of both CD and HFD mice after leptin treatment (Fig. 3C). In HFD mice, 64 ± 2% of NPY-GFP neurons contained pSTAT3-ir activation in the DMH (Fig. 3D), suggesting a direct action of leptin on DMH NPY neurons. Since NPY-GFP cells are undetectable in CD mice, no colocalization between NPY-GFP and pSTAT3 activation was observed.
Figure 3.

Leptin-induced pSTAT3 and c-Fos immunoreactivity in DMH NPY neurons in DIO mice. A, Left, pSTAT3-ir in the DMH 45 min after leptin administration (2 μg/g, i.p.) in 20 week HFD mice. Middle, NPY expression in the DMH as represented by immunoreactivity for GFP. The dashed boxes indicate the area represented in the high magnification panels (right). Right, Higher magnification illustrating pSTAT3-ir (black arrows) in NPY-GFP neurons (white arrows). B, Left, c-Fos-ir in the DMH 45 min after leptin administration (2 μg/g, i.p.) in 20 week HFD mice. Middle, NPY expression in the DMH as represented by immunoreactivity for GFP. The dashed boxes indicate the area represented in the high magnification panels (right). Right, Higher magnification illustrating c-Fos-ir (black arrows) in NPY-GFP neurons (white arrows). DMC, Compact portion of the DMH; DMV, ventral portion of the DMH; 3V, third ventricle. C, The bar graph shows the number of pSTAT3-immunoreactive cells from four DMH anatomically matched sections per animal (CD, n = 3; HFD, n = 4). D, The bar graph shows the number of NPY-GFP neurons containing pSTAT3-ir from DMH sections (n = 3 per group). Results are expressed as mean ± SEM. *p < 0.05 by t test.
Figure 4.
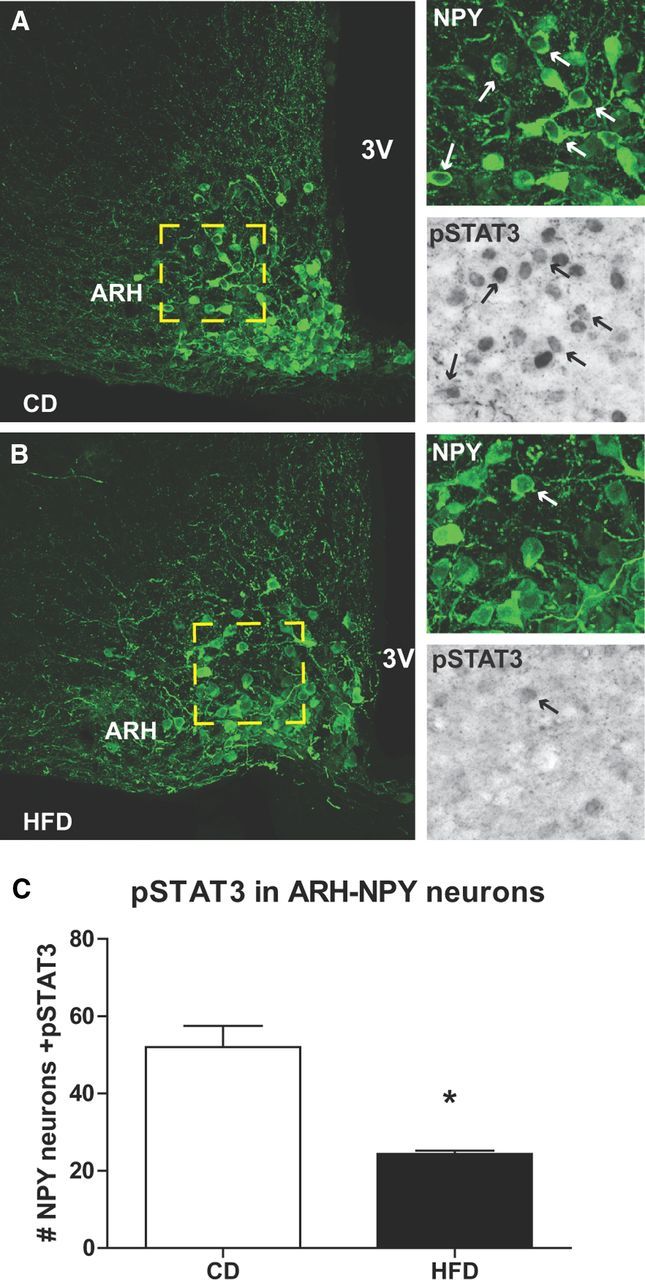
Leptin-induced pSTAT3 immunoreactivity in ARH NPY neurons in DIO mice. A, B, pSTAT3 activation in the ARH NPY-hrGFP cells 45 min after leptin (2 μg/g, i.p.) administration in 20 week CD (A) and HFD (B) mice. The arrows indicate NPY-GFP neurons (white) containing pSTAT3 (black). C, The bar graph shows the number of NPY-GFP neurons containing pSTAT3-ir from two ARH anatomically matched sections per animal (n = 3). The results are expressed as mean ± SEM. *p < 0.05 by t test.
Similar to pSTAT3 responses, leptin stimulated c-Fos-ir was higher in the ARH of the CD mice compared to that of HFD mice. However, there were few c-Fos-ir ARH NPY cells in either CD or HFD (data not shown) mice, compared to pSTAT3-positive neurons, which is consistent with the previous reports that ARH NPY neurons are inhibited by leptin. The c-Fos-ir was comparable in the DMH between CD and HFD mice (data not shown). Importantly, in HFD mice, 47 ± 6% of NPY-GFP neurons (n = 4) contained c-Fos-ir in the DMH. Since NPY-GFP cells are undetectable in CD mice, no colocalization was observed. This is the first study demonstrating that NPY neurons in the DMH are under the direct regulation of leptin in obesity, and the first indication that this signaling may be excitatory.
NPY neurons in the DMH are excited directly by leptin in DIO
To confirm that leptin has direct postsynaptic excitatory effects on DMH NPY neurons in DIO mice, we used 20 μm CNQX (a specific antagonist of AMPA receptors) and 20 μm AP5 (a specific antagonist of NMDA receptors) to block presynaptic excitatory inputs to the NPY neurons. CNQX and AP5 induced an expected mild hyperpolarization in DMH NPY neurons (Fig. 5A), from −59.6 ± 1.5 mV to −61.8 ± 1.8 mV (n = 16; six animals). Once the cell reached a stable membrane potential with the CNQX and AP5, we perfused the slices with leptin (100 nm). Of 16 cells, leptin caused a significant depolarization in 12 DMH NPY neurons, averaging from −61.8 ± 1.8 mV to −50.6 ± 3.3 mV (Fig. 5A). The effect was highly variable with a range of depolarization between 2.5 and 25 mV. Furthermore, leptin also increased action potential firing frequency without a significant change in amplitude in 40% of the cells (5 of 12). On average, the leptin increased the firing frequency from 1.75 ± 0.8 to 2.8 ± 1.08 Hz (Fig. 5B). As confirmation of our techniques, we also demonstrated that leptin caused hyperpolarization and a decrease in firing rate of NPY neurons in the ARH (Fig. 5C), which is consistent with previous reports (Cowley et al., 2001). It should be noted that the effect of leptin was long lasting, and we were only partially able to wash it off in 4 out of 12 cells, which responded to leptin. Therefore, we used only one cell per slice to study effects of leptin, and slices were replaced after leptin application regardless of the response.
Figure 5.

Leptin induces postsynaptic depolarization and increased firing frequency in DMH NPY neurons. A. Left, Representative tracing for a current-clamp recording of DMH NPY neurons from a DIO animal. Right, Analysis of average change in membrane potential with different treatments (n = 16, 4 nonresponders, 6 animals; ANOVA; p = 0.0004). B, Left, Example of current-clamp recording demonstrating increased spontaneous action potential firing and depolarization of DMH NPY neurons after leptin treatment. Middle, Histogram showing number of firing events per minute. Right, Bar graph showing analysis of firing frequency before and after leptin exposure (paired t test, p = 0.0097; n = 12 with 5 responders). C, Example of current-clamp recording demonstrating suppressed spontaneous action potential firing and hyperpolarization of ARH NPY neurons after leptin treatment, postsynaptically (53.1 ± 1.1 mV to −62.1 ± 2.3 mV; n = 3).
Leptin receptor antagonist
The above surprising results indicated that leptin has contrasting effects on NPY neurons in the ARH and the DMH. To determine whether the hyperleptinemia associated with DIO is responsible for the increased NPY expression in the DMH, we tested the effect of leptin receptor antagonist treatment (Shpilman et al., 2011; Beltrand et al., 2012; Mela et al., 2012) on NPY expression in the DMH. Treatment of DIO animals (intracerebroventricularly) with the leptin antagonist for ∼36 h (with three doses of 2.5 μg) neither changed food intake nor body weight (data not shown), nor altered DMH NPY expression (Fig. 6A). However, intracerebroventricular treatment with the same dose of leptin antagonist was able to completely block pSTAT3-ir in the DMH in response to peripherally administered leptin (2 μg/gm of body weight, i.p.), indicating that intracerebroventricular administration of this compound could suppress leptin actions in the DMH (Fig. 6B,C).
Figure 6.
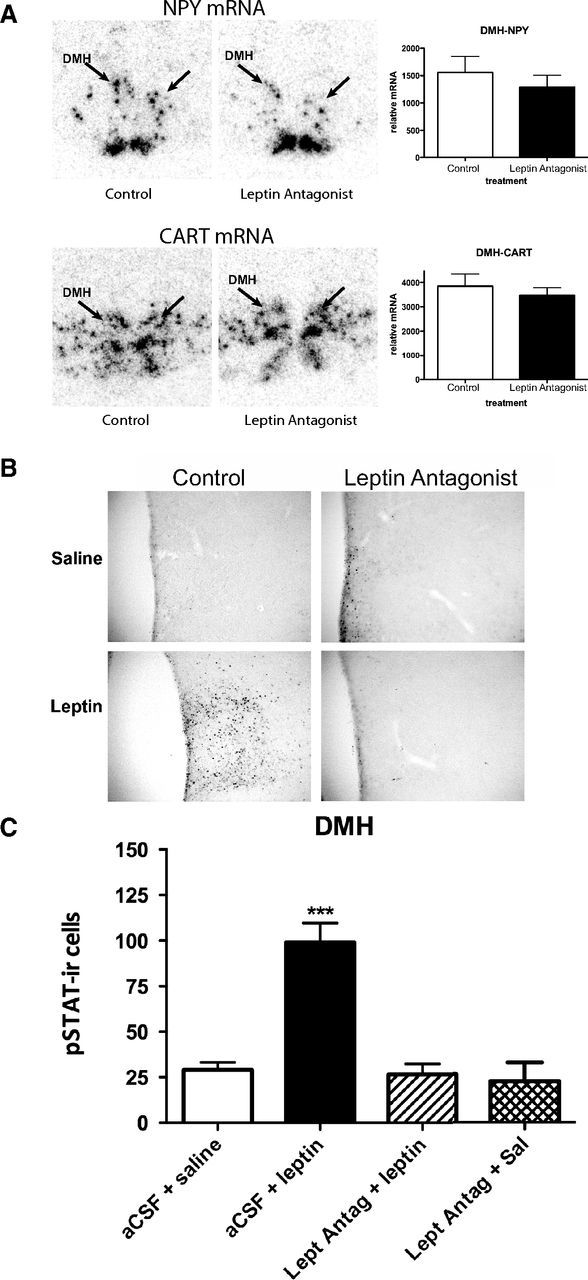
Treatment with a leptin receptor antagonist fails to alter NPY or CART mRNA in 20 week DIO mice. A, NPY (top) and CART (bottom) mRNA expression in the DMH of DIO mice (arrows) not significantly altered by intracerebroventricular treatment of a leptin receptor antagonist (3 doses of 2.5 μg over 36 h); n = 6 animals per group. B, Intracerebroventricular treatment with a leptin receptor antagonist (2.5 μg) blocked the ability of peripherally administered leptin (2 μg/g body weight, i.p.) to induce pSTAT3-ir in the DMH of DIO mice. C, Quantification of pSTAT-ir in the DMH. The asterisks indicate a significant induction of pSTAT3-ir, as determined by one way ANOVA; ***p < 0.0001; n = 3–5 animals per group.
NPY and CART are coexpressed in the DMH of DIO mice
There are several other neuropeptide systems that have been characterized in the DMH. Previous studies from our group observed no evidence of NPY colocalization with orexin or melanin concentrating hormone (MCH) in the DMH (Lee et al., 2013); however, we did observe some colocalization of NPY and CART terminals in some hypothalamic areas. To characterize the colocalization of CART and NPY in the DMH, we performed immunohistochemistry for CART peptide in NPY-hrGFP mice fed either CD or a HFD during DIO development. At 2 weeks, NPY-hrGFP-immunoreactive cell bodies were not detectable in the DMH in either the HFD or CD mice (data not shown). However, by 20 weeks, numerous NPY-hrGFP-immunoreactive cell bodies were detectable in the DMH in HFD mice, which is consistent with the NPY mRNA data. Surprisingly, numerous NPY/CART colabeled cells were detected in the ventral and dorsal portions of the DMH in the DIO mice (Fig. 7A–C), while no such colocalization was observed in CD mice (data not shown). More specifically, nearly all of the NPY-hrGFP cells were colabeled with CART; however, only a small fraction of the total number of CART neurons colabel with NPY-hrGFP. To confirm the colocalization of CART and NPY, double-labeled in situ hybridization was performed on tissue obtained from 24 week HFD-fed mice. Again, while all NPY mRNA-labeled cells were colabeled with CART mRNA (Fig. 7D), only 12 ± 3% of total CART mRNA-expressing neurons (n = 3) expressed NPY mRNA. Additionally, a few NPY/CART mRNA colocalized cells were also observed in the lateral hypothalamus (data not shown). Consistent with the previous reports, there were no NPY/CART colocalized cells in the ARH (Fig. 7E). NPY mRNA expression was observed in the ventromedial portion in the ARH, while CART expression was concentrated in the dorsolateral region.
Figure 7.
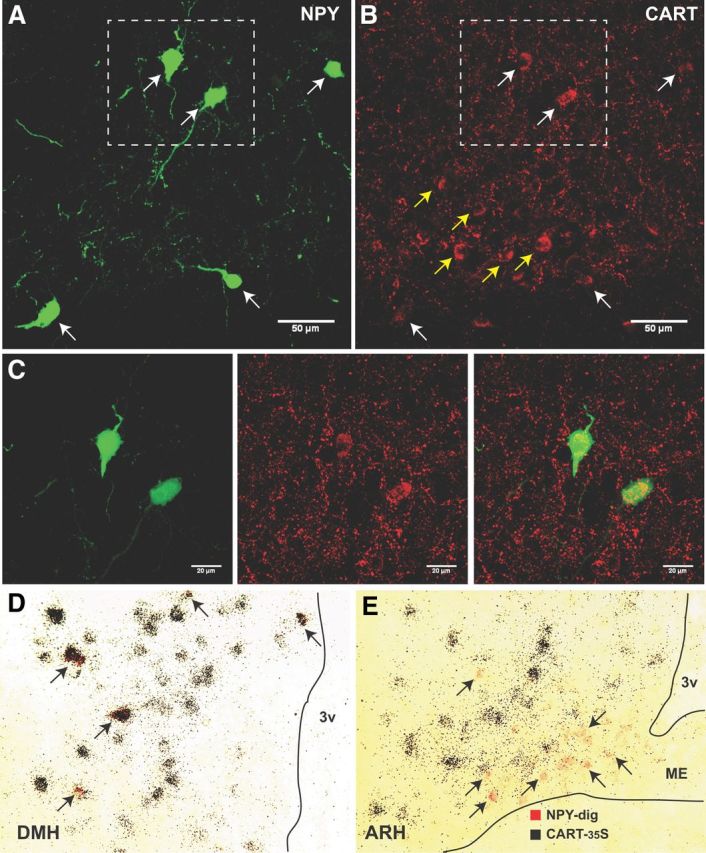
A, B, NPY and CART coexpression in the DMH of DIO mice. NPY-hrGFP-ir (A) and CART peptide-ir (B) in the ventral subdivision of the DMH in NPY-hr GFP mice fed a HFD for 20 weeks. White arrows indicate double-labeled NPY/CART positive neurons. Yellow arrows indicate single-labeled CART neurons. C, Higher magnification of NPY-GFP-ir (left) and CART-ir (middle) neurons. Right, Overlay of NPY-GFP-ir and CART-ir images, with yellow indicating colocalized labeling. The area represented in these figures is indicated in the white dashed box in A and B. D E, Double in situ hybridization for NPY-dig (red) and CART-35S (black grains) in DMH (D) and ARH (E) HFD-fed mice. The black arrows indicate NPY-digoxigenin-labeled neurons. 3V, Third ventricle.
Time course of CART upregulation in the DMH
CART expression in the DMH has been reported previously to be elevated in DIO mice; however, the timing of this increase is unknown. Using tissue sections from the same cohort of animals as used in the NPY time course study, we performed in situ hybridization for CART mRNA and measured the changes in CART expression in the DMH and ARH during development of DIO (Fig. 8). In CD mice, the basal expression of CART mRNA was relatively low in the DMH at 2 weeks and remained unchanged at all time points (Fig. 8B). At 2 weeks on a HFD, CART expression in the DMH was not different from that in the CD mice. DMH CART expression was significantly increased in HFD mice at 10 weeks and remained elevated at later time points (Fig. 8A,B). ARH CART mRNA expression remained unchanged regardless of diet and time (Fig. 8C). Twenty-four hours of fasting did not affect CART mRNA levels in the DMH (Fig. 8B) or the ARH (C) in 20 week HFD or CD mice. Although fasting decreased leptin levels in CD mice, it did not reduce basal CART expression in the DMH or the ARH. Furthermore, treatment of DIO animals (intracerebroventricularly) with the leptin antagonist did not alter DMH CART expression (Fig. 6A).
Figure 8.

Progression of CART mRNA induction in the DMH during DIO. A, Representative photomicrographs for DMH CART mRNA expression in HFD and CD mice at 20 weeks. LH, Lateral hypothalamus. B, C, Quantitative analysis of mRNA expression in the DMH (B) and ARH (C) without (left) and with (right) a 24 h fast. A two-way ANOVA was used to investigate a diet and time/fasted effect. *p < 0.05 (significant diet effect); #p < 0.05 (significant within-diet-group time effect). n = 4–5 per group.
Discussion
While several studies have reported the induction of NPY in the DMH in rodent models of obesity (Kesterson et al., 1997; Guan et al., 1998; Tritos et al., 1998), very little is known about the role of DMH NPY neurons in the control of body weight or energy homeostasis. Previously, Yang et al. (2009) and Chao et al. (2011) reported two key studies showing that knockdown of NPY expression in the DMH of the rat reduces food intake, induces weight loss, and increases sympathetic outflow to adipose tissue. However, the rat is rather unique in its expression of NPY in both the compact and the dorsal (DMD) and ventral (DMV) DMH, whereas the mouse expresses NPY only in the DMD and DMV (Grove et al., 2001; Draper et al., 2010; Lee et al., 2013). Regardless, while these two subregions may have different afferent regulators, the efferent projections from these regions, and their functional role, appear to be similar (Lee et al., 2013); thus, the Yang et al. (2009) and Chao et al. (2011) studies provide strong evidence for the DMH NPY neurons being involved in the regulation of food intake and energy expenditure. However, the key regulators of the activation of NPY in the DMH remained unknown.
Interestingly, while the present study confirms the activation of DMH NPY neurons during DIO, it is clear that NPY expression in the DMH lags behind the development of obesity, and does not peak until after the rapid weight gain phase. Thus, the present findings imply that DMH NPY induction is not the cause of obesity, but rather the drive for overeating in the later stages of obesity. The initial hyperphagic response to HFD consumption is only transient, and the food intake is gradually normalized to the control level, due to the rise in leptin levels, followed by a reduction in orexigenic neuropeptide expression in the ARH (Ziotopoulou et al., 2000). Therefore, the high fat content of the diet rather than the hyperphagia is the main determinant of metabolic adaptations and increased adiposity during the early stages of the DIO (So et al., 2011). According to the study by Lin et al. (2000), mice fed a HFD develop hyperphagia after 16 weeks on the diet, which coincides with the late induction of NPY in the DMH. One interesting caveat to this hypothesis is that if DMH NPY induction is indeed supporting the hyperphagia in chronic DIO, then fasting would be expected to increase DMH NPY expression, as has been reported for ARH NPY (Beck et al., 1990; Brady et al., 1990; White and Kershaw, 1990). On the contrary, fasting significantly decreased DMH NPY expression in the DIO mouse, even though ARH NPY expression was increased in both CD and DIO mice. This is similar to the decrease in DMH NPY expression we reported previously in rat pups with acute maternal deprivation (Grove et al., 2001). This would suggest that there is some hormonal or nutrient signal associated with chronic DIO that is responsible for activation of the DMH NPY neurons.
The two obvious candidates are leptin and insulin. Hyperleptinemia and hyperinsulinemia are both associated with DIO. Hyperleptinemia is also present during early postnatal development in rats and mice, during the period that DMH NPY expression is elevated (Ahima et al., 1998; Singer et al., 2000; Grove et al., 2001). Furthermore, while NPY is expressed in the DMH of the obese MC4 knock-out and Agouti mice, it is not present in the obese ob/ob mouse (Kesterson et al., 1997), suggesting that leptin may be involved. However, in the current study, leptin became significantly elevated by 2 weeks on the HFD and peaked by 10 weeks, which does not correlate with the pattern of DMH NPY expression. Furthermore, the 24 h fasting protocol used in this study failed to significantly reduce leptin levels in the DIO mouse, while DMH NPY expression was significantly reduced. As further confirmation, we were able to demonstrate that intracerebroventricular treatment with a leptin receptor antagonist, although able to block pSTAT3 induction in the DMH, did not affect DMH NPY expression. In contrast, the rise in insulin levels during the progression of DIO does better correlate with the pattern of DMH NPY expression, but little is known about insulin signaling in the DMH. Importantly, hyperinsulinemic ob/ob mouse fails to display NPY induction in the DMH, so insulin itself cannot be the key factor. Central administration of resistin, another adipokine, induces NPY overexpression in the DMH, which is linked to the development of hepatic insulin resistance (Singhal et al., 2007). Increased resistin is also observed after high-fat feeding and leads to the increase in glucose production in the liver and hepatic insulin resistance (Muse et al., 2004). Therefore, future studies are warranted to determine whether resistin regulates DMH NPY gene expression in DIO.
Despite the lack of evidence for leptin being involved in the regulation of DMH NPY mRNA, we did observe that leptin can increase DMH NPY neuronal activity. First, we demonstrated that leptin increased pSTAT3-ir and c-Fos-ir in DMH NPY neurons. The presence of pSTAT3 indicated that leptin was having direct actions on these neurons, while the increased c-Fos expression suggests that leptin was activating these neurons. This is in striking contrast to the well-characterized inhibitory effect on ARH NPY neurons (Cowley et al., 2003). Furthermore, this is also in contrast to the lack of leptin receptor expression on DMH NPY neurons in postnatal day 15 mouse pups (Draper et al., 2010). However, this can be explained by that leptin has a distinct, neurotrophic role during development (Bouret et al., 2004), and the role of leptin in hypothalamic neurons during leptin resistance state such as DIO is unknown. It is also unlikely that DMH NPY neurons maintain the same neurochemical phenotype in different physiological conditions, since CART is not coexpressed in the DMH NPY neurons during development (data not shown).
Second, using electrophysiology of GFP-labeled NPY neurons from DIO mice, we demonstrated that leptin depolarizes and increases the firing frequency of the DMH NPY neurons. While these results do support a direct action of leptin on DMH NPY neurons in the adult DIO mouse, alternatively, leptin could be modulating presynaptic neuropeptide release that is not affected by the glutamate antagonists or tetrodotoxin treatment (data not shown). Regardless, these results suggest that the hyperleptinemia of DIO may support hyperphagia through increasing NPY release. Furthermore, these studies demonstrate that, unlike the ARH, DMH NPY neurons do not develop leptin resistance during chronic DIO. This is consistent with our previous studies (Enriori et al., 2011) as well others (Münzberg et al., 2004).
CART is another abundant neuropeptide in the DMH that is regulated by leptin (Kristensen et al., 1998). Here we demonstrated that CART expression in the DMH correlated with the pattern of hyperleptinemia present in the DIO mouse. The surprising discovery, however, was that the majority of NPY neurons in the DMH also expressed CART. While CART is classically thought of as a anorexigenic signal, there is evidence that conflict with this concept. If CART is anorexigenic, then the DIO mouse must be resistant to the dramatic increase in CART expression. Alternatively, there is more recent evidence to suggest that CART has orexigenic effects when it is injected into specific hypothalamic nuclei, including the paraventricular nucleus of the hypothalamus (PVH) and the DMH (Abbott et al., 2001; Hou et al., 2010). In support of this hypothesis, CART has been demonstrated to stimulate the release of NPY and AgRP, but reduce the release of α-MSH from hypothalamic explants (Dhillo et al., 2002). Furthermore, while CART is expressed in POMC neurons in rodents, it is also colocalized with other orexigenic neuropeptides, including MCH neurons in the lateral hypothalamus (Vrang et al., 1999; Elias et al., 2001; Menyhért et al., 2007). Interestingly, in humans and nonhuman primates, CART is coexpressed in NPY/AgRP neurons and absent from POMC neurons in the ARH (Grayson et al., 2006; Menyhért et al., 2007). Therefore, it is likely that CART is not a simple anorectic peptide; rather, it has multiple functions in energy homeostasis in diverse regions of the hypothalamus. It is also worth reemphasizing that while essentially all NPY neurons in the DMH coexpress CART, only a small percentage of CART neurons in this area are NPYergic.
In summary, long-term HFD consumption induces NPY and CART expression in the DMH, which may be responsible for the hyperphagic behavior and increased brown adipose tissue thermogenesis in diet-induced obesity (Enriori et al., 2011). We discovered two novel findings: (1) NPY and CART are coexpressed in the same neurons in the DMH in chronic obesity. Importantly, these neurons project to the PVH in DIO (Lee et al., 2013) and are implicated in food intake and sympathetic regulation (Chao et al., 2011; Zheng et al., 2013). (2) These neurons are activated by peripheral leptin treatment in DIO condition. The present study clearly suggests that DMH NPY/CART induction is one of the hypothalamic adaptations to increased adiposity and hyperleptinemia. However, the functional roles of NPY and CART expression in the DMH in DIO condition remain to be determined.
Footnotes
This work was supported by Grants P51 OD011092 (K.L.G., M.S.S., P.K.) and R01 HD014643 (M.S.S., K.L.G., M.S.S.), the National Heart Foundation of Australia (M.A.C., S.E.S.), the National Health and Medical Research Council (M.A.C., S.E.S.), and a Pfizer Australia Senior Research Fellowship (M.A.C.).
References
- Abbott CR, Rossi M, Wren AM, Murphy KG, Kennedy AR, Stanley SA, Zollner AN, Morgan DG, Morgan I, Ghatei MA, Small CJ, Bloom SR. Evidence of an orexigenic role for cocaine- and amphetamine-regulated transcript after administration into discrete hypothalamic nuclei. Endocrinology. 2001;142:3457–3463. doi: 10.1210/en.142.8.3457. [DOI] [PubMed] [Google Scholar]
- Ahima RS, Prabakaran D, Mantzoros C, Qu D, Lowell B, Maratos-Flier E, Flier JS. Role of leptin in the neuroendocrine response to fasting. Nature. 1996;382:250–252. doi: 10.1038/382250a0. [DOI] [PubMed] [Google Scholar]
- Ahima RS, Prabakaran D, Flier JS. Postnatal leptin surge and regulation of circadian rhythm of leptin by feeding. Implications for energy homeostasis and neuroendocrine function. J Clin Invest. 1998;101:1020–1027. doi: 10.1172/JCI1176. [DOI] [PMC free article] [PubMed] [Google Scholar]
- Bates SH, Stearns WH, Dundon TA, Schubert M, Tso AW, Wang Y, Banks AS, Lavery HJ, Haq AK, Maratos-Flier E, Neel BG, Schwartz MW, Myers MG., Jr STAT3 signalling is required for leptin regulation of energy balance but not reproduction. Nature. 2003;421:856–859. doi: 10.1038/nature01388. [DOI] [PubMed] [Google Scholar]
- Bechtold DA, Sidibe A, Saer BR, Li J, Hand LE, Ivanova EA, Darras VM, Dam J, Jockers R, Luckman SM, Loudon AS. A role for the melatonin-related receptor GPR50 in leptin signaling, adaptive thermogenesis, and torpor. Curr Biol. 2012;22:70–77. doi: 10.1016/j.cub.2011.11.043. [DOI] [PubMed] [Google Scholar]
- Beck B, Jhanwar-Uniyal M, Burlet A, Chapleur-Chateau M, Leibowitz SF, Burlet C. Rapid and localized alterations of neuropeptide Y in discrete hypothalamic nuclei with feeding status. Brain Res. 1990;528:245–249. doi: 10.1016/0006-8993(90)91664-3. [DOI] [PubMed] [Google Scholar]
- Bellinger LL, Bernardis LL. The dorsomedial hypothalamic nucleus and its role in ingestive behavior and body weight regulation: lessons learned from lesioning studies. Physiol Behav. 2002;76:431–442. doi: 10.1016/S0031-9384(02)00756-4. [DOI] [PubMed] [Google Scholar]
- Bellinger LL, Mendel VE, Bernardis LL, Castonguay TW. Meal patterns of rats with dorsomedial hypothalamic nuclei lesions or sham operations. Physiol Behav. 1986;36:693–698. doi: 10.1016/0031-9384(86)90356-2. [DOI] [PubMed] [Google Scholar]
- Beltrand J, Sloboda DM, Connor KL, Truong M, Vickers MH. The Effect of Neonatal Leptin Antagonism in Male Rat Offspring Is Dependent upon the Interaction between Prior Maternal Nutritional Status and Post-Weaning Diet. J Nutr Metab. 2012;2012:296935. doi: 10.1155/2012/296935. [DOI] [PMC free article] [PubMed] [Google Scholar]
- Bernardis LL, Bellinger LL. Effect of palatable diet on growth, caloric intake and endocrine-metabolic profile in weanling rats with dorsomedial hypothalamic lesions. Appetite. 1986;7:219–230. doi: 10.1016/S0195-6663(86)80027-7. [DOI] [PubMed] [Google Scholar]
- Bernardis LL, Bellinger LL. Brown (BAT) and white (WAT) adipose tissue in high-fat junk food (HFJF) and chow-fed rats with dorsomedial hypothalamic lesions (DMNL rats) Behav Brain Res. 1991;43:191–195. doi: 10.1016/S0166-4328(05)80070-1. [DOI] [PubMed] [Google Scholar]
- Bernardis LL, McEwen G, Kodis M. Body weight set point studies in weanling rats with dorsomedial hypothalamic lesions (DMNL rats) Brain Res Bull. 1986;17:451–460. doi: 10.1016/0361-9230(86)90254-6. [DOI] [PubMed] [Google Scholar]
- Bouret SG, Draper SJ, Simerly RB. Trophic action of leptin on hypothalamic neurons that regulate feeding. Science. 2004;304:108–110. doi: 10.1126/science.1095004. [DOI] [PubMed] [Google Scholar]
- Brady LS, Smith MA, Gold PW, Herkenham M. Altered expression of hypothalamic neuropeptide mRNAs in food-restricted and food-deprived rats. Neuroendocrinology. 1990;52:441–447. doi: 10.1159/000125626. [DOI] [PubMed] [Google Scholar]
- Chao PT, Yang L, Aja S, Moran TH, Bi S. Knockdown of NPY expression in the dorsomedial hypothalamus promotes development of brown adipocytes and prevents diet-induced obesity. Cell Metab. 2011;13:573–583. doi: 10.1016/j.cmet.2011.02.019. [DOI] [PMC free article] [PubMed] [Google Scholar]
- Cowley MA, Smart JL, Rubinstein M, Cerdán MG, Diano S, Horvath TL, Cone RD, Low MJ. Leptin activates anorexigenic POMC neurons through a neural network in the arcuate nucleus. Nature. 2001;411:480–484. doi: 10.1038/35078085. [DOI] [PubMed] [Google Scholar]
- Cowley MA, Cone RD, Enriori P, Louiselle I, Williams SM, Evans AE. Electrophysiological actions of peripheral hormones on melanocortin neurons. Ann N Y Acad Sci. 2003;994:175–186. doi: 10.1111/j.1749-6632.2003.tb03178.x. [DOI] [PubMed] [Google Scholar]
- Dhillo WS, Small CJ, Stanley SA, Jethwa PH, Seal LJ, Murphy KG, Ghatei MA, Bloom SR. Hypothalamic interactions between neuropeptide Y, agouti-related protein, cocaine- and amphetamine-regulated transcript and alpha-melanocyte-stimulating hormone in vitro in male rats. J Neuroendocrinol. 2002;14:725–730. doi: 10.1046/j.1365-2826.2002.00832.x. [DOI] [PubMed] [Google Scholar]
- Draper S, Kirigiti M, Glavas M, Grayson B, Chong CN, Jiang B, Smith MS, Zeltser LM, Grove KL. Differential gene expression between neuropeptide Y expressing neurons of the dorsomedial nucleus of the hypothalamus and the arcuate nucleus: microarray analysis study. Brain Res. 2010;1350:139–150. doi: 10.1016/j.brainres.2010.03.082. [DOI] [PMC free article] [PubMed] [Google Scholar]
- Elias CF, Lee C, Kelly J, Aschkenasi C, Ahima RS, Couceyro PR, Kuhar MJ, Saper CB, Elmquist JK. Leptin activates hypothalamic CART neurons projecting to the spinal cord. Neuron. 1998;21:1375–1385. doi: 10.1016/S0896-6273(00)80656-X. [DOI] [PubMed] [Google Scholar]
- Elias CF, Lee CE, Kelly JF, Ahima RS, Kuhar M, Saper CB, Elmquist JK. Characterization of CART neurons in the rat and human hypothalamus. J Comp Neurol. 2001;432:1–19. doi: 10.1002/cne.1085. [DOI] [PubMed] [Google Scholar]
- Elmquist JK, Elias CF, Saper CB. From lesions to leptin: hypothalamic control of food intake and body weight. Neuron. 1999;22:221–232. doi: 10.1016/S0896-6273(00)81084-3. [DOI] [PubMed] [Google Scholar]
- Enriori PJ, Evans AE, Sinnayah P, Jobst EE, Tonelli-Lemos L, Billes SK, Glavas MM, Grayson BE, Perello M, Nillni EA, Grove KL, Cowley MA. Diet-induced obesity causes severe but reversible leptin resistance in arcuate melanocortin neurons. Cell Metab. 2007;5:181–194. doi: 10.1016/j.cmet.2007.02.004. [DOI] [PubMed] [Google Scholar]
- Enriori PJ, Sinnayah P, Simonds SE, Garcia Rudaz C, Cowley MA. Leptin action in the dorsomedial hypothalamus increases sympathetic tone to brown adipose tissue in spite of systemic leptin resistance. J Neurosci. 2011;31:12189–12197. doi: 10.1523/JNEUROSCI.2336-11.2011. [DOI] [PMC free article] [PubMed] [Google Scholar]
- Friedman JM. Leptin at 14 y of age: an ongoing story. Am J Clin Nutr. 2009;89:973S–979S. doi: 10.3945/ajcn.2008.26788B. [DOI] [PMC free article] [PubMed] [Google Scholar]
- Glavas MM, Kirigiti MA, Xiao XQ, Enriori PJ, Fisher SK, Evans AE, Grayson BE, Cowley MA, Smith MS, Grove KL. Early overnutrition results in early-onset arcuate leptin resistance and increased sensitivity to high-fat diet. Endocrinology. 2010;151:1598–1610. doi: 10.1210/en.2009-1295. [DOI] [PMC free article] [PubMed] [Google Scholar]
- Grayson BE, Allen SE, Billes SK, Williams SM, Smith MS, Grove KL. Prenatal development of hypothalamic neuropeptide systems in the nonhuman primate. Neuroscience. 2006;143:975–986. doi: 10.1016/j.neuroscience.2006.08.055. [DOI] [PubMed] [Google Scholar]
- Grove KL, Brogan RS, Smith MS. Novel expression of neuropeptide Y (NPY) mRNA in hypothalamic regions during development: region-specific effects of maternal deprivation on NPY and Agouti-related protein mRNA. Endocrinology. 2001;142:4771–4776. doi: 10.1210/en.142.11.4771. [DOI] [PubMed] [Google Scholar]
- Guan XM, Yu H, Trumbauer M, Frazier E, Van der Ploeg LH, Chen H. Induction of neuropeptide Y expression in dorsomedial hypothalamus of diet-induced obese mice. Neuroreport. 1998;9:3415–3419. doi: 10.1097/00001756-199810260-00015. [DOI] [PubMed] [Google Scholar]
- Hou J, Zheng DZ, Zhou JY, Zhou SW. Orexigenic effect of cocaine- and amphetamine-regulated transcript (CART) after injection into hypothalamic nuclei in streptozotocin-diabetic rats. Clin Exp Pharmacol Physiol. 2010;37:989–995. doi: 10.1111/j.1440-1681.2010.05423.x. [DOI] [PubMed] [Google Scholar]
- Kesterson RA, Huszar D, Lynch CA, Simerly RB, Cone RD. Induction of neuropeptide Y gene expression in the dorsal medial hypothalamic nucleus in two models of the agouti obesity syndrome. Mol Endocrinol. 1997;11:630–637. doi: 10.1210/me.11.5.630. [DOI] [PubMed] [Google Scholar]
- Kristensen P, Judge ME, Thim L, Ribel U, Christjansen KN, Wulff BS, Clausen JT, Jensen PB, Madsen OD, Vrang N, Larsen PJ, Hastrup S. Hypothalamic CART is a new anorectic peptide regulated by leptin. Nature. 1998;393:72–76. doi: 10.1038/29993. [DOI] [PubMed] [Google Scholar]
- Laque A, Zhang Y, Gettys S, Nguyen TA, Bui K, Morrison CD, Münzberg H. Leptin receptor neurons in the mouse hypothalamus are co-localized with the neuropeptide galanin and mediate anorexigenic leptin action. Am J Physiol Endocrinol Metab. 2013;304:E999–E1011. doi: 10.1152/ajpendo.00643.2012. [DOI] [PMC free article] [PubMed] [Google Scholar]
- Lee SJ, Kirigiti M, Lindsley SR, Loche A, Madden CJ, Morrison SF, Smith MS, Grove KL. Efferent projections of neuropeptide Y-expressing neurons of the dorsomedial hypothalamus in chronic hyperphagic models. J Comp Neurol. 2013;521:1891–1914. doi: 10.1002/cne.23265. [DOI] [PMC free article] [PubMed] [Google Scholar]
- Li C, Chen P, Smith MS. The acute suckling stimulus induces expression of neuropeptide Y (NPY) in cells in the dorsomedial hypothalamus and increases NPY expression in the arcuate nucleus. Endocrinology. 1998;139:1645–1652. doi: 10.1210/en.139.4.1645. [DOI] [PubMed] [Google Scholar]
- Lin S, Thomas TC, Storlien LH, Huang XF. Development of high fat diet-induced obesity and leptin resistance in C57Bl/6J mice. Int J Obes Relat Metab Disord. 2000;24:639–646. doi: 10.1038/sj.ijo.0801209. [DOI] [PubMed] [Google Scholar]
- Mela V, Díaz F, Gertler A, Solomon G, Argente J, Viveros MP, Chowen JA. Neonatal treatment with a pegylated leptin antagonist has a sexually dimorphic effect on hypothalamic trophic factors and neuropeptide levels. J Neuroendocrinol. 2012;24:756–765. doi: 10.1111/j.1365-2826.2012.02279.x. [DOI] [PubMed] [Google Scholar]
- Menyhért J, Wittmann G, Lechan RM, Keller E, Liposits Z, Fekete C. Cocaine- and amphetamine-regulated transcript (CART) is colocalized with the orexigenic neuropeptide Y and agouti-related protein and absent from the anorexigenic alpha-melanocyte-stimulating hormone neurons in the infundibular nucleus of the human hypothalamus. Endocrinology. 2007;148:4276–4281. doi: 10.1210/en.2007-0390. [DOI] [PubMed] [Google Scholar]
- Münzberg H, Flier JS, Bjørbaek C. Region-specific leptin resistance within the hypothalamus of diet-induced obese mice. Endocrinology. 2004;145:4880–4889. doi: 10.1210/en.2004-0726. [DOI] [PubMed] [Google Scholar]
- Muse ED, Obici S, Bhanot S, Monia BP, McKay RA, Rajala MW, Scherer PE, Rossetti L. Role of resistin in diet-induced hepatic insulin resistance. J Clin Invest. 2004;114:232–239. doi: 10.1172/JCI21270. [DOI] [PMC free article] [PubMed] [Google Scholar]
- Patterson CM, Leshan RL, Jones JC, Myers MG., Jr Molecular mapping of mouse brain regions innervated by leptin receptor-expressing cells. Brain Res. 2011;1378:18–28. doi: 10.1016/j.brainres.2011.01.010. [DOI] [PMC free article] [PubMed] [Google Scholar]
- Scarlett JM, Jobst EE, Enriori PJ, Bowe DD, Batra AK, Grant WF, Cowley MA, Marks DL. Regulation of central melanocortin signaling by interleukin-1 beta. Endocrinology. 2007;148:4217–4225. doi: 10.1210/en.2007-0017. [DOI] [PubMed] [Google Scholar]
- Schwartz MW, Baskin DG, Bukowski TR, Kuijper JL, Foster D, Lasser G, Prunkard DE, Porte D, Jr, Woods SC, Seeley RJ, Weigle DS. Specificity of leptin action on elevated blood glucose levels and hypothalamic neuropeptide Y gene expression in ob/ob mice. Diabetes. 1996;45:531–535. doi: 10.2337/diabetes.45.4.531. [DOI] [PubMed] [Google Scholar]
- Shpilman M, Niv-Spector L, Katz M, Varol C, Solomon G, Ayalon-Soffer M, Boder E, Halpern Z, Elinav E, Gertler A. Development and characterization of high affinity leptins and leptin antagonists. J Biol Chem. 2011;286:4429–4442. doi: 10.1074/jbc.M110.196402. [DOI] [PMC free article] [PubMed] [Google Scholar]
- Singer LK, Kuper J, Brogan RS, Smith MS, Grove KL. Novel expression of hypothalamic neuropeptide Y during postnatal development in the rat. Neuroreport. 2000;11:1075–1080. doi: 10.1097/00001756-200004070-00034. [DOI] [PubMed] [Google Scholar]
- Singhal NS, Lazar MA, Ahima RS. Central resistin induces hepatic insulin resistance via neuropeptide Y. J Neurosci. 2007;27:12924–12932. doi: 10.1523/JNEUROSCI.2443-07.2007. [DOI] [PMC free article] [PubMed] [Google Scholar]
- So M, Gaidhu MP, Maghdoori B, Ceddia RB. Analysis of time-dependent adaptations in whole-body energy balance in obesity induced by high-fat diet in rats. Lipids Health Dis. 2011;10:99. doi: 10.1186/1476-511X-10-99. [DOI] [PMC free article] [PubMed] [Google Scholar]
- Spiegelman BM, Flier JS. Obesity and the regulation of energy balance. Cell. 2001;104:531–543. doi: 10.1016/S0092-8674(01)00240-9. [DOI] [PubMed] [Google Scholar]
- Stephens TW, Basinski M, Bristow PK, Bue-Valleskey JM, Burgett SG, Craft L, Hale J, Hoffmann J, Hsiung HM, Kriauciunas A, MacKellar W, Rosteck PR, Jr, Schoner B, Smith D, Tinsley FC, Zhang XY, Heiman M. The role of neuropeptide Y in the antiobesity action of the obese gene product. Nature. 1995;377:530–532. doi: 10.1038/377530a0. [DOI] [PubMed] [Google Scholar]
- Surwit RS, Kuhn CM, Cochrane C, McCubbin JA, Feinglos MN. Diet-induced type II diabetes in C57BL/6J mice. Diabetes. 1988;37:1163–1167. doi: 10.2337/diabetes.37.9.1163. [DOI] [PubMed] [Google Scholar]
- Tritos NA, Elmquist JK, Mastaitis JW, Flier JS, Maratos-Flier E. Characterization of expression of hypothalamic appetite-regulating peptides in obese hyperleptinemic brown adipose tissue-deficient (uncoupling protein-promoter-driven diphtheria toxin A) mice. Endocrinology. 1998;139:4634–4641. doi: 10.1210/en.139.11.4634. [DOI] [PubMed] [Google Scholar]
- Vrang N, Larsen PJ, Clausen JT, Kristensen P. Neurochemical characterization of hypothalamic cocaine- amphetamine-regulated transcript neurons. J Neurosci. 1999;19:RC5. doi: 10.1523/JNEUROSCI.19-10-j0006.1999. [DOI] [PMC free article] [PubMed] [Google Scholar]
- White JD, Kershaw M. Increased hypothalamic neuropeptide Y expression following food deprivation. Mol Cell Neurosci. 1990;1:41–48. doi: 10.1016/1044-7431(90)90040-B. [DOI] [PubMed] [Google Scholar]
- Yang L, Scott KA, Hyun J, Tamashiro KL, Tray N, Moran TH, Bi S. Role of dorsomedial hypothalamic neuropeptide Y in modulating food intake and energy balance. J Neurosci. 2009;29:179–190. doi: 10.1523/JNEUROSCI.4379-08.2009. [DOI] [PMC free article] [PubMed] [Google Scholar]
- Yu Y, South T, Wang Q, Huang XF. Differential expression of hypothalamic CART mRNA in response to body weight change following different dietary interventions. Neurochem Int. 2008;52:1422–1430. doi: 10.1016/j.neuint.2008.03.003. [DOI] [PubMed] [Google Scholar]
- Zhang Y, Proenca R, Maffei M, Barone M, Leopold L, Friedman JM. Positional cloning of the mouse obese gene and its human homologue. Nature. 1994;372:425–432. doi: 10.1038/372425a0. [DOI] [PubMed] [Google Scholar]
- Zheng F, Kim YJ, Chao PT, Bi S. Overexpression of neuropeptide Y in the dorsomedial hypothalamus causes hyperphagia and obesity in rats. Obesity (Silver Spring) 2013;21:1086–1092. doi: 10.1002/oby.20467. [DOI] [PubMed] [Google Scholar]
- Ziotopoulou M, Mantzoros CS, Hileman SM, Flier JS. Differential expression of hypothalamic neuropeptides in the early phase of diet-induced obesity in mice. Am J Physiol Endocrinol Metab. 2000;279:E838–E845. doi: 10.1152/ajpendo.2000.279.4.E838. [DOI] [PubMed] [Google Scholar]