

Abstract
Changes in DNA methylation across the life course may contribute to the ageing process. We hypothesised that some effects of dietary restriction to extend lifespan and/or mitigate against features of ageing result from changes in DNA methylation, so we determined if genes that respond to dietary restriction also show age-related changes in DNA methylation. In support of our hypothesis, the intersection of lists of genes compiled from published sources that (1) were differentially expressed in response to dietary restriction and (2) showed altered methylation with increased age was greater than expected. We also hypothesised that some effects of Sirt1, which may play a pivotal role in beneficial effects of dietary restriction, are mediated through DNA methylation. We thus measured effects of Sirt1 overexpression and knockdown in a human cell line on DNA methylation and expression of a panel of eight genes that respond to dietary restriction and show altered methylation with age. Six genes were affected at the level of DNA methylation, and for six expressions were affected. In further support of our hypothesis, we observed by DNA microarray analysis that genes showing differential expression in response to Sirt1 knockdown were over-represented in the complied list of genes that respond to dietary restriction. The findings reveal that Sirt1 has effects on DNA methylation across the genome and affects, in particular, the expression of genes that respond to dietary restriction. Sirt1-mediated effects on DNA methylation and, consequently, gene expression may thus be one of the mechanisms underlying the response to dietary restriction.
Electronic supplementary material
The online version of this article (doi:10.1007/s11357-012-9485-8) contains supplementary material, which is available to authorized users.
Keywords: Dietary restriction, Sirt1, DNA methylation, Histone deacetylase
Introduction
The epigenetic status of the genome changes across the life course. In general, the total methyl-cytosine content of the vertebrate genome decreases with age (Richardson 2003; Heyn et al. 2012); however, a longitudinal study revealed both decrease and increase in global DNA methylation among individual participants in two human cohorts over periods averaging 11 or 16 years (Bjornsson et al. 2008). Age-related DNA hypomethylation occurs predominantly in repeated sequences (Fraga et al. 2007) and may contribute to an ageing cellular phenotype through promoting genomic instability (Eden et al. 2003; Gaudet et al. 2003) and loss of telomere integrity (Gonzalo et al. 2006). The increased mosaicism between cells in an ageing tissue resulting from stochastic methylation changes to the genome in individual cells may be a major factor in age-related decline in tissue function (reviewed in Mathers and Ford 2009). Site-specific changes in DNA methylation, potentially causal in ageing or related diseases through changes in gene expression, have also been observed as an epigenetic feature of ageing in humans using both gene-targeted analyses (Issa et al. 1994; Kwabi-Addo et al. 2007) and, more recently, pan-genomic approaches (Christensen et al. 2009; Rakyan et al. 2010; Teschendorff et al. 2010). Likewise, changes in DNA methylation across the genome accompanied ageing in mice (Maegawa et al. 2010). Observed differences both in the total methyl-cytosine content of the genome and in DNA methylation at specific sites within monozygotic twin pairs that were greater in older than in younger pairs and in pairs who had spent more of their lives apart support the idea that environmental factors (likely to include diet) influence how DNA methylation patterns alter with age (Fraga et al. 2005).
Dietary restriction (DR) can increase lifespan across evolutionarily distinct species, from yeast to rodents (Guarente and Picard 2005), but there is uncertainty about the mechanisms underlying this response. Limited published evidence supports the premise that DR affects epigenetic marking, in particular DNA methylation. Transient global DNA hypomethylation in the liver and suppression of age-dependent changes in methylation of the c-myc oncogene were observed in mice in response to DR (Miyamura et al. 1993), and hypermethylation of the c-Ha-ras oncogene in pancreatic acinar cells was observed in rats following DR (Hass et al. 1993). More recently, effects on DNA methylation in overweight human subjects in response to weight loss diets have begun to emerge. For example, three loci showed increased methylation over a 6-month intervention in subcutaneous adipose tissue in postmenopausal women (Bouchard et al. 2010), and methylation at two loci in DNA from peripheral blood mononuclear cells was increased in men following reduced energy intake over 8 weeks (Milagro et al. 2011).
Researchers have exploited the tractability of simpler model organisms to search for genes essential to the response to DR, but such studies have limitations with respect to elucidating the details of the response to DR in higher organisms—notably mammals—because different taxa do not necessarily employ common mechanisms to achieve this (presumably universally beneficial) adaptation. Research based on model organisms identified that the NAD-dependent (class III) histone deacetylase (HDAC) Sir2/sir2/dSir2 may be pivotal in mediating responses to DR. This premise is supported by observations including the abolition of lifespan extension by DR in mutants that do not express Sir2 in yeast (Lin et al. 2002), Caenorhabditis elegans (Tissenbaum and Guarente 2001) and Drosophila (Rogina and Helfand 2004). DR increased expression of Sirt1 (the mammalian homologue of Sir2) in several rodent tissues, including the liver, brain, heart and white and brown adipose tissues (Cohen et al. 2004; Nisoli et al. 2005), and in human skeletal muscle (Civitarese et al. 2007) as well as in hepatoma cells treated with human serum from volunteers undertaking DR (Allard et al. 2008). Another factor associated with an improved health trajectory during ageing reported to influence Sirt1 is physical activity, which opposed an age-related reduction in Sirt1 activity in the rat’s heart (Ferrara et al. 2008; Corbi et al. 2012) and, in humans, resulted in changes in serum that induced an increase in Sirt1 activity in cultured endothelial cells following oxidative stress (Conti et al. 2012). Effects of transgenic expression and knockout of Sirt1 in mouse models are consistent with this gene playing a role in mediating beneficial biochemical and physiological effects associated with the response to DR in mammals (Donmez and Guarente 2010). Several metabolic and physiological effects of DR were mimicked in a transgenic mouse model in which Sirt1 expression was increased in tissues including brown and white adipose tissues and the brain. These effects included reduced fasting concentrations of insulin, glucose and cholesterol and reduced adiposity (Bordone et al. 2007). In a different mouse model of Sirt1 gain of function, ubiquitous expression of the transgene improved glucose tolerance due to increased hepatic insulin sensitivity (Banks et al. 2008). Sirt1 overexpression and knockout in the brain of mouse models revealed a role for Sirt1 in downregulating production of β-amyloid plaques in brain—the hallmark of Alzheimer disease (Donmez et al. 2010). Associations between SNPs in SIRT1 and risk for type 2 diabetes and reduced insulin sensitivity were observed in humans (Dong et al. 2011), and in other human subjects, higher Sirt1 mRNA expression in adipose tissue was associated with increased energy expenditure and insulin sensitivity (Rutanen et al. 2010).
However, the view that Sirt1 plays a major role in lifespan extension in response to DR in non-metazoans has been challenged. Genetic outcrosses involving strains of C. elegans that overexpress sir2 and have extended lifespan resulted in progeny that retained high sir2 expression but had normal lifespan, and genes other than sir2 co-segregated with longevity (Burnett et al. 2011). Also, comparison of a transgenic Drosophila melanogaster strain with increased dSir2 expression with an appropriate transgenic control, as distinct from the corresponding wild-type strain, revealed that there was no difference in lifespan (Burnett et al. 2011). Moreover, other signalling pathways, notably mTOR (Minor et al. 2010) and AMPK (Canto and Auwerx 2011), are emerging as important mediators of lifespan extension in response to DR. In view of this controversy and the potential for developing pharmaceutical or nutritional approaches to mimic beneficial responses to DR, the importance of identifying mechanisms of action of Sirt1 and their relationship to responses to DR becomes paramount.
Sirt1 is catalytically active with respect to a range of substrates (additional to histone proteins), and there are numerous potential downstream targets of Sirt1 whose deacetylation may contribute to lifespan or healthspan extension. These targets include substrates such as p53, the transcriptional co-activator and orchestrator of mitochondrial biogenesis PGC-1α (Guarente and Picard 2005) and many other transcription factors (Donmez and Guarente 2010). Other effects of Sirt1 relevant to effects on lifespan or healthspan are unrelated to deacetylation activity, including regulation of insulin secretion through binding to the promoter of the gene encoding mitochondrial uncoupling protein 2 (UCP2) (Bordone et al. 2006). The mechanisms through which effects of Sirt1 activation on such targets translate into modulation of ageing and/or lifespan remain unclear. Based on its ability to deacetylate histone proteins (HDAC activity), we propose that modification of epigenetic marks are a likely result of increased Sirt1 activity and may contribute to effects on gene expression that maintain healthy cell and/or tissue function as mammals become older. To date, such effects have been overlooked, despite the very strong evidence that epigenetic changes are a feature of ageing.
Here, we address our hypothesis that Sirt1-mediated effects on DNA methylation mediate some of the lifespan-/healthspan-enhancing effects of DR (Wakeling et al. 2009; Ford et al. 2011) firstly by investigating if there is evidence for a link between genes affected by DR and genes that show altered DNA methylation with age, based on the analysis of lists complied from available published datasets. We then determined the effects of Sirt1 overexpression and knockdown in a human cell line model on the expression and DNA methylation of a panel of eight genes reported to show altered expression under conditions of DR and altered DNA methylation with age. Finally, we used DNA microarray analysis to identify the genes most responsive to altered Sirt1 expression in our human cell line model and investigated their relationship with genes that respond to DR.
Experimental procedures
In silico analysis
Ensembl identifiers for mouse and human genes reported in all published microarray-based analyses used for the in silico analysis were matched with other forms of gene nomenclature using clone/gene ID converter (http://idconverter.bioinfo.cnio.es/) or Biomart (http://www.ensembl.org/biomart/martview/222657faaccdeeeabbcb58a38d8902d7). Any genes not included on the Nimblegen mouse MM5 array (taken as the universal gene set) were excluded from all lists and not included in the analyses. All duplicates were removed before aligning gene lists to identify intersections between lists. Hypergeometric probability calculation was applied to determine if intersections between gene lists were statistically greater than those expected by chance, taking the total number of unique genes on the MM5 array (17,087) as the size of the universal gene set.
Plasmid constructs
Plasmid pCMV6-ENTRY-SIRT1, containing the human SIRT1 cds plus 3′-most region of the 5′UTR downstream of the CMV promoter, was purchased from Origene.
Culture and transfection of Caco-2 cells and human umbilical vein endothelial cells
Caco-2 cells were cultured under standard conditions as described previously (Cragg et al. 2002). Human umbilical vein endothelial cells (HuVECs) were cultured in 75-cm2 flasks pre-coated with 1 % gelatin (Sigma) and maintained at 37 °C in a humidified atmosphere of 5 % CO2 in air in Endothelial Cell Growth Medium-2 (2 % fetal bovine serum plus growth factors) (Lonza). Medium was replenished twice weekly. Transfection with plasmid constructs was, as reported previously (Jackson et al. 2007), performed using GeneJammer reagent (Stratagene), following the manufacturer’s instructions, and 2 μg DNA and 4 μl (Caco-2 cells) or 5 μl (HuVECs) of GeneJammer reagent per well and seeding cells into six-well plates at a density of 3.5 × 10⁵ cells/well. siRNA-mediated knockdown of Sirt1 using Validated Stealth RNAi™ siRNAs (Invitrogen)—sequences GCAACAGCAUCUUGCCUGAUUUGUA and UCAUAGAGCCAUGAAGUAUGACAAA—was achieved using Lipofectamine RNAiMAX (Invitrogen) (4 μl/100 pmol RNAi duplex), following the manufacturer’s instructions and seeding cells in six-well plates at 3.5 × 10⁵ cells/well. Comparative negative control cells were transfected under the same conditions with Stealth RNAi™ siRNA negative control LO GC (Invitrogen). For all experiments involving Caco-2 cell transfection, samples for analysis (protein and nucleic acid) were prepared 72 h post-transfection.
Preparation and analysis of RNA from Caco-2 cells
RNA was prepared from Caco-2 cells using Trizol reagent (Invitrogen), following the manufacturer’s instructions; then, integrity was confirmed (RIN = 10) using an Agilent 2100 Bioanalyser. For reverse transcription quantitative real-time polymerase chain reaction (RT-qPCR), RNA was treated with DNAase (Roche; according to the manufacturer’s instructions), and then, first-strand cDNA synthesis was carried using Moloney Murine Leukaemia Virus Reverse Transcriptase (Promega), following the manufacturer’s instructions. Quantitative real-time PCR was carried out using the DNA Engine Opticon 2 (MJ Research), with 10 μl reactions set up in 96-well format containing Power SYBR Green PCR Master Mix (Applied Biosystems) and 0.5 μM of each primer (supplementary Table S1). After denaturing for 5 min at 95 °C, 45 cycles with the following parameters were carried out: 95 °C, 10 s; 52–60 °C (annealing; see supplementary Table S1), 10 s; 72 °C, 15 s. Relative concentrations of target and reference genes were calculated for Ct values on the basis of standard curves generated by using a serial dilution of cDNA from Caco-2 cells. PCR products were sequenced (Eurofins MWG Operon) to confirm identity to the expected products. Analysis of RNA by microarray hybridisation was carried out by Service XS (Leiden, The Netherlands). Following the first and second strand cDNA synthesis (reverse transcription), biotin-labelled RNA was generated in vitro, hybridised to the HumanHT-12 v4 Expression Bead Chip (Illumina) and detected using streptavidin Cy3. Data were imported into GeneSpring GX 11 (Agilent) for visualisation. Hierarchical clustering was used to assess the similarity of biological replicates. Probes were considered further if the detection of p value was >0.6 in all samples in a replicate group. Rank Products (http://www.ncbi.nlm.nih.gov/pubmed/15327980) analysis was used to determine differential expression between groups using the RankProd (http://www.ncbi.nlm.nih.gov/pubmed/16982708) package from BioConductor (http://genomebiology.com/2004/5/10/R80) to report probes with a p.f.p of <0.05 over 100 permutations of the class labels with a resulting fold change of >1.5.
Preparation and analysis of protein from Caco-2 cells
Total cell lysate from Caco-2 cells transfected with the human Sirt1 expression plasmid pCMV6-ENTRY-SIRT1, the corresponding vector (minus Sirt1 insert), human SIRT1 siRNA or negative control siRNA was prepared by scraping cells into ice cold phosphate-buffered saline (PBS) including protease inhibitor cocktail (Roche), then collecting by centrifugation and suspending in suspension buffer (100 mM NaCl, 10 mM Tris–HCl pH 7.5, 1 mM EDTA and one protease inhibitor cocktail tablet per 10 ml buffer). Protein concentration was determined against BSA standards using Bradford reagent (Bio-Rad Laboratories). For western blotting, proteins in total cell lysate were separated by SDS-PAGE and transferred by semi-dry blotting onto PVDF membrane (Amersham Hybond-P, GE Healthcare). Membranes were incubated for 16 h at 4 °C in blocking buffer [5 % milk powder and 0.05 % (v/v) Tween-20 in × 1 PBS]; then, primary antibody was applied in blocking buffer [dilution of 1:200 for 1 h at room temperature for anti-Sirt1 antibody (Abcam; ab13749) and dilution of 1:5,000 for 1 h at room temperature for anti-α-tubulin antibody (Abcam; ab15246)]. After washing membranes in 0.05 % Tween in × 1 PBS, alkaline phosphatase-conjugated secondary antibody [anti-rabbit IgG (whole molecule) peroxidase conjugate; Sigma-Aldrich Ltd.; A0545] was applied at a dilution of 1:10,000 in blocking buffer for 1 h at room temperature. Membranes were developed after washing in 0.05 % Tween in × 1 PBS using Amersham ECL Reagent (GE Healthcare).
Preparation and analysis of DNA from Caco-2 cells
DNA for methylation analysis by pyrosequencing was prepared using the QIAamp® DNA Mini kit (Qiagen) and treated with sodium bisulphite (EZ DNA Methylation-Gold™ kit; Zymo Research Corporation), to convert unmethylated cytosine bases to thymines. Pyrosequencing was carried out using a PyroMark Q96 ID System (Qiagen), using PyroMark Gold Q96 Reagents, according to the manufacturer’s instructions. PCR products were generated using HotStarTaq Master Mix (Qiagen) using primers (0.25 μM each, one with a 5′ biotin label) and annealing temperatures as listed in supplementary Table S2 with the following cycling parameters: 95 °C, 15 min; then 95 °C, 15 s; 40–58 °C (annealing), 60 s; 72 °C 60 s for 50 cycles, followed by 72 °C for 5 min. Where two pairs of primers are listed, the biotin-labelled PCR products for pyrosequencing were generated in a nested PCR reaction after using the first (outer) primer pair to generate a template PCR product from bisulphite-converted DNA. Where Qiagen PyroMark CpG Assays were used, biotin-labelled PCR products for pyrosequencing were generated directly from bisulphite-converted DNA. Sequencing primers are listed in supplementary Table S2.
Results
The intersection between compiled lists of genes that showed altered expression in response to DR and changes in DNA methylation with age is greater than that expected by chance. We reasoned that if some effects of DR that oppose ageing are mediated through changes in DNA methylation patterns, then a larger number of genes than those expected by chance would both show a change in expression in response to DR and undergo changes in methylation with age. We thus compiled unbiased compatible gene lists from a common population (genes on the MM5 array to which Ensembl identifiers could be assigned) for genes found to be responsive to DR and found to show ageing-related changes in methylation status. Genes regulated by DR, leading to a change in abundance of the corresponding mRNA, were identified from published studies involving DR in mice (Lee et al. 2002; Higami et al. 2004; Massaro et al. 2004; Tsuchiya et al. 2004; Han and Hickey 2005; Dhahbi et al. 2006; Fu et al. 2006; Selman et al. 2006; Sharov et al. 2008; Swindell 2008; Wu et al. 2008). We accepted for each published study the authors’ list of regulated genes and used data regardless of tissue investigated. Genes reported to undergo changes in DNA methylation with age were identified from published studies in mice (Maegawa et al. 2010) and humans (Koch et al. 2011; Koch and Wagner 2011; Christensen et al. 2009; Teschendorff et al. 2010) according to the criteria/threshold set by the authors and without selection of tissue type. Both gene lists were converted to Ensembl identifiers, and duplicates were eliminated to generate a single list of 2,613 genes reported to respond to DR and a list of 1,448 genes that showed altered DNA methylation with age all of which were represented on the MM5 array (total 17,087 genes for which we could assign Ensembl identifiers) (supplementary Table S3). We identified genes that were common to both lists and asked the question if the number of genes in this intersection between the two lists was statistically greater than that would be expected by chance. Two hundred and seventy-six genes appeared on both lists (supplementary Table S3), against a number expected by chance of 221 (i.e. 8.47 % (2,613/17,087) of the 2,613 genes found to respond to DR or 15.29 % (1,448/17,087) of the 1,448 genes found to show an ageing-related change in methylation status), giving a representation factor of 1.25 and cumulative hypergeometric probability of 4.5 × 10⁻⁴. Thus, our analysis indicates that genes that respond to DR are more likely than others to show changes in methylation status with ageing (or vice versa), consistent with DR affecting DNA methylation of genes relevant to ageing and thus supporting our overall hypothesis.
Manipulation of Sirt1 levels in a human cell line model affects DNA methylation and expression of genes identified by the in silico analysis. We proposed that effects on DNA methylation resulting from increased Sirt1 expression and/or activity may contribute to some beneficial effects of DR, so we sought direct evidence that changes in Sirt1 expression can affect DNA methylation. We therefore overexpressed human Sirt1 by transfection of a transgene (plasmid pCMV6-ENTRY-SIRT1; Origene) and used siRNA to reduce levels of Sirt1 expression in the human intestinal Caco-2 cell line. Sirt1 overexpression and knockdown in Caco-2 cells were confirmed at the mRNA level by RT-qPCR (Fig. 1a) and at the protein level by western blotting (Fig. 1b). By pyrosequencing, we quantified methylation at CpG dinucleotides (methylation of two to nine individual cytosine residues per gene) upstream of the start of transcription in eight genes (CDC7, EIF5, IRX3, KLF3, PCYT1A, PTPRG, SLC39A4, TBX3) highlighted by our in silico analysis as likely targets of Sirt1-modified methylation with relevance to effects of DR on ageing by virtue of falling into the intersection of the two genes lists (i.e. having been observed to have altered expression under conditions of DR and to show a change in DNA methylation with age). We selected the panel of eight genes from the group of 276 genes showing altered expression under conditions of DR and changes in DNA methylation with age because they have also been reported to bind Sirt1 in mouse embryonic stem cells using a chromatin immunoprecipitation assay (Oberdoerffer et al. 2008). For CDC7, EIF5, IRX3 and PTPRG, these CpG dinucleotides were within regions meeting criteria for CpG islands (defined as 50 % GC content, 0.60 observed/expected CpG ratio and 200 bp minimum length and identified using CpGIE2.0 software (Wang and Leung 2004)). We observed significant effects of Sirt1 manipulation on methylation of at least one CpG site (and up to three, with an effect at all three sites assayed within the TBX3 promoter) in six of the eight genes examined (Table 1). We observed no effects of Sirt1 manipulation for PCYT1A and SLC39A4. In parallel with measurements of DNA methylation, we used RT-qPCR to determine if expression at the mRNA level of the same genes was affected by manipulation of Sirt1 expression levels. Significant changes in expression in response to altering the level of Sirt1 expression were observed at the mRNA level for six of the eight genes (Table 2). As proof of concept that the effects of Sirt1 manipulation on DNA methylation and gene expression are not exclusive to the Caco-2 cell line, we measured also effects of overexpression and knockdown on TBX3 DNA methylation and mRNA levels in HuVECs and observed effects on both parameters (supplementary Tables S5 and S6). We also investigated if manipulation of Sirt1 expression affected DNA methylation or expression of four genes that, according to our in silico analysis, showed no change in expression under conditions of DR and no alteration in DNA methylation with age. The four specific genes selected have functions similar to the six genes in the panel of eight genes we analysed that had been reported to show both effects and for which we measured Sirt1-dependent changes in DNA methylation and/or expression (EIF3L, a translation initiation factor (like EIF5); STK10, a kinase involved in cell cycle progression (like CDC7); PTPRA, a protein tyrosine phosphatase receptor (like PTPRG); SP3, a transcription factor (like KLF3, IRX3 and TBX3 and like KLF3, a zinc-finger protein). For all these genes, the CpG sites analysed were within regions meeting criteria for CpG islands, as defined above. DNA methylation was affected at all four gene loci (Table 1). However, in contrast to the panel of eight “target” genes, for which expression of the majority (six) was affected, expression of only one of the four (EIF3L) differed according to the level of Sirt1 expression (Table 2). If the percentage of “non-target” genes affected at the RNA level by Sirt1 manipulation (25 %) is the same as the chance of any gene being affected, then p = 0.0011 for the observation that six out of eight target genes showed altered RNA levels in response to Sirt1 manipulation. Conversely, if the percentage of target genes affected at the RNA level by Sirt1 manipulation (75 %) is the same as the chance of any gene being affected, then p = 0.047 for the observation that only one out of four non-target genes was affected. Together, these observations reveal a tendency for the expression of genes that show age-related changes in DNA methylation and/or altered expression under conditions of DR to be affected by levels of Sirt1 expression in the cell. The findings thus support our hypothesis that the beneficial effects of DR include changes in gene expression brought about by effects of Sirt1 on DNA methylation.
Fig. 1.

Manipulation of human Sirt1 expression levels in Caco-2 cells. a Confirmation by RT-PCR of Sirt1 overexpression [transient transfection with plasmid pCMV6-ENTRY-SIRT1 (Origene)] and knockdown (siRNA) by RT-qPCR. All data are for n = 18. b, c Confirmation by western blotting of Sirt1 overexpression (b) and knockdown (c). The specific Sirt1 and α-tubulin immunoreactive bands, with approximate molecular weights, are indicated. Approximately 10 μg of protein was loaded in each lane, and for each condition, three biological replicates are presented. In b, +SIRT1 indicates cells transfected with the Sirt1 overexpression construct. In c, siRNA (SIRT1) indicates cells transfected with one of two siRNAs (#1 or #2) targeted to Sirt1. All data are representative of multiple independent repeats of the procedures
Table 1.
Summary of data on effects on gene-specific methylation of increasing (transgene overexpression) or reducing (siRNA) expression of Sirt1 in Caco-2 cells
| Gene | Region analysed | Number of CpG sites analysed | CpG sites affected by manipulating level of SIRT1 expression | |||
|---|---|---|---|---|---|---|
| CpG number | Methylation (%) in cells with overexpressed SIRT1 | Methylation (%) in control cells | Methylation (%) in cells with reduced SIRT1 expression | |||
| (relative to start of transcription) | (sequential position within region analysed relative to start of transcription) | [median (Q1, Q3); n = 6–9] | [median (Q1, Q3); n = 9–12] | [median (Q1, Q3); n = 12–18] | ||
| CDC7 | −59 to +1 | 8 | 8 | 2.00 (1.50, 2.00) | 2.00 (2.00, 2.00) | 1.50 (0.00, 2.00)* |
| EIF5 | −61 to +1 | 8 | 1 | 1.00 (1.00, 1.50)** | 0.00 (0.00, 0.25) | 0.00 (0.00, 0.25)## |
| 2 | 1.00 (0.00, 1.50)* | 0.00 (0.00, 1.00) | 0.00 (0.00, 0.00)## | |||
| 4 | 2.00 (1.00, 2.50) | 2.00 (2.00, 3.25) | 5.00 (2.00, 8.00)*## | |||
| IRX3 | −65 to +1 | 3 | 1 | 92.00 (91.50, 97.00) | 94.00 (91.75, 95.00) | 91.50 (88.75, 93.00)* |
| 3 | 83.00 (82.00, 87.00) | 86.50 (85.00, 91.00) | 90.00 (87.75, 91.00)## | |||
| KLF3 | −70 to −45 | 6 | 3 | 0.00 (0.00, 1.50)* | 0.00 (0.00, 0.00) | 0.00 (0.00, 0.00) |
| PCYT1A | −89 to +1 | 2 | None affected | |||
| PTPRG | −73 to +1 | 9 | 9 | 7.00 (5.50, 11.50) | 8.00 (5.00, 12.25) | 5.00 (4.00, 6.00)**# |
| SLC39A4 | −92 to +1 | 3 | None affected | |||
| TBX3 | −135 to +1 | 3 | 1 | 96.00 (93.50, 96.50) | 95.00 (85.00, 98.00) | 84.50 (64.75, 92.00)**## |
| 2 | 84.00 (83.00, 87.00) | 83.00 (76.75, 86.00) | 78.50 (61.75, 81.00)**## | |||
| 3 | 91.00 (86.50, 95.00) | 87.00 (79.75, 90.00) | 77.00 (59.50, 82.25)**## | |||
| EIF3L | +22 to +58 | 7 | 1 | 1.00 (0.75, 1.50) | 0.50 (0.00, 1.50) | 0.25 (0.00, 1.00)# |
| 4 | 1.00 (0.25, 1.50) | 1.00 (0.00, 1.75) | 1.75 (1.25, 2.00)# | |||
| PTPRA | −247 to −219 | 4 | 1 | 0.75 (0.50, 0.75)* | 1.00 (0.75, 1.25) | 1.25 (1.00, 1.25)## |
| 2 | 1.50 (1.25, 1.50) | 1.25 (0.50, 1.50) | 1.00 (1.00, 1.25)# | |||
| 3 | 1.75 (1.50, 1.75) | 1.75 (1.50, 2.00) | 2.25 (2.00, 2.50)### | |||
| 4 | 2.75 (2.50, 3.00) | 3.00 (2.75, 3.50) | 3.00 (2.75, 3.75)# | |||
| SP3 | −1,202 to −1,157 | 6 | 4 | 4.25 (3.50, 5.00) | 5.50 (5.00, 6.25) | 5.25 (5.00, 5.75)# |
| STK10 | −100,788 to −100,745 | 6 | 1 | 0.50 (0.00, 0.75) | 0.75 (0.00, 0.75) | 1.00 (0.75, 1.25)*# |
| 2 | 2.00 (1.75, 2.25) | 2.25 (1.75, 2.50) | 2.50 (2.25, 2.75)# | |||
| 4 | 0.50 (0.00, 1.00) | 0.50 (0.00, 1.00) | 1.00 (0.75, 1.25)** | |||
| 5 | 0.00 (0.00, 0.75) | 0.75 (0.00, 1.00) | 0.75 (0.50, 1.25)# | |||
Values for the control condition were derived through combining the data for controls for Sirt1 overexpression (plasmid minus Sirt1 transgene insert) and knockdown (control siRNA), which did not differ. Data are stated only for CpG sites at which significant effects of Sirt1 expression level were measured and are stated to the nearest 0.25 %, based on a calculation of medians and quartiles from values rounded to the nearest 1 %
Q1 first quartile, Q3 third quartile
*p < 0.05; **p < 0.01 compared with control; #p < 0.05; ##p < 0.01; ###p < 0.001 compared with SIRT1 overexpression, by Kruskal–Wallis followed by Dunn’s multiple comparison tests
Table 2.
Summary of data on effects on gene expression (relative mRNA levels) of increasing (transgene overexpression) or reducing (siRNA) expression of Sirt1 in Caco-2 cells
| Gene | mRNA relative to control in cells with overexpressed SIRT1 | mRNA (normalised) in control cells | mRNA relative to control in cells with reduced SIRT1 expression |
|---|---|---|---|
| (mean ± SEM; n = 6) | (mean ± SEM; n = 12) | (mean ± SEM; n = 12) | |
| CDC7 | 1.46 ± 0.12 | 1.00 ± 0.08 | 2.52 ± 0.49* |
| EIF5 | 0.41 ± 0.06 | 1.00 ± 0.09 | 2.04 ± 0.25***### |
| IRX3 | 0.74 ± 0.11 | 1.00 ± 0.13 | 1.00 ± 0.15 |
| KLF3 | 1.63 ± 0.18 | 1.00 ± 0.09 | 2.57 ± 0.25***# |
| PCYT1A | 0.88 ± 0.10 | 1.00 ± 0.04 | 1.63 ± 0.22*# |
| PTPRG | 0.97 ± 0.25 | 1.00 ± 0.09 | 1.17 ± 0.11 |
| SLC39A4 | 1.61 ± 0.28* | 1.00 ± 0.07 | 1.50 ± 0.12## |
| TBX3 | 1.12 ± 0.07 | 1.00 ± 0.07 | 1.46 ± 0.16* |
| EIF3L | 0.75 ± 0.06 | 1.00 ± 0.06 | 1.70 ± 0.09***### |
| PTPRA | 1.35 ± 0.23 | 1.00 ± 0.06 | 1.09 ± 0.07 |
| SP3 | 1.15 ± 0.25 | 1.00 ± 0.06 | 0.99 ± 0.13 |
| STK10 | 1.06 ± 0.19 | 1.00 ± 0.09 | 1.07 ± 0.11 |
Values for the control condition were derived through combining the data for controls for Sirt1 overexpression (plasmid minus Sirt1 transgene insert) and knockdown (control siRNA), which did not differ. Data are expressed relative to the mean for two reference genes—GAPDH and WNT11—and are normalised to the control condition
*p < 0.05; ***p < 0.001 compared with control; #p < 0.05; ##p < 0.01; ###p < 0.001 compared with SIRT1 overexpression, by one-way ANOVA followed by Tukey’s post test
Modulation of Sirt1 expression affects global patterns of gene expression in a human cell line model to mimic effects of DR. RNA samples derived from Caco-2 cells in which Sirt1 expression was reduced by use of siRNA (as above and see Fig. 1b, d) and from Caco-2 cells treated with control siRNA were hybridised to DNA microarrays [HumanHT-12 v4 Expression Bead Chip (Illumina)]. The data are deposited in GEO with accession GSE30486. Using Rank Products analysis (http://www.ncbi.nlm.nih.gov/pubmed/16982708) on a quality filtered subset of microarray probes, we identified 94 genes whose expression was reduced (Fig. 2a and supplementary Table S4) and 61 genes whose expression was increased (Fig. 2b and supplementary Table S4) by a factor of 1.5-fold or greater under conditions of Sirt1 knockdown. We could assign mouse Ensembl identifiers and confirm representation on the MM5 microarray for 107 of these genes (Fig. 2a, b). Of these genes, 39 appeared on our list of 2,613 mouse genes that respond to DR (Fig. 2a), giving a representation factor of 2.38 and hypergeometric probability of 6.09 × 10⁻⁸ (Fig. 2c). Thus, the gene profile of Caco-2 cells affected by Sirt1 manipulation matches (to an extent substantially greater than is expected by chance) the genes that respond to DR across a range of different mouse tissues. These findings indicate that altering Sirt1 expression evokes changes in the gene expression profile which mimic a component of the change in profile observed in response to DR and so support the view that Sirt1 plays a role in the response to DR.
Fig. 2.
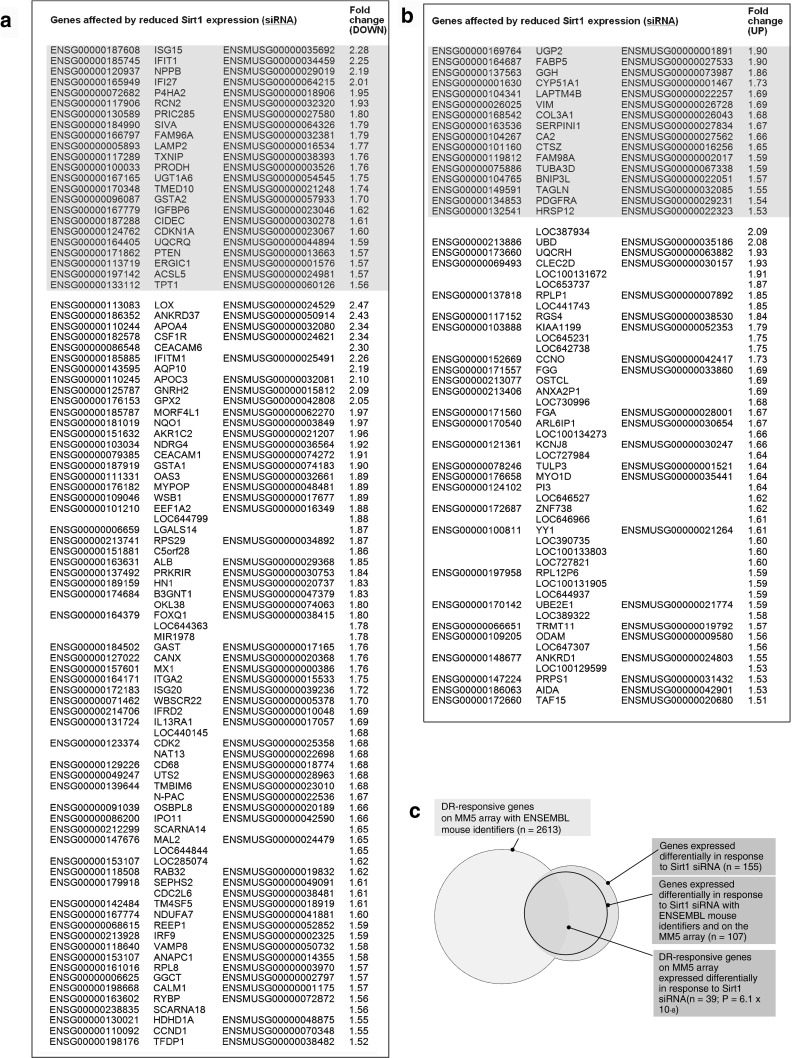
Analysis of genes affected by reduced Sirt1 expression (siRNA) and by DR. Genes with expression reduced (a) or increased (b) by 1.5-fold or greater (ranked) over 72 h in response to reducing human Sirt1 expression in Caco-2 cells by siRNA are listed. Genes identified through our in silico analysis as responsive to DR are in shaded cells. Human and mouse Ensembl identifiers and human gene symbols are stated. c Venn diagram to represent the gene list intersections
Discussion
We present an in silico analysis revealing that commonality between lists of genes (number of genes in the intersection) with expression affected by dietary restriction and those showing altered methylation with age is greater than that expected by chance. This observation is consistent with the idea that some effects of DR may be mediated through altered patterns of methylation to oppose age-related changes in gene expression and, therefore, in cell and tissue function.
To explore the idea that Sirt1 may play a role in this relationship, we manipulated expression by using a human SIRT1 transgene or by siRNA-mediated knockdown in human intestinal Caco-2 cells. We chose Caco-2 cells for these studies because the dataset used for the in silico analysis was derived from multiple tissues including intestine for both DR-responsive genes (Selman et al. 2006) and genes showing ageing-associated changes in methylation (Maegawa et al. 2010). In addition, we chose the Caco-2 cell line based on pragmatic considerations including ease of transfection and our previous observations that methylation status of gene promoter regions in this model affects transcriptional activity of the corresponding genes (Coneyworth et al. 2009).
We investigated effects of overexpression or knockdown of human Sirt1 in Caco-2 cells and detected changes in methylation at specific CpG sites in six of the eight target genes in our panel that we had selected from the intersection of the two datasets identified through our in silico analysis. Methylation was measured at only a small number of CpG sites within the genes, so our data do not exclude the possibility that the methylation status of CpG sites not captured in our assays for PCYT1A and SLC39A4, in which we detected no effect of Sirt1 on DNA methylation, was affected by manipulation of Sirt1 levels. We selected the panel of eight genes from the group of 276 genes in the intersection on the basis that they were reported to bind Sirt1 in mouse embryonic stem cells using a chromatin immunoprecipitation assay (Oberdoerffer et al. 2008). In contrast, four comparator non-target genes (outside the intersection of gene lists identified though our in silico analysis), for which we also measured effects of Sirt1 manipulation on DNA methylation, were not highlighted as sites of Sirt1 binding (Oberdoerffer et al. 2008). The fact that the two gene groups proved to be indistinct with respect to effects of Sirt1 expression level of DNA methylation (all four non-target genes were affected) may indicate that effects of Sirt1 on DNA methylation are mediated through a “remote” or indirect mechanism, or (more likely) that the Sirt1 forms either transient associations with regions of the genome to affect DNA methylation or forms associations in mouse ES cells that are at different sites to those in Caco-2 cells.
We observed effects on mRNA levels of six of the eight genes that fall into the intersection of our compiled lists of genes that underwent age-related changes in DNA methylation and for which DR affected expression (target genes), but only one of four genes for which we identified no evidence of either effect. This apparent greater tendency for the expression of target genes to be affected by Sirt1 level, is consistent with our hypothesis that the response to DR includes Sirt1-mediated effects on gene expression. The fact that there was no bias between the two gene panels with respect to co-incident effects of Sirt1 on DNA methylation does not rule out the possibility that effects of Sirt1 on expression are mediated through DNA methylation. Dissociation between measured effects of Sirt1 on DNA methylation and expression of genes may be explained through a process whereby Sirt1 levels affect DNA methylation across the genome, but where “hits” at some specific sites only have consequences for gene expression, whereas others are “silent”. The same argument may also explain the fact that we observed almost identical responses of TBX3 mRNA to Sirt1 manipulation in HuVECs as in Caco-2 cells, but different effects on DNA methylation of this gene. Demonstrating causal linkage between specific changes in gene methylation and expression remains a challenge that must be met to gain a comprehensive understanding of this mode of gene regulation. Determining effects on expression in cell line models of pharmacological modification of genome methylation (e.g. use of 5-aza-2′-deoxycytidine) gives information limited by the fact that methylation status cannot be controlled at the level of individual CpGs. Development and refinement of in vitro approaches based on methylation of promoter sequences driving expression of a (methylation silent) reporter gene (e.g. Coneyworth et al. 2009) may improve precision in this regard and, coupled with a more complete profile of the Sirt1-associated change in methylation of individual CpGs across specific genes, may determined if Sirt1-modified DNA methylation has functional consequences.
The changes in DNA methylation that we observed in response to altered levels of Sirt1 expression, although statistically significant, were small. In some cases, these differences were at CpG sites that showed low levels of methylation (e.g. EIF5 2 to 5 %) and, in other instances, at CpG sites that showed high levels of methylation (e.g. TBX3 77 to 91 %). Sirt1 overexpression in Caco-2 cells was achieved by transient transfection, which results in a substantial population of the cells assayed, remaining untransfected and so still having basal levels of Sirt1 expression. Thus, a substantial fraction of the DNA analysed will have retained background patterns of methylation, so the actual percentage changes in CpG site methylation in transfected cells will be larger than the values measured here which refer to DNA from the mixed population of transfected and “native” cells. Attempts to achieve stable overexpression of Sirt1 in Caco-2 cells were unsuccessful. Nonetheless, the changes in DNA methylation induced by Sirt1 manipulation may have been modest. There is wide discussion about whether or not such changes, which are typical responses to other dietary manipulations or changes seen in ageing, are likely to have functional consequences with respect to gene expression. Because DNA methylation is a binary phenomenon (a specific CpG site is either methylated or not methylated in a single cell), then any change within a single cell is a large change, and differences in percentage methylation reflect a shift in cell population, so it may have biological consequences at the level of tissue function.
To investigate the response of the transcriptome to a change in Sirt1 expression, we carried out analysis by microarray hybridisation of DNA from Caco-2 cells in which human Sirt1 expression was reduced by siRNA. We observed that the number of genes whose expression was affected by this manipulation that also appeared on our compiled list of DR-responsive genes was larger than that expected by chance, supporting the view that Sirt1 is a key mediator of the response of mammalian cells to DR and also validating Caco-2 cells with altered Sirt1 expression as an in vitro model of DR. Our list of genes affected by DR was compiled from measurements made in multiple tissues. Studies in which gene responses to DR in multiple tissues, which have been measured, have revealed that not only are some responses tissue specific, but that the same genes show opposite changes in different tissues (Fu et al. 2006; Selman et al. 2006). Therefore, in this analysis, we did not take into account the direction of gene responses to reduced Sirt1 expression.
Pathway analysis based on a relatively small number of regulated genes is not robust, so we do not present such an analysis in full. Nonetheless, it is of note that canonical pathways affected by human Sirt1 knockdown identified using the Ingenuity tool included “Metabolism of Xenobiotics by Cytochrome P450” as the fourth ranked match (−log (p value) = 2.9; ratio = 3.48 × 10⁻²), with the affected genes being CYP51A1 (a cytochrome P450), AKR1C1/AKR1C2 (an aldo-keto reductase), UGT1A6 (a UDP-glucuronosyltransferase) and GSTA1 (glutathione S-transferase). We highlight this observation because a transcriptomic screen to identify C. elegans genes expressed differentially in both the long-lived dauer larva and the daf-2 insulin/insulin-like growth factor-1 receptor long-lived mutant, compared with the wild-type adult, identified upregulation of genes involved in xenobiotic metabolism, specifically cytochrome P450, short-chain dehydrogenase/reductase, UDP-glucuronosyltransferase and glutathione S-transferase (McElwee et al. 2004). The authors proposed a plausible hypothesis to explain this observation—i.e. that lifespan is prolonged by enhanced metabolism of xenobiotics that would otherwise cause molecular damage. These parallel observations support the contention that Sirt1 may reduce aspects of the ageing cellular phenotype through a similar protective mechanism.
Clearly, there is a need for further research into effects of DR on epigenetic modifications and their downstream consequences, including tissue-specific effects, and into how interactions between effects within different tissues contribute to the physiological adaptation to DR at the level of the whole organism that extends healthspan/lifespan. Addressing this challenge will require systems biology approaches to use the extensive data already available to generate hypotheses on which to base design of experiments to begin to uncover these interactions (Kirkwood 2008). Recent observations, including that increased lifespan in response to DR in mice may be strain specific (Liao et al. 2010), and that transgenic Sirt1 overexpression has thus far not been reported to increase lifespan, may point towards the relevance of research aimed to elucidate mechanisms of Sirt1 action which reduce features of ageing, including invoking beneficial metabolic effects that increase “healthspan” rather than extend lifespan per se.
In conclusion, our in silico analysis and the effects we observed as a consequence of human Sirt1 manipulation on both gene methylation and expression in a cell line model support the view that Sirt1-mediated effects of DR include altered DNA methylation. These findings provide impetus for further research to address the extent to which such effects are pivotal in responses to DR in species with methylated genomes. Establishing a central role for effects of altered DNA methylation in the response to DR would reveal that different taxa invoke a range of different mechanisms to extend lifespan under such conditions. Profiling the effect of Sirt1 manipulation on DNA methylation across the genome—in both cell line and transgenic mouse models—may be illuminating, and further investigation of the effect of DR on DNA methylation in rodent models—taking advantage of new techniques for genome-wide measures of site-specific methylation—is warranted.
Electronic supplementary material
Primers and annealing temperatures used for RT-qPCR. Sequences are in the 5′–3′ direction, and subscript numerals refer to positions within the sequences deposited under the stated GenBank accession numbers (DOC 38 kb)
Primers and annealing temperatures used for pyrosequencing. PCR products were generated using HotStarTaq Master Mix (Qiagen) from bisulphite-converted DNA using primers (0.25 μM each) and annealing temperatures as listed, including a 5′ biotin label on the sense primer of the nested reaction (antisense for KLF3), as indicated, and the following cycling parameters: 95 °C, 15 min then 95 °C, 15 s; 40–58 °C (annealing), 60 s; 72 °C 60 s—35 cycles for the first-round PCR and 50 cycles for the nested reaction—followed by 72 °C for 5 min. Primers sequences are in the 5′ to 3′ direction, and subscript numbers indicate position relative to the transcription start site (DOC 43 kb)
Complied lists of genes used for the in silico analysis (XLS 1053 kb)
DNA microarray data for effects of Sirt1 knockdown in Caco-2 cells by two different siRNAs (XLS 181 kb)
Comparative effects on TBX3 DNA methylation at the three CpG sites in the region −135 to +1, relative to the start of transcription, of increasing (transgene overexpression) or reducing (siRNA) expression of Sirt1 in Caco-2 cells and HuVECs. Values for the control condition were derived through combining the data for controls for Sirt1 overexpression (plasmid minus Sirt1 transgene insert) and knockdown (control siRNA), which did not differ. Data are stated to the nearest 0.25 %, based on calculation of medians and quartiles from values rounded to the nearest 1 %. Q1 first quartile, Q3 third quartile. **P < 0.01, compared with control; #P < 0.05; ##P < 0.01, compared with SIRT1 overexpression, by Kruskal Wallis followed by Dunn’s multiple comparisons tests (DOC 33 kb)
Comparative effects on relative TBX3 mRNA levels of increasing (transgene overexpression) or reducing (siRNA) expression of Sirt1 in Caco-2 cells and HuVECs. Values for the control condition were derived through combining the data for controls for Sirt1 overexpression (plasmid minus Sirt1 transgene insert) and knockdown (control siRNA), which did not differ. Data are expressed relative to the mean for two reference genes—GAPDH and WNT11—for Caco-2 cells and relative to GAPDH for HuVECs and are normalised to the control condition. *P < 0.05 compared with control by one-way ANOVA followed by Tukey’s post test (DOC 30 kb)
Acknowledgments
This work was funded by the BBSRC (studentship to LJI and research grant nos. BBE0074571 and BBF0196371), Strategic Promotion of Ageing Research Capacity (SPARC), MRC (studentships to HJB and JEJH) and the Rank Prize Funds (studentship to SME).
Footnotes
Laura J Ions and Luisa A Wakeling are both joint first authors, based on equal contribution.
References
- Allard JS, Heilbronn LK, Smith C, Hunt ND, Ingram DK, Ravussin E, de Cabo R. In vitro cellular adaptations of indicators of longevity in response to treatment with serum collected from humans on calorie restricted diets. PLoS One. 2008;3(9):e3211. doi: 10.1371/journal.pone.0003211. [DOI] [PMC free article] [PubMed] [Google Scholar]
- Banks AS, Kon N, Knight C, Matsumoto M, Gutierrez-Juarez R, Rossetti L, Gu W, Accili D. SirT1 gain of function increases energy efficiency and prevents diabetes in mice. Cell Metab. 2008;8(4):333–341. doi: 10.1016/j.cmet.2008.08.014. [DOI] [PMC free article] [PubMed] [Google Scholar]
- Bjornsson HT, Sigurdsson MI, Fallin MD, Irizarry RA, Aspelund T, Cui H, Yu W, Rongione MA, Ekstrom TJ, Harris TB, Launer LJ, Eiriksdottir G, Leppert MF, Sapienza C, Gudnason V, Feinberg AP. Intra-individual change over time in DNA methylation with familial clustering. Jama. 2008;299(24):2877–2883. doi: 10.1001/jama.299.24.2877. [DOI] [PMC free article] [PubMed] [Google Scholar]
- Bordone L, Motta MC, Picard F, Robinson A, Jhala US, Apfeld J, McDonagh T, Lemieux M, McBurney M, Szilvasi A, Easlon EJ, Lin SJ, Guarente L. Sirt1 regulates insulin secretion by repressing UCP2 in pancreatic beta cells. PLoS Biol. 2006;4(2):e31. doi: 10.1371/journal.pbio.0040031. [DOI] [PMC free article] [PubMed] [Google Scholar]
- Bordone L, Cohen D, Robinson A, Motta MC, van Veen E, Czopik A, Steele AD, Crowe H, Marmor S, Luo J, Gu W, Guarente L. SIRT1 transgenic mice show phenotypes resembling calorie restriction. Aging cell. 2007;6(6):759–767. doi: 10.1111/j.1474-9726.2007.00335.x. [DOI] [PubMed] [Google Scholar]
- Bouchard L, Rabasa-Lhoret R, Faraj M, Lavoie ME, Mill J, Perusse L, Vohl MC. Differential epigenomic and transcriptomic responses in subcutaneous adipose tissue between low and high responders to caloric restriction. Am J Clin Nutr. 2010;91(2):309–320. doi: 10.3945/ajcn.2009.28085. [DOI] [PubMed] [Google Scholar]
- Burnett C, Valentini S, Cabreiro F, Goss M, Somogyvari M, Piper MD, Hoddinott M, Sutphin GL, Leko V, McElwee JJ, Vazquez-Manrique RP, Orfila AM, Ackerman D, Au C, Vinti G, Riesen M, Howard K, Neri C, Bedalov A, Kaeberlein M, Soti C, Partridge L, Gems D. Absence of effects of Sir2 overexpression on lifespan in C. elegans and Drosophila. Nature. 2011;477(7365):482–485. doi: 10.1038/nature10296. [DOI] [PMC free article] [PubMed] [Google Scholar]
- Canto C, Auwerx J. Calorie restriction: is AMPK a key sensor and effector? Physiol, Bethesda MD. 2011;26(4):214–224. doi: 10.1152/physiol.00010.2011. [DOI] [PMC free article] [PubMed] [Google Scholar]
- Christensen BC, Houseman EA, Marsit CJ, Zheng S, Wrensch MR, Wiemels JL, Nelson HH, Karagas MR, Padbury JF, Bueno R, Sugarbaker DJ, Yeh RF, Wiencke JK, Kelsey KT. Aging and environmental exposures alter tissue-specific DNA methylation dependent upon CpG island context. PLoS Genet. 2009;5(8):e1000602. doi: 10.1371/journal.pgen.1000602. [DOI] [PMC free article] [PubMed] [Google Scholar]
- Civitarese AE, Carling S, Heilbronn LK, Hulver MH, Ukropcova B, Deutsch WA, Smith SR, Ravussin E. Calorie restriction increases muscle mitochondrial biogenesis in healthy humans. PLoS Med. 2007;4(3):e76. doi: 10.1371/journal.pmed.0040076. [DOI] [PMC free article] [PubMed] [Google Scholar]
- Cohen HY, Miller C, Bitterman KJ, Wall NR, Hekking B, Kessler B, Howitz KT, Gorospe M, de Cabo R, Sinclair DA. Calorie restriction promotes mammalian cell survival by inducing the SIRT1 deacetylase. Science. 2004;305(5682):390–392. doi: 10.1126/science.1099196. [DOI] [PubMed] [Google Scholar]
- Coneyworth LJ, Davison G, Blackwell C, Mathers JC, Valentine RA, Ford D. Differential methylation of the SLC30A5 zinc transporter gene in cancerous compared with normal human colon epithelium. Proc Physiol Soc. 2009;16:C14. [Google Scholar]
- Conti V, Corbi G, Russomanno G, Simeon V, Ferrara N, Filippelli W, Limongelli F, Canonico R, Grasso C, Stiuso P, Dicitore A, Filippelli A. Oxidative stress effects on endothelial cells treated with different athletes’ sera. Med Sci Sports Exercise. 2012;44(1):39–49. doi: 10.1249/MSS.0b013e318227f69c. [DOI] [PubMed] [Google Scholar]
- Corbi G, Conti V, Scapagnini G, Filippelli A, Ferrara N. Role of sirtuins, calorie restriction and physical activity in aging. Front Biosci (Elite Ed) 2012;4:768–778. doi: 10.2741/e417. [DOI] [PubMed] [Google Scholar]
- Cragg RA, Christie GR, Phillips SR, Russi RM, Kury S, Mathers JC, Taylor PM, Ford D. A novel zinc-regulated human zinc transporter, hZTL1, is localized to the enterocyte apical membrane. J Biol Chem. 2002;277(25):22789–22797. doi: 10.1074/jbc.M200577200. [DOI] [PubMed] [Google Scholar]
- Dhahbi JM, Tsuchiya T, Kim HJ, Mote PL, Spindler SR. Gene expression and physiologic responses of the heart to the initiation and withdrawal of caloric restriction. J Gerontol. 2006;61(3):218–231. doi: 10.1093/gerona/61.3.218. [DOI] [PubMed] [Google Scholar]
- Dong Y, Guo T, Traurig M, Mason CC, Kobes S, Perez J, Knowler WC, Bogardus C, Hanson RL, Baier LJ. SIRT1 is associated with a decrease in acute insulin secretion and a sex specific increase in risk for type 2 diabetes in Pima Indians. Mol Genet Metab. 2011;104(4):661–665. doi: 10.1016/j.ymgme.2011.08.001. [DOI] [PMC free article] [PubMed] [Google Scholar]
- Donmez G, Guarente L. Aging and disease: connections to sirtuins. Aging cell. 2010;9(2):285–290. doi: 10.1111/j.1474-9726.2010.00548.x. [DOI] [PubMed] [Google Scholar]
- Donmez G, Wang D, Cohen DE, Guarente L. SIRT1 suppresses beta-amyloid production by activating the alpha-secretase gene ADAM10. Cell. 2010;142(2):320–332. doi: 10.1016/j.cell.2010.06.020. [DOI] [PMC free article] [PubMed] [Google Scholar] [Retracted]
- Eden A, Gaudet F, Waghmare A, Jaenisch R. Chromosomal instability and tumors promoted by DNA hypomethylation. Science. 2003;300(5618):455. doi: 10.1126/science.1083557. [DOI] [PubMed] [Google Scholar]
- Ferrara N, Rinaldi B, Corbi G, Conti V, Stiuso P, Boccuti S, Rengo G, Rossi F, Filippelli A. Exercise training promotes SIRT1 activity in aged rats. Rejuvenation Res. 2008;11(1):139–150. doi: 10.1089/rej.2007.0576. [DOI] [PubMed] [Google Scholar]
- Ford D, Ions LJ, Alatawi F, Wakeling LA. The potential role of epigenetic responses to diet in ageing. Proc Nutr Soc. 2011;70:374–384. doi: 10.1017/S0029665111000851. [DOI] [PubMed] [Google Scholar]
- Fraga MF, Ballestar E, Paz MF, Ropero S, Setien F, Ballestar ML, Heine-Suner D, Cigudosa JC, Urioste M, Benitez J, Boix-Chornet M, Sanchez-Aguilera A, Ling C, Carlsson E, Poulsen P, Vaag A, Stephan Z, Spector TD, Wu YZ, Plass C, Esteller M. Epigenetic differences arise during the lifetime of monozygotic twins. Proc Natl Acad Sci U S A. 2005;102(30):10604–10609. doi: 10.1073/pnas.0500398102. [DOI] [PMC free article] [PubMed] [Google Scholar]
- Fraga MF, Agrelo R, Esteller M. Cross-talk between aging and cancer: the epigenetic language. Ann N Y Acad Sci. 2007;1100:60–74. doi: 10.1196/annals.1395.005. [DOI] [PubMed] [Google Scholar]
- Fu C, Hickey M, Morrison M, McCarter R, Han ES. Tissue specific and non-specific changes in gene expression by aging and by early stage CR. Mech Ageing Dev. 2006;127(12):905–916. doi: 10.1016/j.mad.2006.09.006. [DOI] [PMC free article] [PubMed] [Google Scholar]
- Gaudet F, Hodgson JG, Eden A, Jackson-Grusby L, Dausman J, Gray JW, Leonhardt H, Jaenisch R. Induction of tumors in mice by genomic hypomethylation. Science. 2003;300(5618):489–492. doi: 10.1126/science.1083558. [DOI] [PubMed] [Google Scholar]
- Gonzalo S, Jaco I, Fraga MF, Chen T, Li E, Esteller M, Blasco MA. DNA methyltransferases control telomere length and telomere recombination in mammalian cells. Nature Cell Biol. 2006;8(4):416–424. doi: 10.1038/ncb1386. [DOI] [PubMed] [Google Scholar]
- Guarente L, Picard F. Calorie restriction—the SIR2 connection. Cell. 2005;120(4):473–482. doi: 10.1016/j.cell.2005.01.029. [DOI] [PubMed] [Google Scholar]
- Han ES, Hickey M. Microarray evaluation of dietary restriction. J Nutr. 2005;135(6):1343–1346. doi: 10.1093/jn/135.6.1343. [DOI] [PubMed] [Google Scholar]
- Hass BS, Hart RW, Lu MH, Lyn-Cook BD. Effects of caloric restriction in animals on cellular function, oncogene expression, and DNA methylation in vitro. Mutat Res. 1993;295(4–6):281–289. doi: 10.1016/0921-8734(93)90026-y. [DOI] [PubMed] [Google Scholar]
- Heyn H, Li N, Ferreira HJ, Moran S, Pisano DG, Gomez A, Diez J, Sanchez-Mut JV, Setien F, Carmona FJ, Puca AA, Sayols S, Pujana MA, Serra-Musach J, Iglesias-Platas I, Formiga F, Fernandez AF, Fraga MF, Heath SC, Valencia A, Gut IG, Wang J, Esteller M. Distinct DNA methylomes of newborns and centenarians. Proc Natl Acad Sci U S A. 2012;109(26):10522–10527. doi: 10.1073/pnas.1120658109. [DOI] [PMC free article] [PubMed] [Google Scholar]
- Higami Y, Pugh TD, Page GP, Allison DB, Prolla TA, Weindruch R. Adipose tissue energy metabolism: altered gene expression profile of mice subjected to long-term caloric restriction. FASEB J. 2004;18(2):415–417. doi: 10.1096/fj.03-0678fje. [DOI] [PubMed] [Google Scholar]
- Issa JP, Ottaviano YL, Celano P, Hamilton SR, Davidson NE, Baylin SB. Methylation of the oestrogen receptor CpG island links ageing and neoplasia in human colon. Nat Genet. 1994;7(4):536–540. doi: 10.1038/ng0894-536. [DOI] [PubMed] [Google Scholar]
- Jackson KA, Helston RM, McKay JA, O’Neill ED, Mathers JC, Ford D. Splice variants of the human zinc transporter ZnT5 (SLC30A5) are differentially localised and regulated by zinc through transcription and mRNA stability. J Biol Chem. 2007;282:10423–10431. doi: 10.1074/jbc.M610535200. [DOI] [PubMed] [Google Scholar]
- Kirkwood TB. A systematic look at an old problem. Nature. 2008;451(7179):644–647. doi: 10.1038/451644a. [DOI] [PubMed] [Google Scholar]
- Koch CM, Wagner W. Epigenetic-aging-signature to determine age in different tissues. Aging (Albany, NY) 2011;3(10):1018–1027. doi: 10.18632/aging.100395. [DOI] [PMC free article] [PubMed] [Google Scholar]
- Koch CM, Suschek CV, Lin Q, Bork S, Goergens M, Joussen S, Pallua N, Ho AD, Zenke M, Wagner W. Specific age-associated DNA methylation changes in human dermal fibroblasts. PLoS One. 2011;6(2):e16679. doi: 10.1371/journal.pone.0016679. [DOI] [PMC free article] [PubMed] [Google Scholar]
- Kwabi-Addo B, Chung W, Shen L, Ittmann M, Wheeler T, Jelinek J, Issa JP. Age-related DNA methylation changes in normal human prostate tissues. Clin Cancer Res. 2007;13(13):3796–3802. doi: 10.1158/1078-0432.CCR-07-0085. [DOI] [PubMed] [Google Scholar]
- Lee CK, Allison DB, Brand J, Weindruch R, Prolla TA. Transcriptional profiles associated with aging and middle age-onset caloric restriction in mouse hearts. Proc Natl Acad Sci U S A. 2002;99(23):14988–14993. doi: 10.1073/pnas.232308999. [DOI] [PMC free article] [PubMed] [Google Scholar]
- Liao CY, Rikke BA, Johnson TE, Diaz V, Nelson JF. Genetic variation in the murine lifespan response to dietary restriction: from life extension to life shortening. Aging cell. 2010;9(1):92–95. doi: 10.1111/j.1474-9726.2009.00533.x. [DOI] [PMC free article] [PubMed] [Google Scholar]
- Lin SJ, Kaeberlein M, Andalis AA, Sturtz LA, Defossez PA, Culotta VC, Fink GR, Guarente L. Calorie restriction extends Saccharomyces cerevisiae lifespan by increasing respiration. Nature. 2002;418(6895):344–348. doi: 10.1038/nature00829. [DOI] [PubMed] [Google Scholar]
- Maegawa S, Hinkal G, Kim HS, Shen L, Zhang L, Zhang J, Zhang N, Liang S, Donehower LA, Issa JP (2010) Widespread and tissue specific age-related DNA methylation changes in mice. Genome Res. doi:10.1101/gr.096826.109 [DOI] [PMC free article] [PubMed]
- Massaro D, Massaro GD, Baras A, Hoffman EP, Clerch LB. Calorie-related rapid onset of alveolar loss, regeneration, and changes in mouse lung gene expression. Am J Physiol Lung Cell Mol Physiol. 2004;286(5):L896–L906. doi: 10.1152/ajplung.00333.2003. [DOI] [PubMed] [Google Scholar]
- Mathers JC, Ford D (2009) Nutrition, epigenetics and aging. In: Choi SW, Friso S (eds) Nutrients and epigenetics. CRC Press (Taylor and Francis Group), pp 175-205
- McElwee JJ, Schuster E, Blanc E, Thomas JH, Gems D. Shared transcriptional signature in Caenorhabditis elegans dauer larvae and long-lived daf-2 mutants implicates detoxification system in longevity assurance. J Biol Chem. 2004;279(43):44533–44543. doi: 10.1074/jbc.M406207200. [DOI] [PubMed] [Google Scholar]
- Milagro FI, Campion J, Cordero P, Goyenechea E, Gomez-Uriz AM, Abete I, Zulet MA, Martinez JA. A dual epigenomic approach for the search of obesity biomarkers: DNA methylation in relation to diet-induced weight loss. FASEB J. 2011;25(4):1378–1389. doi: 10.1096/fj.10-170365. [DOI] [PubMed] [Google Scholar]
- Minor RK, Allard JS, Younts CM, Ward TM, de Cabo R. Dietary interventions to extend life span and health span based on calorie restriction. J Geront. 2010;65(7):695–703. doi: 10.1093/gerona/glq042. [DOI] [PMC free article] [PubMed] [Google Scholar]
- Miyamura Y, Tawa R, Koizumi A, Uehara Y, Kurishita A, Sakurai H, Kamiyama S, Ono T. Effects of energy restriction on age-associated changes of DNA methylation in mouse liver. Mutat Res. 1993;295(2):63–69. doi: 10.1016/0921-8734(93)90002-K. [DOI] [PubMed] [Google Scholar]
- Nisoli E, Tonello C, Cardile A, Cozzi V, Bracale R, Tedesco L, Falcone S, Valerio A, Cantoni O, Clementi E, Moncada S, Carruba MO. Calorie restriction promotes mitochondrial biogenesis by inducing the expression of eNOS. Science. 2005;310(5746):314–317. doi: 10.1126/science.1117728. [DOI] [PubMed] [Google Scholar]
- Oberdoerffer P, Michan S, McVay M, Mostoslavsky R, Vann J, Park SK, Hartlerode A, Stegmuller J, Hafner A, Loerch P, Wright SM, Mills KD, Bonni A, Yankner BA, Scully R, Prolla TA, Alt FW, Sinclair DA. SIRT1 redistribution on chromatin promotes genomic stability but alters gene expression during aging. Cell. 2008;135(5):907–918. doi: 10.1016/j.cell.2008.10.025. [DOI] [PMC free article] [PubMed] [Google Scholar]
- Rakyan VK, Down TA, Maslau S, Andrew T, Yang TP, Beyan H, Whittaker P, McCann OT, Finer S, Valdes AM, Leslie RD, Deloukas P, Spector TD. Human aging-associated DNA hypermethylation occurs preferentially at bivalent chromatin domains. Genome Res. 2010;20(4):434–439. doi: 10.1101/gr.103101.109. [DOI] [PMC free article] [PubMed] [Google Scholar]
- Richardson B. Impact of aging on DNA methylation. Ageing Res Rev. 2003;2(3):245–261. doi: 10.1016/S1568-1637(03)00010-2. [DOI] [PubMed] [Google Scholar]
- Rogina B, Helfand SL. Sir2 mediates longevity in the fly through a pathway related to calorie restriction. Proc Natl Acad Sci U S A. 2004;101(45):15998–16003. doi: 10.1073/pnas.0404184101. [DOI] [PMC free article] [PubMed] [Google Scholar]
- Rutanen J, Yaluri N, Modi S, Pihlajamaki J, Vanttinen M, Itkonen P, Kainulainen S, Yamamoto H, Lagouge M, Sinclair DA, Elliott P, Westphal C, Auwerx J, Laakso M. SIRT1 mRNA expression may be associated with energy expenditure and insulin sensitivity. Diabetes. 2010;59(4):829–835. doi: 10.2337/db09-1191. [DOI] [PMC free article] [PubMed] [Google Scholar]
- Selman C, Kerrison ND, Cooray A, Piper MD, Lingard SJ, Barton RH, Schuster EF, Blanc E, Gems D, Nicholson JK, Thornton JM, Partridge L, Withers DJ. Coordinated multitissue transcriptional and plasma metabonomic profiles following acute caloric restriction in mice. Physiol Genomics. 2006;27(3):187–200. doi: 10.1152/physiolgenomics.00084.2006. [DOI] [PubMed] [Google Scholar]
- Sharov AA, Falco G, Piao Y, Poosala S, Becker KG, Zonderman AB, Longo DL, Schlessinger D, Ko M. Effects of aging and calorie restriction on the global gene expression profiles of mouse testis and ovary. BMC Biol. 2008;6:24. doi: 10.1186/1741-7007-6-24. [DOI] [PMC free article] [PubMed] [Google Scholar]
- Swindell WR. Comparative analysis of microarray data identifies common responses to caloric restriction among mouse tissues. Mech Ageing Dev. 2008;129(3):138–153. doi: 10.1016/j.mad.2007.11.003. [DOI] [PMC free article] [PubMed] [Google Scholar]
- Teschendorff AE, Menon U, Gentry-Maharaj A, Ramus SJ, Weisenberger DJ, Shen H, Campan M, Noushmehr H, Bell CG, Maxwell AP, Savage DA, Mueller-Holzner E, Marth C, Kocjan G, Gayther SA, Jones A, Beck S, Wagner W, Laird PW, Jacobs IJ, Widschwendter M. Age-dependent DNA methylation of genes that are suppressed in stem cells is a hallmark of cancer. Genome Res. 2010;20(4):440–446. doi: 10.1101/gr.103606.109. [DOI] [PMC free article] [PubMed] [Google Scholar]
- Tissenbaum HA, Guarente L. Increased dosage of a sir-2 gene extends lifespan in Caenorhabditis elegans. Nature. 2001;410(6825):227–230. doi: 10.1038/35065638. [DOI] [PubMed] [Google Scholar]
- Tsuchiya T, Dhahbi JM, Cui X, Mote PL, Bartke A, Spindler SR. Additive regulation of hepatic gene expression by dwarfism and caloric restriction. Physiol Genomics. 2004;17(3):307–315. doi: 10.1152/physiolgenomics.00039.2004. [DOI] [PubMed] [Google Scholar]
- Wakeling LA, Ions LJ, Ford D. Could Sirt1-mediated epigenetic effects contribute to the longevity response to dietary restriction and be mimicked by other dietary interventions? Age (Dordr) 2009;31:327–341. doi: 10.1007/s11357-009-9104-5. [DOI] [PMC free article] [PubMed] [Google Scholar]
- Wang Y, Leung FC. An evaluation of new criteria for CpG islands in the human genome as gene markers. Bioinformatics. 2004;20(7):1170–1177. doi: 10.1093/bioinformatics/bth059. [DOI] [PubMed] [Google Scholar]
- Wu P, Shen Q, Dong S, Xu Z, Tsien JZ, Hu Y. Calorie restriction ameliorates neurodegenerative phenotypes in forebrain-specific presenilin-1 and presenilin-2 double knockout mice. Neurobiol Aging. 2008;29(10):1502–1511. doi: 10.1016/j.neurobiolaging.2007.03.028. [DOI] [PubMed] [Google Scholar]
Associated Data
This section collects any data citations, data availability statements, or supplementary materials included in this article.
Supplementary Materials
Primers and annealing temperatures used for RT-qPCR. Sequences are in the 5′–3′ direction, and subscript numerals refer to positions within the sequences deposited under the stated GenBank accession numbers (DOC 38 kb)
Primers and annealing temperatures used for pyrosequencing. PCR products were generated using HotStarTaq Master Mix (Qiagen) from bisulphite-converted DNA using primers (0.25 μM each) and annealing temperatures as listed, including a 5′ biotin label on the sense primer of the nested reaction (antisense for KLF3), as indicated, and the following cycling parameters: 95 °C, 15 min then 95 °C, 15 s; 40–58 °C (annealing), 60 s; 72 °C 60 s—35 cycles for the first-round PCR and 50 cycles for the nested reaction—followed by 72 °C for 5 min. Primers sequences are in the 5′ to 3′ direction, and subscript numbers indicate position relative to the transcription start site (DOC 43 kb)
Complied lists of genes used for the in silico analysis (XLS 1053 kb)
DNA microarray data for effects of Sirt1 knockdown in Caco-2 cells by two different siRNAs (XLS 181 kb)
Comparative effects on TBX3 DNA methylation at the three CpG sites in the region −135 to +1, relative to the start of transcription, of increasing (transgene overexpression) or reducing (siRNA) expression of Sirt1 in Caco-2 cells and HuVECs. Values for the control condition were derived through combining the data for controls for Sirt1 overexpression (plasmid minus Sirt1 transgene insert) and knockdown (control siRNA), which did not differ. Data are stated to the nearest 0.25 %, based on calculation of medians and quartiles from values rounded to the nearest 1 %. Q1 first quartile, Q3 third quartile. **P < 0.01, compared with control; #P < 0.05; ##P < 0.01, compared with SIRT1 overexpression, by Kruskal Wallis followed by Dunn’s multiple comparisons tests (DOC 33 kb)
Comparative effects on relative TBX3 mRNA levels of increasing (transgene overexpression) or reducing (siRNA) expression of Sirt1 in Caco-2 cells and HuVECs. Values for the control condition were derived through combining the data for controls for Sirt1 overexpression (plasmid minus Sirt1 transgene insert) and knockdown (control siRNA), which did not differ. Data are expressed relative to the mean for two reference genes—GAPDH and WNT11—for Caco-2 cells and relative to GAPDH for HuVECs and are normalised to the control condition. *P < 0.05 compared with control by one-way ANOVA followed by Tukey’s post test (DOC 30 kb)