

Abstract
Immune status is different in the elderly and the young, but whether age-associated differences are similar in developing and industrialized countries is unclear. To approach this question, peripheral blood immune cell phenotypes were analyzed by polychromatic flow cytometry in 50 young and 50 elderly men in a pilot study in a rural area of Pakistan. As a group, the elderly had a significantly lower CD4:CD8 ratio, a lower percentage of CD8+ naïve T cells, and significantly higher percentage of late-differentiated memory cells than the young. No age-associated differences were seen in B cells or NK cells. CD8+ cells as a percentage of CD3+ T cells were positively associated with plasma CRP levels but not other factors. We conclude that there are differences between the peripheral immune cell phenotypes of young and elderly Pakistani men and that these seem broadly similar to those more extensively documented in industrialized countries, despite the marked societal, nutritional, and many other differences in these populations.
Keywords: Aging, Immunity, T cells, B cells, Immunosenescence, Developing country
Introduction
Life expectancy has increased globally over the past two centuries by almost 30 years and by almost 20 years in the last five decades alone (Christensen et al. 2009). This very recent phenomenon emerged as a consequence of improvements in nutrition, hygiene, antimicrobial therapy and vaccinations, and other medical interventions (Pawelec et al. 2009; WHO 2002). Changes in the immune system with aging have been studied extensively over the past few decades, although formally most have investigated differences between young and old people in cross-sectional studies and only imputed changes. The conclusion from the majority of these studies is that aging leads to marked detrimental changes in the composition, function, and competence of the human immune system, commonly termed ‘immunosenescence’ (Larbi et al. 2008; Aw et al. 2007). At least partly as a consequence, older populations experience increased morbidity and premature mortality, for example, from respiratory tract pathogens (Jartti et al. 2011), an increase in gastrointestinal infections (Larbi et al. 2008), and diminished antigen-specific responses to orally administered vaccines (Grubeck-Loebenstein et al. 2009; Hagiwara et al. 2003). Major age-related phenotypic and functional changes to the T-cell arm of adaptive immunity occur, while B-cell function (Frasca et al. 2008) and the innate immune system (Solana et al. 2006) may be less markedly affected.
The accepted hallmark of ‘immunosenescence’ is a decrease in the proportions and numbers of peripheral naïve T cells, especially CD8+ T cells, and reciprocal increases in memory cells (Derhovanessian et al. 2009). Naïve T cells are those that have not yet encountered their cognate antigen, so that it is assumed that during normal aging such encounters gradually decrease the numbers of naïve cells and increase the memory T cells. In addition to the conversion of naïve to memory cells, there is also a gradual loss of functional capacity, cellular integrity, and diversity of both the CD4+ and CD8+ T-cell repertoire with aging (Larbi et al. 2008). The effects of these changes on T cell properties may be further increased if the elderly person is also suffering from a state of malnutrition (Alam et al. 2011).
With the current shifts in demographics resulting in an ever-increasing fraction of elderly people also in developing countries, we need a clear understanding of the relationships between aging and immunity. This is relatively well established for the populations of industrialized countries but not for developing countries. Here, our objectives were to determine the effects of aging in a sample of young and elderly individuals in a developing country in order to determine whether normal aging has any association with alterations in the frequency of peripheral blood lymphocyte subsets in such a less well-studied population. Furthermore, this pilot study was conducted in a rural population in order to ascertain the general applicability of the immunological findings worldwide.
Materials and methods
Study subjects
Participants in the current study were recruited from Peshawar, Pakistan. Potential subjects expressing interest in blood donation were first screened by obtaining a verbal medical history to rule out any health conditions or medication use that could affect immune responses. For the current study, we used a subsample from our previous study conducted in Peshawar, Pakistan (Alam et al. 2011). We selected a convenience sample of 50 families and from each family we selected one young and one elderly subject fulfilling the inclusion criteria. Clinically, healthy subjects were included when they had no history of disease and were not regularly taking any drugs.
Data collection
Age and anthropometrics
Detailed procedures for collection of data on anthropometric measurements and body composition are reported elsewhere (Alam et al. 2011). Briefly, age was assessed from the official records of the subjects (the National Identity Card). Weight and height were measured and body mass index (BMI) was calculated as: weight/height2 (kilograms per square meter). Waist circumference (WC) and hip circumference were measured in accordance with standard procedures, and waist to hip ratio (WHR) was calculated. Percent body fat (%BF) was assessed using Futrex-5000 according to the procedures recommended by the manufacturer (Futrex®, Hagerstown, MD).
Immunological studies
For assessment of immune phenotypes, blood samples were collected aseptically by venipuncture between 9:00 and 11:00 am. Approximately 20 ml of whole blood was obtained from each subject, drawn into two 9-ml EDTA vacutainers (Becton Dickinson, Franklin Lakes, NJ). The samples were processed following a procedure especially developed and validated for analyses on frozen whole blood (Alam et al. 2012). Blood samples were stored in a −80 °C freezer until further analysis. After thawing in a 37 °C water bath, red cells in blood samples were lysed with saline and water. The cells were then stained with 50 μl of an antibody cocktail and incubated for 30 min at room temperature in the dark. For intracellular FOXP3 staining, cells were resuspended in 1.0 ml FOXP3 Fix/Perm (Biolegend, San Diego, CA), vortexed and incubated for 20 min at room temperature in the dark, followed by washing with PFEA and FOXP3 Perm buffer. The cells were resuspended in 50 μl FOXP3 Perm buffer containing FOXP3 antibody, incubated for 30 min at room temperature in the dark, washed with PFEA, and resuspended in PFEA. The monoclonal antibodies and fluorescent conjugates used were CD3 (Pacific Orange); CD3 (Alexa Fluor 700), CD4 (PerCP), CD8 (APC-H7), and CD8 (Qdot 705); CD27 (Qdot-605), CD28 (PE), and CD28 (PercP-Cy 5-5); CD45RO (Alex Fluor 400); KLRG1 (Alexa Fluor 488); CD45RA (Qdot 655); CD127 (APC e-Fluor 780); CD57 (FITC); and FOXP3 (PE). Cell populations were measured using an LSR-II flow cytometer and the acquisition software BD FACSDiva (Becton Dickinson).
Clinical chemistry analysis
Plasma was separated from another set of blood samples (approximately 10 ml) by centrifugation at 1,200×g and stored in a −80 °C freezer in the Department of Human Nutrition, Agriculture University Peshawar. These samples were shipped on dry ice to the Center for Medical Research (ZMF), Tübingen University, Germany, where they were stored at −80 °C until further analysis. Albumin, ferritin, C-reactive protein (CRP), triglycerides, and total protein concentrations were measured on a Modular Analytics SWA automated analyzer system according to the manufacturer’s recommendations (Roche Diagnostics, Mannheim, Germany). All the clinical chemistry analyses were performed in the facilities of Department of Clinical Chemistry, University Medical Center Göttingen, Germany.
The study was approved by the Board of Studies, Department of Human Nutrition, Agriculture University Peshawar. Written informed consent was obtained from all the participants before the start of the study.
Statistical analysis
All the data were statistically analyzed using JMP (Version 8.0. SAS, USA). We took p < 0.05 to denote a significant difference after correction for the number of comparisons.
Results
Age and anthropometric characteristics
Age and general characteristics of the study subjects are shown in Table 1. Age of the young and elderly subjects ranged 18.0–29.2 (mean, SD, 24.2 ± 3.4) and 50–85.5 (mean, SD, 67.3 ± 8.7), respectively. Compared to the elderly, the young had higher mean BMI and WHR, while the elderly had higher mean weight, WC, and %BF. However, all these differences lacked statistical significance except %BF.
Table 1.
General characteristics the subjects
| Anthropometry | Young | Elderly | p value | ||
|---|---|---|---|---|---|
| Mean (SD) | Range | Mean (SD) | Range | ||
| Age (years) | 24.2 (3.43) | 18.0–29.2 | 67.3 (8.77) | 50.1–85.5 | – |
| Weight (kg) | 67.6 (14.02) | 45.3–92.4 | 68.7 (14.57) | 46.0–97.0 | 0.7329 |
| BMI (kg/m2) | 25.0 (5.37) | 16.3–33.4 | 24.2 (5.47) | 15.4–33.8 | 0.5056 |
| WC | 82.1 (11.20) | 64.1–102.2 | 86.7 (12.39) | 62.1–113.2 | 0.0735 |
| WHR | 1.0 (0.11) | 0.70–1.17 | 0.9 (0.12) | 0.67–1.21 | 0.3676 |
| %BF | 17.7 (8.48) | 5.5–33.1 | 21.3 (7.99) | 9.0–32.6 | 0.0200 |
Peripheral immune cell distribution in the young and elderly
T cells
The distribution of CD4+ and CD8+ T cells and their subsets in the young and elderly are depicted in Figs. 1, 2, 3, 4, and 5. Figure 1a shows that the percentage of CD4+ T cells as a fraction of all CD3+ cells in the young tended to be higher than in the elderly but this difference did not achieve significance. However, the elderly did have significantly greater percentages of CD8+ cells than the young (p < 0.0001). As a result of this, the mean CD4:CD8 ratio was significantly higher in the young than elderly (p = 0.02; Fig. 1b). Most of the young (80 %; 24.1 ± 3.3 year) had a CD4:CD8 ratio ≥1, while only 46 % of the elderly (65.8 ± 8.4 year) had a normal CD4:CD8 ratio. This is even greater than the ca. 15 % of very elderly Swedes (85 year) with an inverted CD4:CD8 ratio, established in studies giving rise to the concept of the “immune risk profile” (IRP) predictive of 2-, 4-, and 6-year mortality (Derhovanessian et al. 2009) and consistent with the notion of the chronologically earlier occurrence of ‘immunosenescence’ in this Pakistani population. There was no difference in the mean age of those young with a CD4:CD8 ratio ≥1.0 or <1.0 (24.1 ± 3.3 and 24.9 ± 3.6 year). Similarly, in the elderly, there was no difference in the mean ages of those with a CD4:CD8 ratio ≥1.0 or <1.0 (65.9 ± 8.2 year and 68.6 ± 8.8 year).
Fig. 1.

Percentages of CD4+ and CD8+ cells in young (white bars) and elderly (black bars) and average CD4:CD8 ratios
Fig. 2.
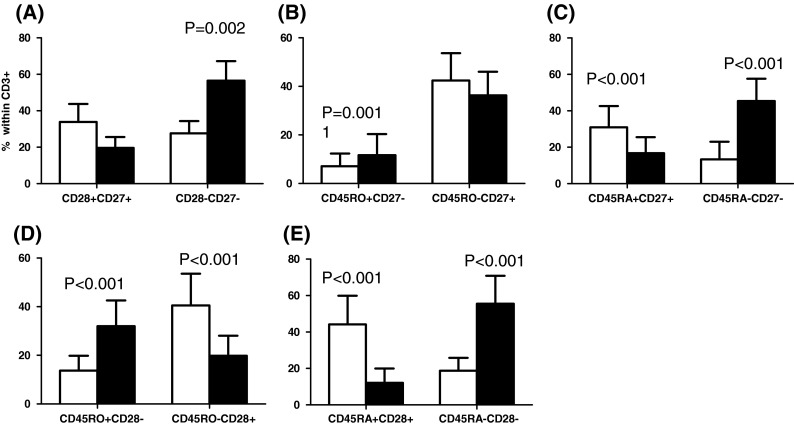
Distribution of CD28+CD27+, CD28−CD27−, CD45RO+CD27−, CD45RO−CD27+, CD45RA+CD27+, CD45RA−CD27−, CD45RO+CD28−, CD45RO−CD28+, CD45RA+CD28+, CD45RA−CD28− cells within the CD8+ subset in young (white bars) and elderly (black bars)
Fig. 3.
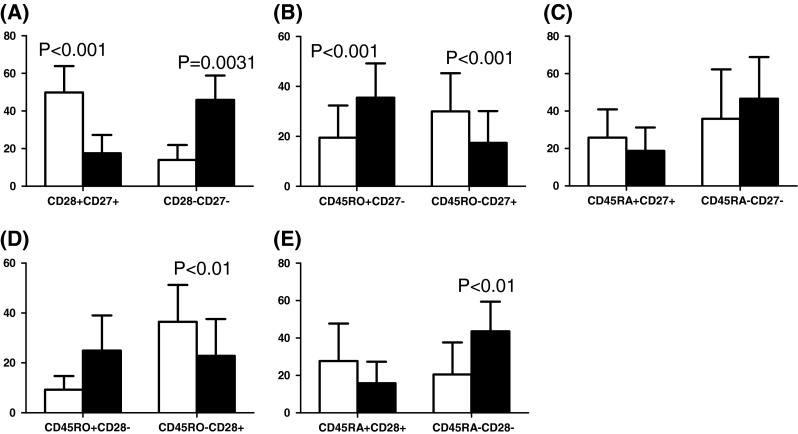
Distribution of CD28+CD27+, CD28−CD27−, CD45RO+CD27−, CD45RO−CD27+, CD45RA+CD27+, CD45RA−CD27−, CD45RO+CD28−, CD45RO−CD28+, CD45RA+CD28+, CD45RA−CD28− cells within CD4+ cells in young (white bars) and elderly (black bars)
Fig. 4.
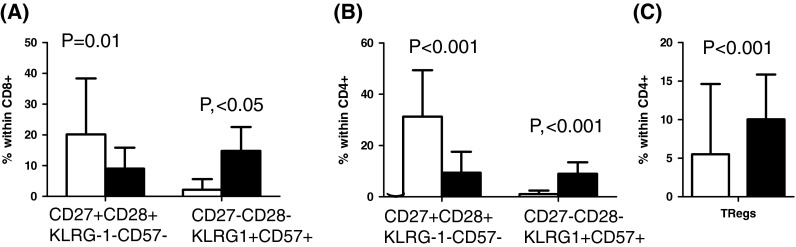
Distribution of CD27+CD28+KLRG1−CD57−, CD27−CD28−KLRG1+CD57+ cells within CD8+ (a), CD4+ (b), and Tregs in young (white bars) and elderly (black bars)
Fig. 5.

Distribution of B, IgD+CD27−, IgD−CD27+, and NK cells in young (white bars) and elderly (black bars)
There was a significantly greater percentage of CD27−CD28− cells both within the CD8+ (Fig. 2a) and the CD4+ (Fig. 3a) subset in the elderly. These surface markers are informative for the state of differentiation of the T cells. Within the CD8+ subset, the young tended to have a higher percentage of CD27+CD28+ cells (less differentiated, more naïve) than the elderly, and did have significantly fewer CD8+CD27−CD28− cells (more differentiated, memory; Fig. 2a). This significantly greater percentage of memory cells and tendency for fewer naïve cells is also exactly a characteristic of the IRP seen in very elderly Swedes (Wikby et al. 2005). The frequency distributions of CD8+ cells with other phenotypes in young and elderly people were as follows: significantly more memory CD45RO+CD27− cells in the elderly (Fig. 2b); significantly more naïve CD45RA+CD27+ cells in the young; significantly less memory CD45RA−CD27− cells in the young (Fig. 2c); significantly more memory CD45RO+CD28− cells in the elderly (Fig. 2d); and significantly more naïve CD45RA+CD28+ cells in the young and more memory CD45RA−CD28− cells in the elderly (Fig. 2e). Thus, when comparing T cell differentiation stages using different constellations of surface markers, very similar results emerge from this analysis, suggesting its overall robustness.
Age-associated differences within the CD4+ T cell subset are generally less marked than in the CD8 subset, according to most published studies of Western populations. Here, however, we found that the frequency of CD4+CD27+CD28+ naïve cells was significantly higher in the younger than in the elderly (Fig. 3a) and, as with CD8+ cells, there were significantly more memory CD4+CD27−CD28− cells in the elderly compared to young (Fig. 3a). Significantly more CD45RO+CD27− cells were also present in the elderly compared to the young but there were more naïve CD45RO−CD27+ cells in the young (Fig. 3b). Other CD4+ cell phenotypic comparisons showed more CD45RO−CD28+ cells in the young (Fig. 3d); and more CD45RA−CD28− in the elderly (Fig. 3e). Differences between young and elderly for other phenotypes were not significant. These data are again consistent with the elderly having more memory cells and less naïve cells also within the CD4+ subset, a result somewhat more extreme than commonly reported in the literature on Western populations.
Further detailed analysis of T cell differentiation stages, using more sophisticated polychromatic flow cytometry, showed that many of the CD8+CD27−CD28− cells from the elderly co-expressed the negative NK cell receptors KLRG1 and CD57 (thought to identify the most late-differentiated, possibly dysfunctional, or “senescent” cells). This phenotype was found significantly more frequently in the elderly than the young (Fig. 4a) and was again also true for CD4+ cells with an even higher significance (Fig. 4b). This mirrors what we know about ‘immunosenescence’ in Western populations.
A final T cell population that we measured in this pilot study was the so-called T-regulatory cells. These are CD4+ T cells thought to negatively regulate the responses of other T cells, and are identified by the co-expression of high levels of CD25, low levels of CD127, and the presence of the FoxP3 transcription factor in the nucleus. Here, we found that the percentage of these Tregs (CD4+CD25+CD127−FOXP3+) in the elderly was significantly greater than in the young (Fig. 4c). This would perhaps contribute to a state of diminished immune reactivity in the elderly and increase their susceptibility to infection.
B cells and NK cells
Figure 5 shows the percentage of naïve and memory B cells (IgD+CD27−, IgD−CD27+), as well as NK cells (CD56+CD16+). The elderly tended to have more B cells overall, more memory IgD−CD27+ B cells and more NK cells than the young. However, these differences were not significant (p for all trends ≥0.05; Fig. 5a–c). Nonetheless, the percentage of naïve IgD+CD27− B cells was significantly higher in the young (Fig. 5b).
Correlation between age and CD8+, CD4+ cells, and their phenotypes
Figure 6 shows correlation analyses. Age had a significant effect on the percentage of CD8+ cells within the T cell population in this cross-sectional study (Fig. 6a), while the percentage of CD4+ cells tended to be lower with age (Fig. 6d). CD27+CD28+KLRG1−CD57− cells within both the CD4+ and CD8+ subsets were highly significantly lower in the elderly. These cells are the least differentiated, most likely true naïve, T cells of both major subsets. Similarly, a significant reciprocal increase in CD27−CD28−KLRG1+CD57+ cells within the CD8+ and CD4+ subsets with age suggests the accumulation of late-differentiated memory cells, at the expense of reduced naïve cells.
Fig. 6.
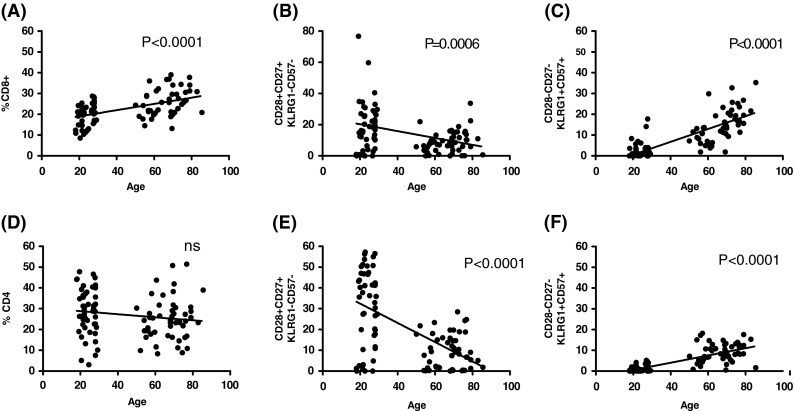
Correlation analysis of age with CD4+ and CD8+ cells and their subsets
Correlation between plasma biochemicals and CD4 and CD8 cells
There was a significant increase in both CD8+ and CD4+ cells with an increase in plasma CRP (p = 0.003 and 0.0041, respectively). The other plasma factors (albumin, total protein, triglycerides, and ferritin) had no significant correlations with the percentages of CD8+ and CD4+ cells (p for all trends >0.05).
Discussion
The effects of aging on immune functions have been extensively investigated, but almost exclusively in “WEIRD” subjects (Western, educated, industrialized, rich, and democratic). It is not established whether immune alterations found in these populations are representative of the majority of the world’s peoples. Even in medically healthy elderly, the overall impact of aging on immune status is that the proportion of memory cells versus naïve cells increases. In the process of aging over time, more memory cells are generated; the body has only a limited capacity of cells it can sustain and the immune system favors memory over naïve cells, which is the basis of adaptive immunity. These age-associated alterations and their consequences have been reviewed elsewhere by us (Derhovanessian et al. 2008; Larbi et al. 2008; Pawelec et al. 1999) and many others.
The present study found a tendency towards the presence of lower percentages of CD4+ cells and reciprocally, highly significantly more CD8+ (p < 0.0001) cells in the elderly compared to the young in a rural population of Pakistani men. There was also a significantly (p = 0.02) lower CD4:CD8 ratio in the elderly than young people (Fig. 1a). In analogy to older Western (Swedish) populations, these values would put many Pakistani elderly in the IRP group which is found in a minority of people over 65 in Sweden, and which is known to become predictive of incipient mortality from 85 years of age (Wikby et al. 2008). The definition of “aged” in Pakistan is considerably lower than 65 year (Alam et al. 2011), and in parallel with this, possibly the IRP also occurs at an earlier age. Whether this is indeed predictive of mortality in this Pakistani population remains to be established in longitudinal follow-up studies.
Consistent with many previous studies, there was a reduction in CD28 expression by CD8+ T cells with ageing, presumably as a result of increased antigen exposures over time and lack of expression of CD28 on CD8+ memory cells. In a more extreme manner than usually reported in Western populations, however, there was also a decrease in CD4+ naïve T cells. This may be due to exposure to different constellations of more pathogens, and is similar to what we have observed in Western Alzheimer patients, where amyloid-β may be driving naïve CD4+ T cells to differentiate to memory cells (Larbi et al. 2009).
CD45RA and CD45RO are also often-studied cell surface markers informative for the differentiation state of the cell; thus, they have been reported to be expressed on reciprocal subsets of T lymphocytes in humans and have been used to help delineate naïve and memory phenotypes, respectively (Akbar et al. 1988; 1991; Koch et al. 2008). As alluded to above, the reduced proportion of naïve T cells commonly seen in the elderly has been assumed to be the result of thymic involution (and the accompanying decreased capacity to generate new naïve T cells) and prolonged exposure to different antigens throughout life (Akbar et al. 2004). Initial activation of the T cell results in a loss of CD45RA and acquisition of the shorter isoform CD45RO on the cell surface (Hamann et al. 1997). Later in the differentiation pathway, effector memory cells may re-express CD45RA, which can be co-expressed with cell surface markers of late-stage differentiation, or even “senescence,” especially when co-expressed with KLRG-1 (Voehringer et al. 2000). Consistent with this scenario established in Western populations, in the present study, compared to the young, elderly people had more CD8+CD27−CD28−KLRG1+CD57+ (p < 0.001) (Fig. 4a) and CD4+CD27−CD28−KLRG1+CD57+ cells (p < 0.001; Fig. 4b). It has previously been shown that older individuals have relatively higher frequencies of KLRG1+, CD57+, and CD28− cells in the peripheral blood in CD4+ and/or CD8+ T lymphocyte subsets compared to young individuals (Brzezinska 2005; Koch et al. 2008). Cells with these phenotypes have been reported to be incapable of proliferation in response to antigenic stimulation (Ibegbu et al. 2005). A larger proportion of CD45RO+ cells has also been noted in this population in older individuals (Gabriel et al. 1993). It has previously been suggested that the KLRG1+CD57+ population is a senescent phenotype and the KLRG1+CD57− subset is a population of effector or central memory cells destined to become senescent (Ibegbu et al. 2005).
Although B and NK cells seem to be the least affected by aging as also demonstrated in the current study of non-significant differences in percent B cells, IgD−CD27+ and NK cells (Fig. 5a, b, c), changes in the peripheral B cell number with aging have been reported in Western populations (e.g., Caruso et al. 2009) with reductions in naïve B cells and increases in memory cells (Weksler and Szabó 2000; Gibson et al. 2009). However, discrepant results have been reported for memory B cells (Agematsu et al. 2000; Colonna-Romano et al. 2009).
In general, it seems that most or all of the differences between young and old Pakistani men that we have established here appear to be very similar to results from studies conducted in industrialized countries, although the impact on CD4+ as well as CD8+ T cells seems more notable (Derhovanessian et al. 2009) and there are more people in the IRP at a younger age. The data are consistent with chronologically earlier onset of immunosenescence in Pakistani men than in Western populations. They may thus represent true reflections of the impact of ageing on immunity, independently of a plethora of differences between the different populations tested, including nutritional and socioeconomic, as well as potentially genetic and psychological factors, but with different kinetics in different populations.
Limitations of the current study
This is a pilot study with relatively few individuals and small group sizes; many of the tendencies noted here could possibly achieve statistical significance in larger groups. This needs exploring. Potential gender differences could not be addressed because only men could be accessed for this study, but comparisons with women need to be made. Other limitations of this study include a lack of data on immune functions; however, this was outside the scope of this pilot study, and will be pursued in follow-up. Most important will be the follow-up of this population over time. This remains to be tested. The blood samples in the present study were collected following a tight schedule, i.e., between 9:00 and 11:00 am, in order to minimize the possible effects of circadian rhythmicity shown by certain immune cells (Mazzoccoli et al. 2011a, b; 2010; Plytyzc and Seljelid 1997). In humans, total white blood cell counts have been reported to peak at different times of day (Plytyzc and Seljelid 1997) and there has been some seminal research work reporting the effects of circadian rhythms on the numbers of certain T and B cell subtypes (Mazzoccoli et al. 2011a, b; 2010). Statistically significant difference in the observed values of CD20 and TSH serum levels (higher in the young and middle-aged) and CD25+ and HLA−DR+ T-cells (higher in the elderly) have been reported (Mazzoccoli et al. 2010). The need to give due consideration to potential effects of circadian rhythmicity with reported effects on some of the circulating lymphocytes has therefore been recommended (Mazzoccoli et al. 2011a, b; 2010). The 2-h window for blood sampling practiced here was most likely short enough to avoid any of these problems.
Acknowledgments
We thank the German Academic Exchange Program (DAAD) for granting a scholarship to IA, and the European Commission [FP7 259679 “IDEAL”]; German Research Foundation [DFG-PA 361/14-1]; and the German Federal Ministry of Education and Research [BMBF 0315890F, “Gerontoshield”] for financial support.
Contributor Information
Iftikhar Alam, Email: iftikharalam@aup.edu.pk.
Graham Pawelec, Email: graham.pawelec@uni-tuebingen.de.
References
- Agematsu K, Hokibara S, Nagumo H, Komiyama A. CD27: a memory B-cell marker. Immunol Today. 2000;21:204–206. doi: 10.1016/S0167-5699(00)01605-4. [DOI] [PubMed] [Google Scholar]
- Akbar AN, Terry L, Timmas A, Beverley PCL, Janossy G. Loss of CD45R and gain of UCHLI reactivity is a feature of primed T cells. J Immunol. 1988;140:2171–2178. [PubMed] [Google Scholar]
- Akbar AN, Salmon M, Janossy G. The synergy between naive and memory T cells during activation. Immunol Today. 1991;12:184–188. doi: 10.1016/0167-5699(91)90050-4. [DOI] [PubMed] [Google Scholar]
- Akbar AN, Beverley PC, Salmon M. Will telomere erosion lead to a loss of T-cell memory? Nat Rev Immunol. 2004;4:737–743. doi: 10.1038/nri1440. [DOI] [PubMed] [Google Scholar]
- Alam I, Larbi A, Pawelec G, Paracha PI. Relationship between anthropometric variables and nutrient intake in apparently healthy male elderly individuals: a study from Pakistan. Nutr J. 2011;10:111. doi: 10.1186/1475-2891-10-111. [DOI] [PMC free article] [PubMed] [Google Scholar]
- Alam I, Goldeck D, Larbi A, Pawelec G. Flow cytometric lymphocyte subset analysis using material from frozen whole blood. J Immunoass Immunochem. 2012;33:128–139. doi: 10.1080/15321819.2011.604370. [DOI] [PubMed] [Google Scholar]
- Aw D, Silva AB, Palmer DB. Immunosenescence: emerging challenges for an aging population. Immunol. 2007;120:435–446. doi: 10.1111/j.1365-2567.2007.02555.x. [DOI] [PMC free article] [PubMed] [Google Scholar]
- Brzezinska A. Does in vitro replicative senescence of human CD8+ cells reflect the phenotypic changes observed during in vivo ageing? Acta Biochimica Polonica. 2005;52:931–935. [PubMed] [Google Scholar]
- Caruso C, Buffa S, Candore G, Colonna-Romano G, Dunn-Walters D, Kipling D, Pawelec G. Mechanisms of immunosenescence. Immun Ageing. 2009;6:10. doi: 10.1186/1742-4933-6-10. [DOI] [PMC free article] [PubMed] [Google Scholar]
- Christensen K, Doblhammer G, Rau R, Vaupel JW. Ageing populations: the challenges ahead. Lancet. 2009;374:1196–1208. doi: 10.1016/S0140-6736(09)61460-4. [DOI] [PMC free article] [PubMed] [Google Scholar]
- Colonna-Romano G, Bulati M, Aquino A, Pellicanò M, Vitello S, Lio D, Candore G, Caruso C. A double-negative (IgD−CD27−) B cell population is increased in the peripheral blood of elderly people. Mech Ageing Dev. 2009;130:681–690. doi: 10.1016/j.mad.2009.08.003. [DOI] [PubMed] [Google Scholar]
- Derhovanessian E, Solana R, Larbi A, Pawelec G. Immunity, ageing and cancer. Immun Ageing. 2008;24:5–11. doi: 10.1186/1742-4933-5-11. [DOI] [PMC free article] [PubMed] [Google Scholar]
- Derhovanessian E, Larbi A, Pawelec G. Biomarkers of human immunosenescence: impact of Cytomegalovirus infection. Curr Opin Immunol. 2009;21:440–445. doi: 10.1016/j.coi.2009.05.012. [DOI] [PubMed] [Google Scholar]
- Frasca D, Landin AM, Riley RL, Blomberg BB. Mechanisms for decreased function of B cells in aged mice and humans. J Immunol. 2008;180:2741–2746. doi: 10.4049/jimmunol.180.5.2741. [DOI] [PubMed] [Google Scholar]
- Gabriel H, Schmitt B, Kindermann W. Age-related increase of CD45RO + lymphocytes in physically active adults. Eur J Immunol. 1993;23:2704–2706. doi: 10.1002/eji.1830231049. [DOI] [PubMed] [Google Scholar]
- Gibson KL, Wu YC, Barnett Y, Duggan O, Vaughan R, Kondeatis E, Nilsson BO, Wikby A, Kipling D, Dunn-Walters DK. B cell diversity decreases in old age and is correlated with poor health status. Aging Cell. 2009;8:18–25. doi: 10.1111/j.1474-9726.2008.00443.x. [DOI] [PMC free article] [PubMed] [Google Scholar]
- Grubeck-Loebenstein B, Della Bella S, Iorio AM, Michel JP, Pawelec G, Solana R. Immunosenescence and vaccine failure in the elderly. Aging Clin Exp Res. 2009;21:201–209. doi: 10.1007/BF03324904. [DOI] [PubMed] [Google Scholar]
- Hagiwara Y, McGhee JR, Fujihashi K. Protective mucosal immunity in aging is associated with functional CD4+ T cells in nasopharyngeal-associated lymphoreticular tissue. J Immunol. 2003;170:1754–1762. doi: 10.4049/jimmunol.170.4.1754. [DOI] [PubMed] [Google Scholar]
- Hamann D, Baars PA, Rep MH, Hooibrink B, Kerkhof-Garde SR, Klein MR, Van Lier RAW. Phenotypic and functional separation of memory and effector human CD8+ T cells. J Exp Med. 1997;186:1407–1418. doi: 10.1084/jem.186.9.1407. [DOI] [PMC free article] [PubMed] [Google Scholar]
- Ibegbu C, Xu Y, Harris W, Maggio D, Miller JD, Kourtis AP. Expression of killer cell lectin-like receptor G1 on antigen-specific human CD8+ T lymphocytes during active, latent, and resolved infection and its relation with CD57. J Immunol. 2005;174:6088–6094. doi: 10.4049/jimmunol.174.10.6088. [DOI] [PubMed] [Google Scholar]
- Jartti L, Langen H, Söderlund-Venermo M, Vuorinen T, Ruuskanen O, Jartti T. New respiratory viruses and the elderly. Open Respir Med. 2011;J5:61–69. doi: 10.2174/1874306401105010061. [DOI] [PMC free article] [PubMed] [Google Scholar]
- Koch S, Larbi A, Derhovanessian E, Ozcelik D, Naumova E, Pawelec G. Multiparameter flow cytometric analysis of CD4 and CD8 T cell subsets in young and old people. Immun Ageing. 2008;25:5–6. doi: 10.1186/1742-4933-5-6. [DOI] [PMC free article] [PubMed] [Google Scholar]
- Larbi A, Franceschi C, Mazzatti D, Solana R, Wikby A, Pawelec G. Aging of the immune system as a prognostic factor for human longevity. Physiology (Bethesda) 2008;23:64–74. doi: 10.1152/physiol.00040.2007. [DOI] [PubMed] [Google Scholar]
- Larbi A, Pawelec G, Witkowski JM, Schipper HM, Derhovanessian E, Goldeck D, Fulop T. Dramatic shifts in circulating CD4 but not CD8 T cell subsets in mild Alzheimer’s disease. J Alzheimers Dis. 2009;17:91–103. doi: 10.3233/JAD-2009-1015. [DOI] [PubMed] [Google Scholar]
- Mazzoccoli G, De Cata A, Greco A, Damato M, Marzulli N, Dagostino MP, Carughi S, Perfetto F, Tarquini R. Aging related changes of circadian rhythmicity of cytotoxic lymphocyte subpopulations. J Circadian Rhythms. 2010;8:6. doi: 10.1186/1740-3391-8-6. [DOI] [PMC free article] [PubMed] [Google Scholar]
- Mazzoccoli G, Carughi S, Sperandeo M, Pazienza V, Giuliani F, Greco A. Alteration of circadian rhythmicity of CD3 + CD4+ lymphocyte subpopulation in healthy aging. J Biol Regul Homeost Agents. 2011;25:405–416. [PubMed] [Google Scholar]
- Mazzoccoli G, Sothern RB, De Cata A, Giuliani F, Fontana A, Copetti M, Pellegrini F, Tarquini R. A timetable of 24-hour patterns for human lymphocyte subpopulations. J Biol Regul Homeost Agents. 2011;25:387–395. [PubMed] [Google Scholar]
- Pawelec G, Effros RB, Caruso C, Remarque E, Barnett Y, Solana R. T cells and aging. Front Biosci. 1999;4:216–269. doi: 10.2741/Pawelec. [DOI] [PubMed] [Google Scholar]
- Pawelec G, Derhovanessian E, Larbi A, Strindhall J, Wikby A. Cytomegalovirus and human immunosenescence. Rev Med Virol. 2009;19:47–56. doi: 10.1002/rmv.598. [DOI] [PubMed] [Google Scholar]
- Plytyzc B, Seljelid R. Rhythms of immunity. Arch Immunol Ther Exp (Warsz) 1997;45:157–162. [PubMed] [Google Scholar]
- Solana R, Pawelec G, Tarazona R. Aging and innate immunity. Immunity. 2006;24:491–494. doi: 10.1016/j.immuni.2006.05.003. [DOI] [PubMed] [Google Scholar]
- Voehringer D, Koschella M, Pircher H. Lack of proliferative capacity of human effector and memory T cells expressing killer cell lectin-like receptor G1 (KLRG1) Blood. 2000;100:3698–3702. doi: 10.1182/blood-2002-02-0657. [DOI] [PubMed] [Google Scholar]
- Weksler ME, Szabó P. The effect of age on the B-cell repertoire. J Clin Immunol. 2000;20:240–249. doi: 10.1023/A:1006659401385. [DOI] [PubMed] [Google Scholar]
- WHO, World Health Organization (2002) The European Health Report 2002. WHO Regional Publications, European series no. 97.Geneva, Switzerland: World Health Organization 2002 [PubMed]
- Wikby A, Ferguson F, Forsey R, Thompson J, Strindhall J, Löfgren S, Nilsson BO, Ernerudh J, Pawelec G, Johansson BJ. An immune risk phenotype, cognitive impairment, and survival in very late life: impact of allostatic load in Swedish octogenarian and nonagenarian humans. J Gerontol A Biol Sci Med Sci. 2005;60:556–565. doi: 10.1093/gerona/60.5.556. [DOI] [PubMed] [Google Scholar]
- Wikby A, Månsson IA, Johansson B, Strindhall J, Nilsson SE. The immune risk profile is associated with age and gender: findings from three Swedish population studies of individuals 20–100 years of age. Biogerontology. 2008;9:299–308. doi: 10.1007/s10522-008-9138-6. [DOI] [PubMed] [Google Scholar]