Abstract
Optical tweezers are microscopic tools with extraordinary precision in the determination of the position (±2 nm) of a colloid (diameter: ∼2.0 μm) in 3D-space and in the measurement of small forces in the range between 0.1 and 100 pN (pN=10−12 N). Experiments are reported in which single double-stranded (ds)-DNA chains of different length [2,000 base pairs (bp), 3,000, 4,000, and 6,000 bp] are spanned between two colloidal particles by use of appropriate molecular linkers. For the forces applied (≤40 pN) a fully reversible and well reproducible force–extension dependence is found. The data can be well described by both the worm-like chain model or by an approach developed by R. G. Winkler. For the resulting persistence length, a pronounced dependence on the ionic concentration in the surrounding medium is found.
Keywords: Optical tweezers, Single polymers, Stretching
Introduction
Photonic forces [1, 2] are known and understood for more than 100 years. But the discovery that they can be employed to manipulate small objects like colloids, viruses, or quantum dots became possible only after the establishment of strong laser sources in the infrared [3]. This enables one to exert and to control forces acting on a small object in the range between 10−1 to 100 pN with an extraordinary high resolution of ±50 fN. By incorporating additional optical systems to determine the position of a microscopic particle in 3D-space with nanometer precision, the novel experimental tool of optical tweezers was invented. This initiated a manifold of spectacular experiments in biophysics [4a–j] and colloid research [5]. It became, for instance, possible to measure the elastic properties of λ-phage DNA [6] on a single chain level, the RNA polymerase was monitored for a single enzyme in action [7], or the work which has to be done to package bacteriophage DNA into a single viral capsule was measured [8]. In colloid physics, microscopic measurements of the pair interaction potential of two charge-stabilized colloids became possible [9] or direct determination of the cross correlations between two particles in an external potential [10].
Experiments with optical tweezers on the elastic properties of DNA are mainly restricted to λ-phage DNA which has a contour length of ∼16 μm. In the presented article, novel experiments are reported in which the DNA under study is systematically varied in its length by genetic engineering. This enables one to analyze in great detail the elastic properties of DNA and to check how well it can be described by the worm-like chain model [11] or competing approaches.
Materials and methods
The optical tweezers set-up
The optical tweezers set-up (Fig. 1) is based on an inverted microscope (Axiovert S 100 TV, Carl Zeiss, Jena, Germany) which is designed for epi-illumination fluorescence microscopy. For the optical tweezers, a diode pumped Nd:YAG laser (1,064 nm, 1 W, LCS-DTL 322; Laser 2000, Wessling, Germany) is used which is mounted to the microscope by the base port. The power and the profile of the laser are monitored before the radiation is coupled into the microscope. After passing the isolator a quarter-wave plate is employed to produce circular polarized light to exclude effects due to reflection differences between the p- and s-part of the laser light. The beam is expanded and coupled into the back aperture of the microscope objective (Plan-Neofluor 100×1.30 Oil, Carl Zeiss, Jena, Germany). After passing through the sample cell, the beam is recollimated by a condenser with high numerical aperture. A beam splitting mirror and a convex lens images the forward scattered light of the bead in the optical trap onto a 10×10 mm2 quadrant photodiode (S 5107, Hamamatsu, Herrsching am Ammersee, Germany) for the electrical position detection. Video imaging and the optical position detection is accomplished by a digital camera (KP–F 120, Hitachi, Düsseldorf, Germany). The optical stage can be positioned in three dimensions with nanometer resolution using piezoactuators (controller: E-710, stage: P-517.3CD, PI GmbH, Karlsruhe, Germany). The sample cell consists of a closed chamber which can be flushed (inset Fig. 1). A micropipette (self-made) with an inner diameter at the tip of ∼1 μm is inserted into the chamber to hold one bead by capillary action. To determine the position of both beads and its separation image analysis is employed. By measuring and fitting the intensity profile of the two beads (Fig. 2), its position relative to each other can be determined with an accuracy of ±2 nm.
Fig. 1.
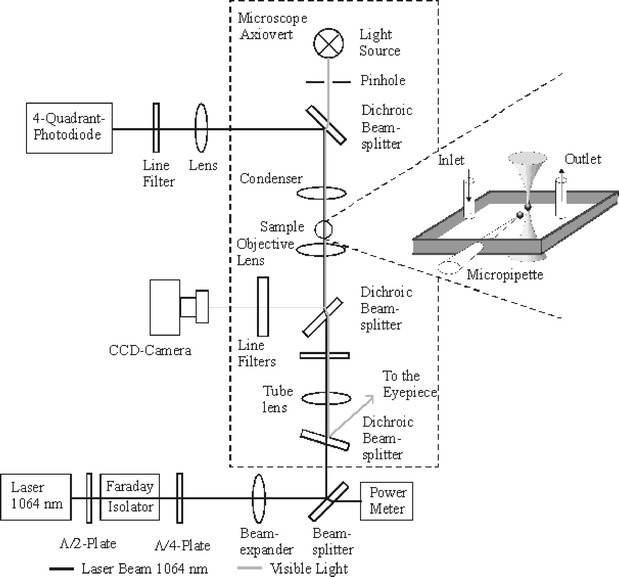
Scheme of the experimental set-up. In the enlargement, the sample chamber is shown
Fig. 2.

Image analysis of two separate beads: measured (a, b) and calculated (c) intensity profile using the fit function:  (3)
(3)  (4) where for each colloid (x
i,y
i) is the center position, r
i the optical radius, A
i the amplitude of the profile relative to the background image intensity. I
0 and a
i are parameters to consider the dark diffuse ring around the colloid
The calibration of the optical trap is based on Stokes law F=6 πηrν where η is the viscosity of the medium, r the radius of the bead, and ν its velocity relative to the surrounding solution. Varying the latter between 50 and 1,000 μm/s enables one to calibrate the optical forces with an accuracy of ±10%. As expected for the power dependence of the force constant of the optical trap, a linear relationship is obtained (Fig. 3). The whole experimental set-up is in a temperature controlled (±1°) room. Due to the fact that the focus of the microscope changes with 1° by about 500 nm, the actual measurements are fully computer-controlled and carried out automatically within sequences of about 2–3 min. Afterwards, the z-positions have to be—if necessary—readjusted.
Fig. 3.
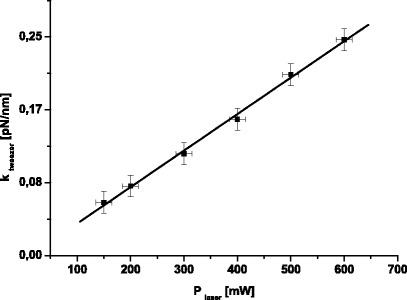
Calibration of the forces of the optical trap based on Stokes law
Preparation
Streptavidin-modified polystyrene beads with a diameter of 2 μm were purchased from Polysciences Europe (Eppelheim, Germany), oligonucleotides provided by Metabion (Martinsried, Germany) and MWG (Ebersberg, Germany). Nucleic acid purification kits were supplied by QIAGEN (Hilden, Germany) and anti-DIG antibodies were purchased from Roche (Penzberg, Germany). All enzymes and standards were from MBI Fermentas (Vilnius, Lithuania) and all other chemicals were delivered from Sigma (Deisenhofen, Germany).
The double stranded DNA handles were amplified from the plasmid pUC18 in case of the 2,000 bp product, from pET28a+ in case of the 3,000 and 4,000 bp product, and from pTWIN1 in case of the 6,000 bp product via standard polymerase chain reactions (PCR). The oligonucleotides which were used were Primer A (5′-Bio-CCA CCT GAC GTC TAA GAA ACC-3′) and Primer B (5′-Dig-GGC AAC AAC GTT GCG CAA AC-3′) for the 2,000 bp dsDNA, Primer C (5′-Dig-ACG GCC TCA ACC TAC TAC TG-3′) and Primer D (5′-Bio-GCG ATA AGT CGT GTC TTA CC-3′) for the 3,000 bp dsDNA, Primer E (5′-Dig-CAG CTT CCT TTC GGG CTT TG-3′) and Primer F (5′-Bio-TGA TTG CCC GAC ATT ATC GC-3′) for the 4,000 bp dsDNA, and Primer G (5′-Dig-ATG GAG GCG GAT AAA GTT GC-3′) and Primer H (5′-Bio-GTTGAATCACCGCGTAATCG-3′) for the 6,000 bp dsDNA. DNA-handles were labeled with digoxygenine or biotine at their termini via 5′-end modifications of the primers carried out by Metabion or MWG (Fig. 4a). The distribution of nucleotides in the artificial ds-DNA and λ-DNA was proven to be well comparable (Table 1).
Fig. 4.
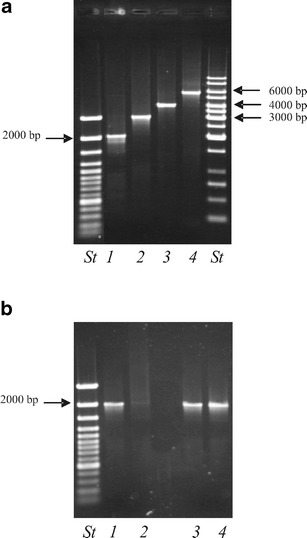
a The DNAs with the lengths 2,000, 3,000, 4,000, and 6,000 bp were analyzed on a 1.0 % agarose gel to check their correct size. b Result of the binding assay. In lane 1 and 3 60 fmol of 2,000 bp DNA are shown as a reference. Lane 2 shows the result of the binding of the 2,000 bp DNA to the anti-DIG antibody labeled beads. Lane 4 shows the negative control with carboxylated beads only
Table 1.
Comparison of the distributions of nucleotides for the used DNA samples
| DNA | Number of base pairs | Distribution | Chemically amplified by |
|---|---|---|---|
| Handle 2000 BD | 2,000 bp | A: 486 bp (24.2%) | pUC18 |
| C: 522 bp (26.0%) | |||
| G: 532 bp (26.5%) | |||
| T: 471 bp (23.4%) | |||
| Handle 3000 BD | 3,000 bp | A: 665 bp (22.2%) | pET28a+ |
| C: 858 bp (28.6%) | |||
| G: 829 bp (27.6%) | |||
| T: 648 bp (21.6%) | |||
| Handle 4000 BD | 4,000 bp | A: 888 bp (22.2%) | pET28a+ |
| C: 1,097 bp (27.4%) | |||
| G: 1,114 bp (27.9%) | |||
| T: 901 bp (22.5%) | |||
| Handle 6000 BD | 6,000 bp | A: 1,474 bp (24.6%) | pTwin1 |
| C: 1,528 bp (25.5%) | |||
| G: 1,642 bp (27.4%) | |||
| T: 1,356 bp (22.6%) | |||
| Lambda-DNA | 48,502 bp | A: 12,334 bp (25.4%) | |
| C:11,362 bp (23.4%) | |||
| G: 12,820 bp (26.4%) | |||
| T: 11,986 bp (24.7%) |
The immobilization process was mainly deduced from protocols previously published by Nustad et al. [12], Quash et al. [13], and Siiman et al. [14]. For the production of antidigoxigenin (anti-DIG) antibody covered polystyrene beads, carboxylated particles with a diameter of 2.0 μm were used. The beads from a 50 μl bead suspension (26.5 mg/ml) were washed twice with 200 μl of carbonate buffer (100 mM sodium carbonate, 100 mM sodium bicarbonate, pH 9.6) and three times with 200 μl buffer A (20 mM phosphate buffer, pH 4.5). In between beads were collected by centrifugation (5 min 13,000×g). After resuspension of the final bead pellet in 50 μl buffer A, the surface carboxyl groups were activated by a 4-h incubation at room temperature with 50 μl of a 2% EDC solution (Ethyl-3-(3-dimethylaminopropyl)-carbodiimide) in the same buffer. Particles were washed three times with buffer A. After resuspension in 80 μl buffer B (200 mM borate buffer, pH 8.5), 10 μl of anti-DIG antibody solution (1 μg Ab/μl) were added followed by overnight shaking at room temperature. To avert unspecific binding at remaining free reactive groups, the pellet was resuspended in 100 μl BSA solution (10 mg BSA/ml in buffer B) and incubated under shaking for 30 min at room temperature. This blocking step was repeated one more time. Finally, the particles were resuspended in 20 μl PBS (136 mM NaCl, 2.7 mM KCl, 15.6 mM Na2HPO4, 17.6 mM KH2PO4), and stored at 4°C.
To determine the coupling efficiency 5 μl of particle suspension were mixed with 50–200 ng of a 2,000 bp PCR-amplified DNA fragment, carrying a digoxygenine and a biotine modification at each terminus, respectively, in a total volume of 10 μl PBS. This mixture was then incubated for 15 min at room temperature. As a negative control, unmodified carboxylated particles were treated in the same manner. The whole suspension was than applied to a 1.5% agarose gel electrophoresis from which the particle bound DNA fraction could be estimated (Fig. 4b).
Establishing a single DNA chain between two colloids
To establish single DNA strands between two colloids, the following procedure turned out to be effective and reliable (Fig. 5): A bead with anti-DIG antibodies was captured with the optical trap and brought in contact with the micropipette where it was fixed by capillary forces. Afterwards, a SA-modified bead covered with DNA was placed with the optical trap in the immediate neighborhood of the fixed anti-DIG-bead so that still a visible distance between the particles was maintained. If a molecular contact was established, a sudden decrease in the fluctuation amplitude of the bead could be observed. After a short incubation time of ∼1 min, the particles are pulled apart to ensure that a single ds-DNA had bound only.
Fig. 5.
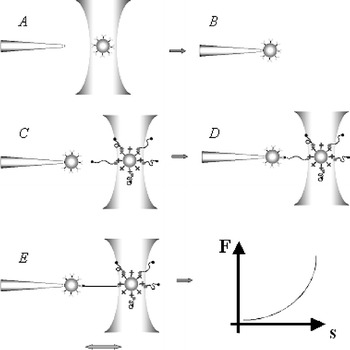
Assembly of a single ds-DNA chain between two colloids. A polystyrene (PS) bead modified with anti-DIG antibodies is trapped with the optical tweezers (a) and fixed by a micropipette due to capillary forces (b). In the next step, a PS bead on which ds-DNA is immobilized via Biotin–Streptavidin linkers is captured with the optical tweezers and brought in the immediate neighborhood of the colloid held by the micropipette (c). Binding between the Digoxigenin labeled end of a DNA strand with an antidigoxigenin antibody on the surface of the bead held by the micropipette is observed as a sudden decrease of the Brownian fluctuations of the bead in the optical trap (d). By measuring the force extension dependence, it is ensured that just one ds-DNA strand is fixed between the beads
Results and discussion
The force–extension dependence (Fig. 6) of ds-DNA of varying lengths between 2,000 to 6,000 bp can be described for forces ≤10 pN [18] by the worm-like chain model suggesting for the force f stretching a chain:
 |
1 |
where Lp is the persistence length, L0 the contour length, x the extension, kB is Boltzmann’s constant, and T the absolute temperature. In principle, L0 is given by the number of base pairs assuming a length of 0.34 nm [15] per pair. But due to the fact that the polystyrene colloid with antidigoxigenin antibodies had an uneven surface (with ±100 nm deviations from the ideal spherical shape), the contour length was determined from the fits using Eqs. 1 or 2. Comparing these values (Table 2) with the calculated lengths delivers agreement within the above mentioned absolute uncertainties of ±100 nm.
Fig. 6.
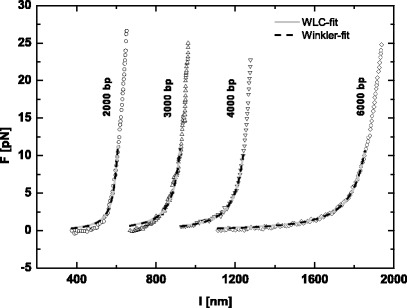
Force-extension dependence for single ds-DNA chains of different length as indicated. The solid line indicates a fit using the worm-like chain model while the dashed line corresponds to Winkler’s approach. The experimental uncertainly is ±0.5 pN
Table 2.
Contour lengths as calculated from the number of base pairs assuming 0.34 nm length per base pair and as determined from the fits using the WLC model or the Winkler approach
| Number of base pairs | Theoretical contour length L 0 (nm) | Experimentally determined contour length L 0 with WLC fit (nm) | Experimentally determined contour length L 0 with Winkler fit (nm) |
|---|---|---|---|
| 2,000 | 680 | 652 | 654 |
| 3,000 | 1,020 | 999 | 1,004 |
| 4,000 | 1,360 | 1,336 | 1,341 |
| 6,000 | 2,040 | 1,995 | 2,004 |
The fits are restricted to forces ≤10 pN. The experiments are carried out in PBS-Puffer with 137 mM NaCl concentration. The uncertainty of fits as caused by the experimental accuracy of ±0.5 pN in the force measurements and ±2 nm in the determination of the position of the colloid in the optical trap
The data can be similarly well described by the model of a semiflexible chain of Gaussian segments as suggested by Winkler [17]:
 |
2 |
The major difference between the approach by R. G. Winkler and the worm-like chain (WLC)-model is based on the fact that in the former the magnitude of the tangent vector is not exactly one but only its average value. As a consequence, the contour length is not fixed [17].
The persistence lengths which were calculated by applying these models are listed in Table 3. The persistence length ranges between 16–20 nm (±5 nm) for WLC and 21–27 nm (±4 nm) for the Winkler fit. These low values are related to the experimental conditions. The measurements were carried out in PBS-buffer with a high ionic strength (137 mM NaCl). Due to the high number of positively charged ions [Na+], the repulsion between the negatively charged groups of the phosphate backbone of the DNA is reduced, which leads to an increase in flexibility and therefore to a decrease of the persistence length.
Table 3.
Persistence length as determined from the fits with the WLC model and with Winkler’s approach
| Number of base pairs | Experimentally determined persistence length L p with WLC fit (nm) (±5) | Experimentally determined persistence length L p with Winkler fit (nm) (±4) |
|---|---|---|
| 2,000 | 20 | 27 |
| 3,000 | 16 | 21 |
| 4,000 | 20 | 27 |
| 6,000 | 19 | 26 |
The fits are restricted to forces ≤10 pN. In all cases, the sample was kept in PBS buffer having 137 mM NaCl concentration
From the WLC-fit for a 4,000-bp long DNA in 10 mM NaH2PO4/Na2HPO4 buffer pH 7 a persistence length of (Table 4) Lp=46 nm is obtained. The fit with the Winkler model leads to a value of Lp=65 nm (Fig. 7). These values are in good agreement with data published previously by Wang et al. [18]. As expected with increasing salt concentration a pronounced decrease in the persistence length is obtained [16] (Table 4).
Table 4.
NaCl concentration dependence of the persistence length of DNA with 4,000 bp as determined with the WLC model and the Winkler’s approach
| NaCl concentration (mM) | Experimentally determined persistence length L p with WLC fit (nm) (±5) | Experimentally determined persistence length L p with Winkler fit (nm) (±4) |
|---|---|---|
| 20 | 46 | 65 |
| 137 (PBS) | 29 | 40 |
| 150 | 28 | 39 |
The fits are restricted to forces ≤10 pN
Fig. 7.
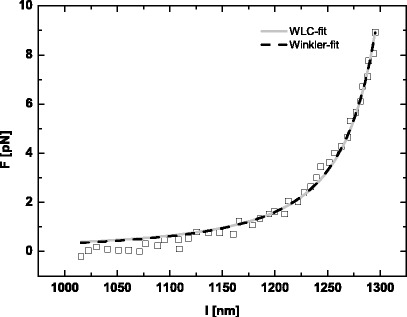
Force-extension dependence for a single ds-DNA chain of 4,000 bp. The solid line indicates a fit using the worm-like chain model while the dashed line corresponds to Winkler’s approach. The experimental uncertainly is ±0.5 pN
Compared to Wang et al. [18], the persistence length obtained in our experiments has a more pronounced dependence on the ionic strength of the surrounding media. We attribute this discrepancy to the different buffer systems used—an effect well known and discussed in the current literature [16, 18, 19].
Conclusion
For the first time measurements of the force-extension dependence of single strands of ds-DNA with systematically varying length are carried out. It is proven that the worm-like chain model, as well as the approach by R. G. Winkler, describes the data well within experimental accuracy.
Acknowledgements
This work was supported by the “Sächsisches Ministerium für Wissenschaft und Kunst”. We thank Dr. J. Liphardt, Prof. Dr. K. Kroy, Prof. Dr. H. Schiessel, and Prof. Dr. R. G. Winkler for the helpful discussions.
References
- 1.Arrhenius S. Über die Ursache der Nordlichter. Physikalische Zeitschrift. 1901;2:81–87. [Google Scholar]
- 2.Debye P. Der Lichtdruck auf Kugeln von beliebigem Material. Ann Phys. 1909;30:57–136. [Google Scholar]
- 3.Ashkin A. Acceleration and trapping of particles by radiation pressure. Phys Rev Lett. 1970;24:156–159. doi: 10.1103/PhysRevLett.24.156. [DOI] [Google Scholar]
- 4.Bennink ML, Leuba SH, Leno GH, Zlatanova J, de Grooth BG, Greve J. Unfolding individual nucleosomes by stretching single chromatin fibers with optical tweezers. Nat Struct Biol. 2001;8:606–610. doi: 10.1038/89646. [DOI] [PubMed] [Google Scholar]
- 5.Grier DG. A revolution in optical manipulation. Nature. 2003;424:810–816. doi: 10.1038/nature01935. [DOI] [PubMed] [Google Scholar]
- 6.Smith SB, Cui Y, Bustamante C. Overstretching B-DNA: the elastic response of individual double-stranded and single-stranded DNA molecules. Science. 1996;271:795–799. doi: 10.1126/science.271.5250.795. [DOI] [PubMed] [Google Scholar]
- 7.Wang MD, Schnitzer MJ, Yin H, Landick R, Gelles J, Block SM. Force and velocity measured for single molecules of RNA polymerase. Science. 1998;282:902–907. doi: 10.1126/science.282.5390.902. [DOI] [PubMed] [Google Scholar]
- 8.Smith DE, Sander J, Tans SB, Smith SB, Grimes S, Anderson DL, Bustamante C. The bacteriophage phi29 portal motor can package DNA against a large internal force. Nature. 2001;413:748–752. doi: 10.1038/35099581. [DOI] [PubMed] [Google Scholar]
- 9.Crocker JC, Grier DG. Microscopic measurement of the pair interaction potential of charge-stabilized colloid. Phys Rev Lett. 1994;73:352–355. doi: 10.1103/PhysRevLett.73.352. [DOI] [PubMed] [Google Scholar]
- 10.Meiners JC, Quake SR. Direct measurement of hydrodynamic cross correlations between two particles in an external potential. Phys Rev Lett. 1999;82:2211–2214. doi: 10.1103/PhysRevLett.82.2211. [DOI] [Google Scholar]
- 11.Marko JF, Siggia ED. Stretching DNA. Macromolecules. 1995;28:8759–8770. doi: 10.1021/ma00130a008. [DOI] [Google Scholar]
- 12.Nustad K, Johansen L, Schmid R, Ugelstad J, Ellingsen T, Berge A. Covalent coupling of proteins to monodisperse particles: preparation of solid phase second antibody. Agents Actions. 1982;Suppl 9:207–212. [Google Scholar]
- 13.Quash G, Roch AM, Niveleau A, Grange J, Keolouangkhot T, Huppert J. The preparation of latex particles with covalently bound polyamines, IgG and measles agglutinins and their use in visual agglutination tests. J Immunol Methods. 1978;22:165–174. doi: 10.1016/0022-1759(78)90069-8. [DOI] [PubMed] [Google Scholar]
- 14.Siiman O, Burshteyn A, Insausti ME. Covalently bound antibody on polystyrene latex beads: formation, stability, and use in analyses of white blood cell populations. J Colloid Interface Sci. 2001;234:44–58. doi: 10.1006/jcis.2000.7279. [DOI] [PubMed] [Google Scholar]
- 15.Saenger W. Principles of nucleic acid structure. Berlin Heidelberg New York: Springer; 1988. [Google Scholar]
- 16.Baumann CG, Smith SB, Bloomfield VA, Bustamante C. Ionic effects on the elasticity of single DNA molecules. Proc Natl Acad Sci USA. 1997;94:6190–6195. doi: 10.1073/pnas.94.12.6185. [DOI] [PMC free article] [PubMed] [Google Scholar]
- 17.Winkler R. Deformation of semiflexible chains. J Chem Phys. 2003;118:2919–2928. doi: 10.1063/1.1537247. [DOI] [Google Scholar]
- 18.Wang MD, Yin H, Landick R, Gelles J, Block M. Stretching DNA with optical tweezers. Biophys J. 1997;72:1335–1346. doi: 10.1016/S0006-3495(97)78780-0. [DOI] [PMC free article] [PubMed] [Google Scholar]
- 19.Wenner JR, Williams MC, Rouzina I, Bloomfield VA. Salt Dependence of the elasticity and overstretching transition of single DNA molecules. Biophys J. 2002;82:3160–3169. doi: 10.1016/S0006-3495(02)75658-0. [DOI] [PMC free article] [PubMed] [Google Scholar]


