

Abstract
Cytochrome P450 reductase (CYPOR) undergoes a large conformational change to allow for an electron transfer to a redox partner to take place. After an internal electron transfer over its cofactors, it opens up to facilitate the interaction and electron transfer with a cytochrome P450. The open conformation appears difficult to crystallize. Therefore, a model of a human CYPOR in the open conformation was constructed to be able to investigate the stability and conformational change of this protein by means of molecular dynamics simulations. Since the role of the protein is to provide electrons to a redox partner, the interactions with cytochrome P450 2D6 (2D6) were investigated and a possible complex structure is suggested. Additionally, electron pathway calculations with a newly written program were performed to investigate which amino acids relay the electrons from the FMN cofactor of CYPOR to the HEME of 2D6. Several possible interacting amino acids in the complex, as well as a possible electron transfer pathway were identified and open the way for further investigation by site directed mutagenesis studies.
Keywords: molecular dynamics simulations, cytochrome P450 reductase, conformation changes, complex formation, protein in membrane
Introduction
Cytochrome P450 reductase (CYPOR) is a membrane anchored electron transfer protein located on the surface of the endoplasmic reticulum.1,2 The protein binds three cofactors, nicotinamide adenine dinucleotide phosphate (NADPH), flavin adenine dinucleotide (FAD), and flavin mononucleotide (FMN) needed for the electron transfer to a cytochrome oxidase. CYPOR supports the reaction of all microsomal cytochrome P450s,3 which are important for the oxidation of organic substances such as metabolic intermediates, drugs, or toxic chemicals.4 The highest concentration can be found in the liver.5 CYPOR is composed of three domains and a membrane anchor. These domains are (i) the FAD-domain (Arg457 to Ser680), named after the bound cofactor FAD, but which also binds the cofactor NADPH; (ii) the FMN domain (Ser70 to Phe234), where the cofactor FMN is bound, and (iii) the linker domain (Glu249 to Ala456) which connects the two cofactor binding domains (Fig. 1). No regulatory agent binding sites are known, but the protein may have phosphorylation sites.6 The electron transfers take place from the electron donor NADPH to the cofactor FAD, then over the flavin isoalloxazine ring of FAD to the flavin isoalloxazine of the cofactor FMN and from there to the HEME iron of the redox partner. For this to happen, the protein has to undergo a substantial conformational change. This is postulated to involve the opening of the protein through a swinging and rotational movement.4 In the closed state, the two flavin isoalloxazine rings of FAD and FMN are very close. A reported distance is 0.4 nm corresponding to the rings being in van der Waals contact.7–9 The linker domain is thought to control the orientation of the FAD and FMN towards each other. CYPOR subsequently has to open up to allow access to the FMN domain for the redox partner. Once open, the FMN domain can bind to the redox partner and transfer the electrons from the FMN to the HEME iron. The radius of gyration of CYPOR has been reported to be 2.7 nm for the closed state and 3.3 nm for the open state.3 This domain motion is thought to be the rate limiting step of the electron transfer to the redox partner.4 No structural change is thought to occur within the domains during the transition from the closed to the open state.10 The hinge region (Gly235 to Tyr248) is expected to be of particular importance for the transition from the closed to the open state and vice versa. This is a 15 amino acid region that connects the linker and the FMN domain.3,9 Pivoting around the backbone carbonyl atom of Arg246 in this region, was suggested to be essential for the movement of the domains.7 It was also reported that the binding of the NADPH as well as the redox state of the flavins influences the opening and closing mechanism.11,12 Furthermore, there are two salt bridges between the FMN and the FAD domains, Glu182 to Lys666 and Asp150 to Arg517. Interaction with the redox partner is thought to result from charge–charge interactions and hydrophobic effects13 as the FMN domain is a strong dipole,14 with a negatively charged side with several aspartic and glutamic acids.3 A few salt bridges and one hydrogen bond were suggested to play a role in the complex formation.7 Finally, the contact between CYPOR and its redox partner is thought to occur near the membrane surface,10 and it has been reported that the membrane is important in facilitating the electron transfer process.15
Figure 1.
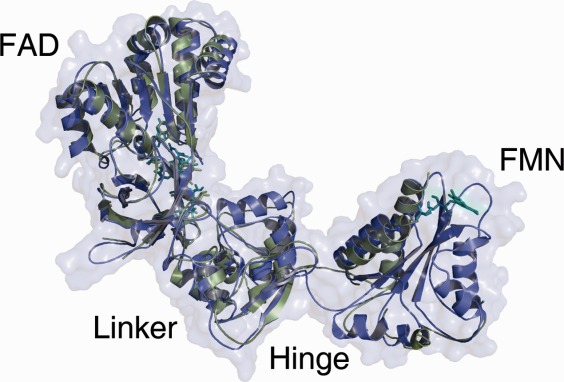
Overlay of the open model (blue) and the rat crystal structure (green) in an open conformation PDB ID: 3ES9, which served as a template. The FAD and the Linker domains are structurally very conserved. A bigger difference can be seen in the hinge region between the Linker and FMN domain. The FMN domain is not completely resolved in the rat crystal structure. [Color figure can be viewed in the online issue, which is available at http://wileyonlinelibrary.com.]
Here, the creation of a model of the open conformation of the human CYPOR and a study of the conformational change of CYPOR by means of molecular dynamics simulations is presented. Additionally a possible model for a complex between CYPOR and cytochrome P450 2D6 (2D6) is suggested. This possible complex is also studied by means of molecular dynamics simulations and several electron pathway calculations were performed.
The work described, leads to further insight into the CYPOR protein. In particular, the effects of the domain movement in terms of structural changes especially in the hinge region are investigated. Furthermore, the electron transfer mechanism and the complex formation were studied. This opens the way to further experiments to better understand these important proteins.
Results
Several molecular dynamics simulations were conducted to investigate the dynamics of CYPOR both alone and in complex with 2D6. An overview of all simulations is given in Table I.
Table I.
Overview of the Performed Molecular Dynamics Simulations
| Simulation | CYPOR conformation | P450 2D6 | DPPC | Ions | H2O | Additions | Box dimensions (nm) | Length (ns) |
|---|---|---|---|---|---|---|---|---|
| CC | Closed | No | 0 | 40 Na+ | 18504 | NADPH | x = 7.24 | 10 |
| 15 Cl− | y = 9.30 | |||||||
| z = 9.86 | ||||||||
| CN | Closed | No | 0 | 40 Na+ | 18813 | NADP+ | x = 7.31 | 2 |
| 16 Cl− | y = 9.32 | |||||||
| z = 9.87 | ||||||||
| OC | Open | No | 0 | 40 Na+ | 24157 | None | x = 7.90 | 10 |
| 15 Cl− | y = 8.68 | |||||||
| z = 12.28 | ||||||||
| OM | Open | No | 511 | 50 Na+ | 84223 | None | x = 12.68 | 2 |
| 21 Cl− | y = 12.68 | |||||||
| z = 20.00 | ||||||||
| CO | Open | Yes | 0 | 69 Na+ | 72143 | None | x = 11.58 | 10 |
| 38 Cl− | y = 13.10 | |||||||
| z = 15.78 | ||||||||
| CM | Open | Yes | 509 | 50 Na+ | 82314 | None | x = 12.68 | 10 |
| 16 Cl− | y = 12.68 | |||||||
| z = 20.00 | ||||||||
| PR | Closed/open/closed | No | 0 | 40 Na+ | 33315 | Position restraint FMN domain linearly interpolated to the open conformation | x = 8.90 | 6.2 |
| 15 Cl− | y = 10.93 | |||||||
| z = 11.48 | ||||||||
| SB | Open/closed | No | 0 | 40 Na+ | 24157 | Distance restraints between FAD FMN domain based on salt bridges | x = 7.90 | 2 |
| 15 Cl− | y = 8.68 | |||||||
| z = 12.28 | ||||||||
| HB | Open/closed | No | 0 | 40 Na+ | 24157 | Distance restraints between FAD FMN domain based on hydrogen bonds | x = 7.90 | 4 |
| 15 Cl− | y = 8.68 | |||||||
| z = 12.28 | ||||||||
| PP | Open/closed | No | 0 | 40 Na+ | 24157 | Phi/Psi angle restraints in the hinge region | x = 7.90 | 20 |
| 15 Cl− | y = 8.68 | |||||||
| z = 12.28 |
This tables shows a detailed overview of the different simulations that were performed to study the cytochrome P450 reductase (CYPOR), alone and in complex with cytochrome P450 2D6(2D6). The first column assigns a label to the simulations, CC stands for closed conformation, CN for the closed conformation with NADP+ instead of NADPH, OC for the model in an open conformation, OM for the model in an open conformation in the membrane, CO for the complex with cytochrome P450 2D6 and CM is the complex in the membrane. The abbreviations PR, SB, HB, and PP designate the simulations with positions restraints, restraints on salt bridges, restraints on hydrogen bonds and restraints on the ϕ and ψ angles, respectively. The second column shows the conformation of CYPOR followed by the presence of 2D6. Furthermore, the number of DPPC molecules, ions and water molecules in the system is indicated. Additionally, it is indicated whether any restraints were used and what the size of the simulations box was. The final column indicates the length of the simulation.
Closed conformation
The closed conformation represents the state in which the FAD domain and the FMN domain are in close contact. This conformation brings the FAD and FMN cofactors at a distance at which an electron transfer between them can occur. The structure of the closed conformation was simulated for 10 ns. The atom-positional root-mean-square deviations (RMSD) of the backbone atoms of the individual domains remained within 0.3 nm of the X-ray structure regardless of the redox state of the nicotinamide adenine dinucleotide phosphate cofactor (NADPH or NADP+) [Fig. 2(A,C)]. Furthermore, no significant domain motion took place, the protein stayed stably in its closed conformation with overall RMSD values up to 0.4 nm (Fig. 3). Also, the radius of gyration remained stable at 2.6 nm, which is close to the reported 2.7 nm for the closed conformation by Laursen et al.3 (Fig. 3).
Figure 2.
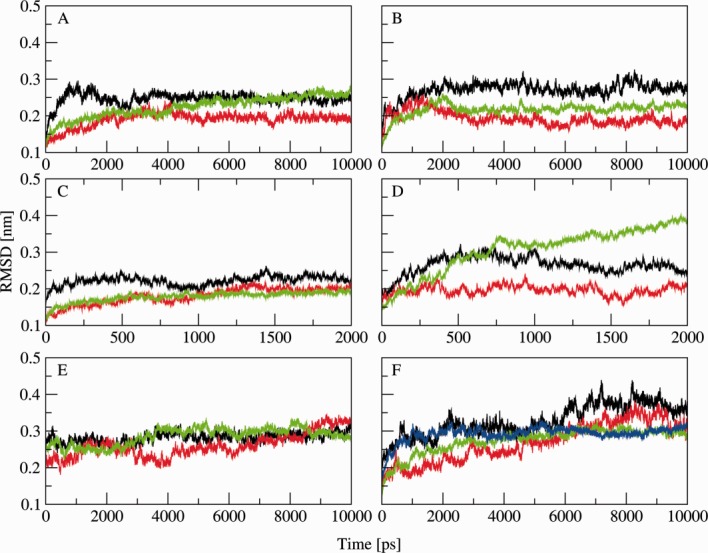
Root mean square deviation of the FAD domain (black), the linker domain (red), the FMN domain (green) and 2D6 (blue) with respect to the wild type crystal structure. Tile A represents the closed conformation, tile B the open model, tile C the closed conformation with NADP+ instead of NADPH, tile D the open model in the membrane, tile E the simulation with restraints on the ϕ and ψ angles and tile F the complex in the membrane. In all simulations, the three domains remain stable and showed no significant structural changes. [Color figure can be viewed in the online issue, which is available at http://wileyonlinelibrary.com.]
Figure 3.
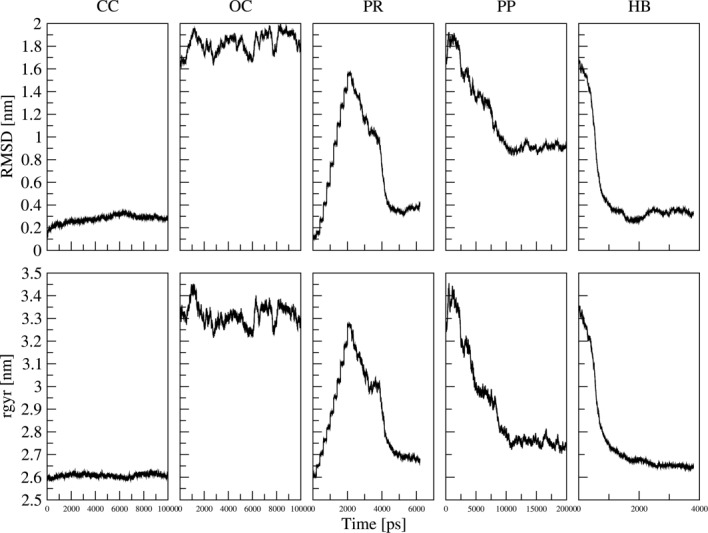
Root mean square deviation (rmsd; top) and radius of gyration (rgyr; bottom) with respect to the wild-type crystal structure in the closed conformation. The closed conformation (CC) and the open conformation (OC) should be viewed as reference points for the subsequent simulations of the domain movement. The simulation with position restraints (PR) shows a stepwise opening due to the position restraints and a spontaneous closing after the restraints were released. The simulation with restraints on the ϕ and ψ angles of R254 (PP) closed almost fully, but the RMSD shows that a different closed conformation is reached. The simulation with distance restraints on the two hydrogen bonds R517-Q90 and Q643-E182 (HB) shows almost a full closure of the protein.
Open conformation
The open conformation represents the conformation in which the protein interacts with its redox partner and an electron transfer takes place from the cofactor FMN to the HEME iron of the redox partner. The model of the human CYPOR based on the rat structure in an open conformation was used as a reference for the open conformation and simulated for 10 ns. Again the individual domains remained quite stable [Fig. 2(B)] and no large domain motion was observed during the simulation (data not shown). The radius of gyration was less stable than in the closed conformation but fluctuates around an average value of 3.3 nm which corresponds to the reported value of 3.3 nm by Laursen et al.3 (Fig. 3). Also shown in Figure 3 is the RMSD with respect to the closed crystal structure showing that the domains are indeed arranged in a significantly different way throughout the simulation.
Conformational transition
Since no spontaneous conformational changes were observed within the time scale of the simulations of the closed and open conformation, several simulation setups (PR, SB, HB, PP) were thought of to enforce the transition from one conformation to another. These setups are summarized in Table I and RMSD and radius of gyration analyses are included in Figure 3. In a first attempt, position restraints were used to gradually transform a closed conformation to an open conformation. As expected, both the radius of gyration and the RMSD increase gradually every 200 ps as the position restraints are updated to a new linear intermediate step. After 2 ns, a conformation similar to the open model is reached. After a 200 ps simulation of the final state including the restraints, the restraints were removed and the simulation was prolonged for an additional 4 ns. During this prolonged, free simulation, the protein closed again, returning almost to its initial, closed conformation. The RMSD returns to a value only 0.05 nm higher than the RMSD of the reference simulation of the closed conformation and the radius of gyration remains 0.1 nm above the reference value, agreeing perfectly with experimental estimates. The spontaneous closure of the protein could be avoided by retaining the restraints for an additional 200 ps before removing them (data not shown). This indicates that the forceful opening of the protein introduces strain into the system and that there is additional time needed for this strain to dissipate in the open conformation. The only freely movable parts of the protein were the hinge region, ranging from Gly235 to Tyr248, and the linker domain. No changes were observed in the linker domain suggesting that the hinge region may indeed play a crucial role in the opening/closing process of the protein as suggested by Laursen et al.3 The absence of the spontaneous closing after a longer simulation time of the last restraining step indicates that the hinge region could adjust to a structure favoring the open conformation of the protein. Indeed, a closer analysis of the backbone dihedral angles in the hinge region suggested that rotations around the backbone of residues 245–246 are needed to accommodate the open conformation.
To further investigate the importance of the hinge region, the ϕ and ψ dihedral angles of Arg246 were harmonically restrained (PP) to values corresponding to the closed conformation in a simulation starting from the open model. During 10 ns of simulation with dihedral angle restraints, a conformation change towards the closed state could indeed be observed. The simulation was prolonged to 20 ns and after 12 ns, a stable conformation was reached. This conformation has a radius of gyration of about 2.8 nm which is very close to the previously reported value of the closed conformation but higher than the reference simulation in the closed state (Fig. 3). The RMSD with respect to the crystal structure in the closed conformation reveals however, that the attained conformation differs significantly from the reference structure. The RMSD remains at 0.9 nm (Fig. 3) and visual inspection shows that the FMN domain turned in such a manner, that an electron transfer between the two cofactors FAD and FMN remains unlikely. This indicates that indeed changes in the hinge region influence the conformational state of CYPOR. But it cannot be stated whether the necessary change in the hinge region is the cause or an effect of the conformational transition between the open and the closed state. It has been reported that the binding of the NADPH cofactor or the redox state of the flavins could influence the conformation as well,3,16 which would suggest that the changes in the hinge region are the observed effect of a subtle influence by other factors. Recall, however that no conformational changes were observed in simulation CN, involving the different redox state of NADP+ in the closed conformation.
To enforce a more complete transition between a closed and an open conformation, distance restraints were applied on two reported salt bridges13 between the FMN domain and the FAD domain (simulation SB). Large structural distortions were observed in this simulation (data not shown). As the salt bridges were only rarely observed in the simulation of the closed state, another attempt was made by applying distance restraints between two hydrogen bonds that were observed during the simulation of the closed state and which are close to the described salt bridges (HB). This simulation led to a closed conformation with a radius of gyration of 2.7 nm, which corresponds to the reported value of 2.7 nm and a RMSD value that is similar to the one of simulation CC (Fig. 3). Similar rotations of the backbone dihedral angles of residues Ile245 and Arg246 as in simulation PR were observed. Although an almost full transition was observed, the two cofactors FMN and FAD do not approach close enough for efficient electron transfer to occur. This simulation demonstrates that only two distance restraints may be sufficient to close the open structure, even though details in the hinge region may still play a significant role in the final orientation of the domains.
Overall, the simulations described above provided significant insights into the factors affecting the conformational transition of the human CYPOR. The importance of the hinge region for the overall motion could be shown which could be addressed experimentally by expressing, for example, the I245G, I245P, R246G, or R246P mutants. Additionally, it was shown that the conformational change is rather due to an interdomain motion than to intradomain changes.
Complex formation
CYPOR provides a redox partner with the necessary electrons. To model and simulate such an interaction with a redox partner, cytochrome P450 2D6 was selected. A possible complex model was constructed, as shown in Figure 4. The complex could be stably simulated for an extended period. An overview of the interactions can be seen in Table II. During the simulation, starting from this complex (CO), CYPOR seemed to open up more than the open model suggested. This may be due to the missing membrane which could stabilize the interaction between the redox partners.
Figure 4.
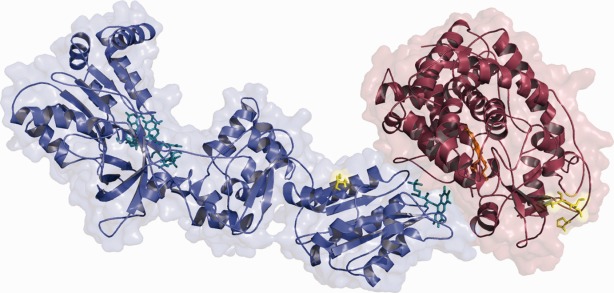
Structure of the CYPOR-2D6 complex after 10 ns. CYPOR is shown in blue and 2D6 in red. The positions of the membrane anchors and the two leucines which should be embedded in the membrane are shown in yellow. [Color figure can be viewed in the online issue, which is available at http://wileyonlinelibrary.com.]
Table II.
Interactions between the Cytochrome P450 Reductase (CYPOR) and Cytochrome P450 2D6 (2D6)
| Hydrogen bonds | Salt bridges | Energy [kJ.mol−1] | ||||||||
|---|---|---|---|---|---|---|---|---|---|---|
| Simulation | Donor | Acceptor | Occurrence (%) | Residue 1 | Residue 2 | Occurrence (%) | VDW | CRF | Total | Interface surface [Å2] |
| CO | 2D6:Y124 | CYPOR:E145 | 32.07 | CYPOR:K179 | 2D6:E431 | 18.74 | −112.98 | −620.55 | −733.53 | 351.90 |
| 2D6:R133 | CYPOR:D150 | 22.57 | CYPOR:E95 | 2D6:R140 | 36.80 | ± 4.88 | ± 38.37 | ± 40.96 | ||
| 2D6:R133 | CYPOR:Q153 | 12.39 | CYPOR:E145 | 2D6:R129 | 27.34 | |||||
| 2D6:R140 | CYPOR:T91 | 20.76 | CYPOR:D147 | 2D6:R129 | 70.80 | |||||
| 2D6:R440 | CYPOR:T180 | 63.30 | CYPOR:D150 | 2D6:R133 | 70.57 | |||||
| CYPOR:E182 | 2D6:R440 | 32.87 | ||||||||
| CYPOR:D212 | 2D6:R88 | 50.54 | ||||||||
| CYPOR:D212 | 2D6:K429 | 30.17 | ||||||||
| CM | 2D6:K147 | CYPOR:E357 | 42.46 | CYPOR:K360 | 2D6:E346 | 30.31 | −80.81 | −893.10 | −973.90 | 238.45 |
| 2D6:S148 | CYPOR:E357 | 72.18 | CYPOR:E95 | 2D6:R140 | 80.35 | ± 3.38 | ± 74.20 | ± 75.73 | ||
| 2D6:R440 | CYPOR:T180 | 51.90 | CYPOR:D150 | 2D6:R133 | 15.06 | |||||
| CYPOR:D212 | 2D6:R88 | 94.30 | ||||||||
| CYPOR:D355 | 2D6:K147 | 32.85 | ||||||||
| CYPOR:E357 | 2D6:K146 | 50.52 | ||||||||
| CYPOR:E357 | 2D6:K147 | 20.82 | ||||||||
In both complexes, CO and CM, more salt bridge interactions than hydrogen bond interactions could be observed. The calculated interaction energies (VDW: van der Waals and CRF: electrostatics) show that the interaction between the redox partners in the complex is mostly electrostatic. A relatively small interface surface was observed which hints at a rather loose complex, which, however, is sufficient for an electron transfer.
The complex was subsequently placed into a membrane and the missing membrane anchors were modeled (CM). A representation of the modeled complex structure before the simulation as well as the complex after 10 ns of simulation is shown in Figure 5. An overview of the interaction between CYPOR and 2D6 observed in this simulation is given in Table II. Both membrane anchors consist of several hydrophobic amino acids which are embedded in the membrane. The anchor of the CYPOR is longer than the membrane height. It can be seen that during simulation CM, the hydrophobic residues which are protruding from the membrane initially fold towards the membrane and a hook-like structure is formed. Overall, the anchor of CYPOR stays helical. The anchor of the cytochrome P450 is fully inside the membrane. It looses a bit of the helical structure further towards the protein but remains also overall helical and stable. A close up of the anchors embedded in the membrane can be seen in Figure 6. Note that also residues Leu230 and Leu231 are embedded in the hydrophobic core of the membrane which is known to be the case for 2D6.17 These residues are part of the F–G region of the enzyme which is quite flexible.18 The general orientation of the residues, however, seems conserved over many CYPs and will not affect the overall model.
Figure 5.
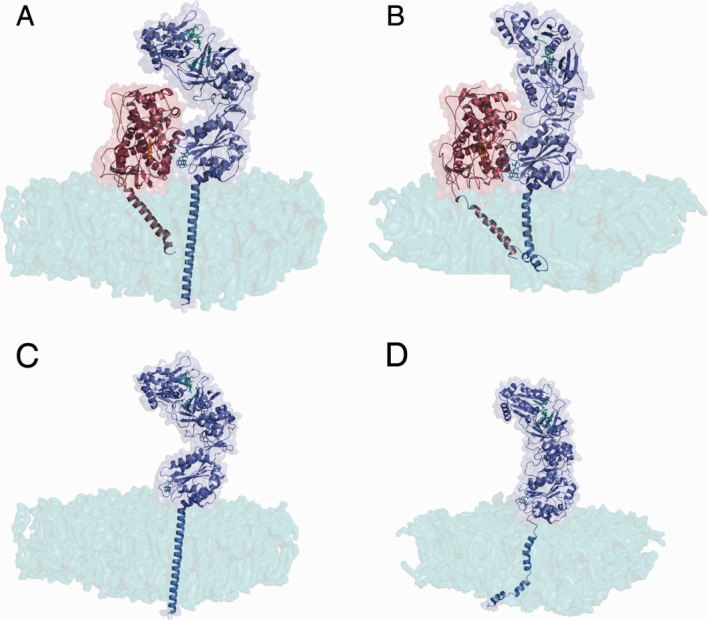
Model of a possible CYPOR–2D6 complex embedded in a DPPC membrane. The initial model is shown in panel A, while panel B depicts the structure after a 10 ns simulation. CYPOR is shown in blue and 2D6 in red. It can be seen that the anchors are well embedded in the membrane after 10 ns of simulation and that CYPOR underwent minor structural changes, but the two proteins remain in close contact. Tile C shows the initial structure of the open model in the membrane and tile D the open model in the membrane after 2 ns of simulation. It can be seen that CYPOR behaves similarly with and without 2D6 by comparing tile A with tile C and tile B with tile D. [Color figure can be viewed in the online issue, which is available at http://wileyonlinelibrary.com.]
Figure 6.
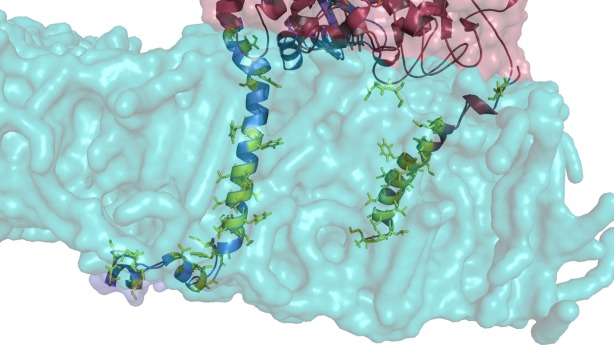
Close-up view on the modeled membrane anchors of CYPOR and 2D6 after a 10 ns simulation. CYPOR is shown in blue and 2D6 in red. Hydrophobic amino acids embedded in the membrane are shown in green. Both membrane anchors are strongly hydrophobic. The lower part of the membrane anchors of CYPOR which is outside at the bottom of the membrane folded to form a hook-like structure in contact with the membrane surface. [Color figure can be viewed in the online issue, which is available at http://wileyonlinelibrary.com.]
The simulation of CM is stable, some movement of the proteins can be observed, but the interaction between the proteins remains throughout the simulation (Table II). Indeed, CYPOR does not open up as much in the membrane simulation as it does in the simulation of the soluble form. This suggests that the membrane indeed stabilizes the interaction between the proteins. This was confirmed by placing the open model without 2D6 in a membrane. This simulation (OM) shows a similar behavior of CYPOR as in the complex simulation in the membrane (Fig. 5).
Dynamics
The three domains of CYPOR consistently remain exceptionally stable throughout the simulations. Different RMSD analyses of the individual domains are shown in Figure 2. Very little structural rearrangements take place within the domains, also when comparing the structure with NADP+ instead of NADPH as cofactor. Also in the simulation where the FMN domain is pulled towards the FAD domain (PP, HB), both domains remain internally unchanged. Only the orientation of the domains towards each other changes and an interdomain motion takes place. This confirms that the conformational change of CYPOR does not involve any intradomain conformation changes, but only a motion of complete domains. During the simulation of the complex, it was observed that CYPOR opens further. This can be seen when comparing Figures 1 and 4, the open model and the complex, respectively. The presence of the redox partner seems to induce a further opening of the protein, while again the domain RMSDs in Figure 2 remain stable. Figure 5 shows that CYPOR also opened up in simulation CM, while the linker domain moved closer to the redox partner. In this case, however, the change in conformation rather represents a slightly different open conformation. It seems that in the absence of the membrane, the FMN domain of CYPOR has more freedom to move. No significant changes occur in the structure of 2D6 in any of the complex simulations. The simulation of the open model alone in the membrane (OM) showed a very similar behavior of CYPOR as in the complex simulation in the membrane (CM). This can be seen in Figure 5, thus suggesting that the difference between CYPOR in the complex in the membrane and in solution is due to the absence of the membrane.
Interactions
To further study the complex model between CYPOR and 2D6, hydrogen bonds, salt bridges, as well as interaction energies and the interaction surface were monitored. A summary of these analyses is given in Table II. It can be seen from the energy analysis that, similar to what was reported by Hamdane et al., Xia et al., and Im et al.,7,13,19 the interaction between the two redox partners are mostly governed by electrostatic interactions. Both complexes show a favorable interaction energy. Only few hydrogen bonds with occurrences larger than 10% could be found between the two proteins. Amongst the hydrogen bond interactions, Arg140 of 2D6 was found to interact with CYPOR in CO with a moderate occurrence. Arg440 of 2D6 and Thr180 of CYPOR were found to make a hydrogen bond for more than 50% in both CO and CM. On the other hand, more salt bridges between the two redox partners could be found. Arg440 of 2D6 was seen to be part of one salt bridge interaction in CM. This residue was also reported to make an interaction with the reductase by Allorge et al.20 Other recurring salt bridge residues are Glu95, Asp150, and Asp212 for CYPOR and Arg129, Arg133, Arg140, Lys147, and Lys429 of 2D6. From the interacting residues of CYPOR reported by Hamdane et al. and Xia et al.,7,13 none could be observed. But it should be noted that the postulated models involved CYP 2B4 rather than 2D6. The interface surfaces observed here are significantly smaller than the ones reported by Hamdane et al.7. The rather small interaction surfaces suggest that the complex formed between CYPOR and its redox partner is rather loose, even though this loose complex is sufficient for an electron transfer to occur (see below). The observation of different salt bridges and a rather non-specific complex formation is in-line with the promiscuous character of CYPOR, being the reductase for a variety of different cytochromes P450. The suggested complex represents a favorable binding between the two redox partners in terms of hydrogen bond interactions, salt bridge interaction and energies. Further, CO and CM show an interaction between Thr180 of CYPOR and Arg440 of 2D6 which was reported to be important for the interaction of that specific cytochrome P450. CM is thus a plausible representation of the complex between CYPOR and 2D6.
Electron transfer pathway
In order to investigate the functionality of the protein, the GROMOS++ program “epath” was used to calculate potential electron transfer pathways. It is well known that the electron transfer occurs from the NADPH with a hydride ion transfer to the FAD and then as a two electron transfer to the FMN. This path could be reproduced with the program (Table III).
Table III.
Most Likely Electron Transfer Pathways Calculated with epath, Corresponding to an Occurrence of More Than 40%
| Simulation | Decay factor | Pathway |
|---|---|---|
| CC | 3.495e−06 | CYPOR:NADPH - CYPOR:FAD - CYPOR:FMN |
| CN | 3.099e−05 | CYPOR:NADPH - CYPOR:FAD - CYPOR:FMN |
| CO | 2.184e−06 | CYPOR:FMN - CYPOR:Y181 - 2D6:R440 - 2D6:R441 - |
| 2D6:A442 - 2D6:C443 - 2D6:HEME | ||
| CM | 2.609e−07 | CYPOR:FMN - CYPOR:Y181 - 2D6:R440 - 2D6:R441 - |
| 2D6:A442 - 2D6:C443 - 2D6:HEME |
The closed conformation (CC), in which the well known pathway over the cofactors was reproduced, represents a favorable electron pathway and decay factor. The values of both complexes, CO and CM, are comparable to the value for CC, indicating that the calculated pathways in the complexes are favorable.
The program was subsequently used to calculate possible pathways between CYPOR and 2D6. In Figure 7, a representation of the possible path in the closed conformation, as well as in the complex in the membrane can be seen. The pathways calculated for CO and CM have a decay factor that is very comparable to the one between NADPH and FMN in the closed conformation. Moreover, these paths involve residues that were previously suggested to play a role in the interaction of the two redox partners.7,20
Figure 7.
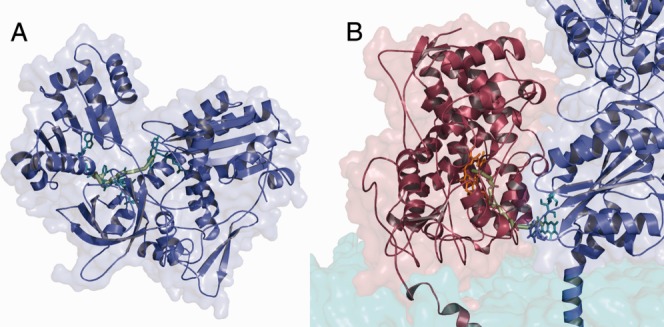
Calculated optimal electron pathway (A) in the closed conformation and (B) in the complex model. The pathway in the closed conformation goes over the cofactors. In the complex, the pathway goes from the FMN cofactor of CYPOR to the HEME of 2D6. [Color figure can be viewed in the online issue, which is available at http://wileyonlinelibrary.com.]
The pathway is the same whether the complex is in a membrane or in solution. It involves Tyr181 in CYPOR which was reported to be in a stacking conformation with respect to the cofactor. It is not unlikely that the electron transfer occurs between the two stacked rings of the Tyrosine and the isoalloxazine ring of the FMN cofactor. Furthermore, Arg440 (2D6) which is also part of the pathway calculated for CO and CM was reported to play a role in the redox partner interaction while a R440H mutation leads to a reduced activity.20 Overall, the pathway calculated for CO and CM seems to be supported by some experimental observations and suggests further investigations via site directed mutagenesis studies. For instance, the interaction between Arg440 in 2D6 and Glu182 in CYPOR could be diminished by a E182Q mutation. On the other hand, as this interaction does not seem to be very prominent, Arg440 may be focused more towards Tyr181 by introducing additional acidic moieties in the vicinity. Note that site directed mutagenesis on Tyr181 revealed that FMN binding was destabilized21 most likely due to the stacking interaction. A Y181W mutation could similarly stabilize the FMN, but potentially improve the electron transfer.
Discussion
A model for the open conformation of human cytochrome P450 reductase (CYPOR) was proposed and simulated together with various simulations characterizing the opening and closing event. Further, a model of the complex of CYPOR with cytochrome P450 2D6 (2D6) was proposed and simulated. The model of an open conformation for a human CYPOR showed to be stable during molecular dynamics simulation and fit for further studies. Based on this model, several successful simulations could be conducted to investigate the conformational transition of human CYPOR. These simulations provided further insight into this rather complex domain movement that has to occur in order to allow for the interaction with a redox partner. The data from these simulations of the conformational change emphasizes the importance of the hinge region for the domain motion. It could be shown that a change in the ϕ/ψ angles around Arg246 in this hinge region was sufficient to induce a closing of the protein. The data also suggests that a motion in the hinge region alone is not enough to achieve a correct position of the two cofactors FAD and FMN. While this may not reflect the cause of the conformation change, these simulations indicate what has to happen in the structure to facilitate a transition from a closed to an open conformation and be able to interact with the redox partner. Site directed mutations of Arg246 to, for example, Gly or Pro may prove to facilitate or inhibit the transition.
Furthermore, a possible complex of human CYPOR and human 2D6 is suggested. This complex was simulated for a longer period of time in a membrane which showed that the complex is stable in a complete system and that the interactions between the two redox partners are mainly electrostatic with a small non-specific contact surface.
The electron pathway calculations confirmed the well-known pathway within CYPOR and suggest a pathway between CYPOR and 2D6 which involves amino acids that are known to play a role in the interaction of the two proteins for complexes CO and CM.
The here suggested new insights could serve as a guide for further experiments that would verify the predictions of the molecular dynamics simulations. For instance, site directed mutagenesis studies could be conducted in order to confirm the importance of these suggested amino acids both for electron transfer as well as interaction between the two enzymes in the complex.
Materials and Methods
Closed model
All models and simulations were based on a model generated from a preliminary crystal structure of CYPOR, which was obtained from Prof. Jung-Ja Kim, Medical College of Wisconsin. The cofactor NADPH was not fully resolved in the crystal structure and the missing atoms were remodeled based on the shape of the NADPH in the crystal structure of a rat homologue (PDB ID: 3ES9). The NADPH in the force field used is in the reduced form unless stated differently.
Open model
The model of the open conformation of the human CYPOR was constructed based on the crystal structure of a rat homologue (PDB ID: 3ES9). Chain B was used as it contained the most complete data. The FAD and linker domains of the human CYPOR in a closed conformation and the FAD and linker domains of the rat CYPOR in an open conformation where aligned using the program PyMol. The FMN domain of the human CYPOR was subsequently separated by breaking the peptide bond between Phe234 and Gly235 (before the hinge region) and aligned to the resolved atoms of the corresponding domain of the rat protein. The hinge region was then manually moved and reconnected. A steepest descent energy minimization using the GROMOS molecular simulation package22 was performed for 2170 steps with the human CYPOR model in order to relax the structure. The minimized structure was used as a starting structure for simulations of the human CYPOR in an open conformation.
Cytochrome P450 2D6
As redox partner for CYPOR, cytochrome P450 2D6 (2D6)17 was used. The simulations were performed with a structure that was reverted to the wild-type sequence and which was previously shown to be stable during molecular dynamics simulations.23 The structure was compared to an alternative X-ray structure (PDB ID: 3QM4)24 in which a substrate was bound and no significant changes in the interface region of the electron transfer pathways (see below) were observed.
Complex
The complex of CYPOR and 2D6, was modeled by placing the cytochrome P450 2D6 manually in close vicinity to the FMN domain of CYPOR in the open conformation. The first approach was to construct the complex based on the homologous interactions reported by Hamdane et al.7 The reported interactions between CYPOR and CYP2B4 were inferred for CYP2D6 based on a sequence alignment of 2B4 and 2D6. The second approach involved the same interface region on the 2D6 but the 2D6 was rotated by 180° on the FMN domain. This was suggested by a closer consideration of the membrane interactions which revealed that the complex from the first approach is unlikely due to the fact that the orientation of 2D6 is such that two residues Leu230 and Leu231 of 2D6 which are expected to be embedded in the membrane17 face towards the linker domain of CYPOR rather than towards a hypothetical membrane. In order to overcome this, the cytochrome P450 was turned in such a way to allow those amino acids to face the membrane while still maintaining a significant amount of interactions. This showed that the complex cannot be formed solely by considering interactions reported for other cytochrome P450s. The promiscuous nature of CYPOR towards many CYPs is in-line with a versatile interface that can form favorable interactions with different charged groups on the CYP.
Complex in membrane
In order to simulate the complex in the presence of a membrane, the membrane anchors of both proteins were reconstructed as ideal α-helices using PyMol. A membrane of the dimensions 12.6796 nm × 12.6796 nm consisting of 512 dipalmitoylphosphatidylcholine (DPPC) molecules was constructed by duplicating an equilibrated membrane configuration downloaded from the automated topology builder repository25 several times. The CYPOR–2D6 complex was manually inserted into the membrane and the whole structure was minimized for 2500 steps. Three clashing DPPC molecules were removed to accommodate the membrane anchors of the two proteins.
Molecular dynamics simulations
All molecular dynamics simulations were performed using the GROMOS11 molecular simulation package.22 The GROMOS force field 54A726 was used as parameter set. The simple point charge (SPC) water model27 was used to solvate the proteins in periodic rectangular simulation boxes. Additional chloride and sodium counter ions were added to obtain an overall neutral system at pH 7. All systems were slowly heated to 300 K increasing the temperature by 60 K every 20 ps and subsequently equilibrated for another 100 ps. Unless stated differently, the simulations were performed for 10 ns using a step size of 2 fs and writing out the coordinates every 0.5 ps. The temperature and pressure were kept constant at 300 K and 1 atm, respectively, by the use of weak coupling with a relaxation time of 0.1 ps for the temperature and 0.5 ps for the pressure.28. The isothermal compressibility was set to 4.575 × 10⁻⁴ (kJ.mol−1.nm−3)−1. The bond lengths were constrained to their optimal values with a relative geometric accuracy of 10−4 using the SHAKE algorithm.29 For the non-bonded interactions a molecular pairlist was generated using a twin-range cutoff30 with a short range cutoff of 0.8 nm and a long-range cutoff of 1.4 nm. A reaction-field contribution31 was added to the electrostatic interactions and forces to account for a homogeneous medium with a dielectric permittivity of 6132 outside the cutoff. A summary of all performed simulations is given in Table I.
Opening and closing
Three different approaches were taken to enforce the conformational transition. First, the protein in a closed conformation was brought into an open conformation using position restraints with a harmonic force constant of 250 kJ.mol−1.nm−2 on all atoms of the FAD domain and on the Cα atoms of the FMN domain that were resolved in the open structure of the rat homologue. Only the hinge region and the linker domain were unrestrained. The reference positions for the FMN domain were taken from the FMN domain in the closed conformation as initial step and from the FMN domain in the rat homologue as a final step. In addition, 10 linear intermediate reference positions were generated. Each intermediate step was simulated for 200 ps.
Second, dihedral angle restraints were applied on the ϕ angle of Arg246 with a value of −97°and to the ψ angle of Ile245 of 113°with a force constant of 100 kJ.mol−1.deg−2 and a deviation after which the potential energy function is linearized of 45°. This represents the arginine backbone proposed to be important for the domain motion.7
In a third approach, in order to study the closing mechanism, distance restraints with a reference distance of 0.6 nm and a harmonic force constant of 4000 kJ.mol−1.nm−2 were applied to the reported salt bridges Glu182 to Lys666 and Asp150 to Arg517 in a 2 ns simulation, starting from the modeled open conformation. A distance offset of 0.05 nm was used after which the harmonic restraining potential was linearized to avoid too strong forces at large distances. Additionally, a 4 ns simulation was performed starting from the open conformation with distance restraints on two hydrogen bonds observed in the wild-type simulation in closed conformation, Arg517 to Gln90 and Gln643 to Glu182, with a reference distance of 0.25 nm and identical settings. These distance restraints were applied in two steps. First only one (Arg517 to Gln90) was applied for 400 ps and then the second one was added for the remainder of the simulation. This was necessary because the nearest-image-distance between Gln643 and Glu182 would initially favor a further opening rather than a closing motion of the protein.
Analysis
The simulation trajectories were analyzed using the GROMOS++ software.33 The stability of the simulated proteins was assessed by monitoring atom-positional root-mean-square deviations from the initial model structures and the secondary structure according to the DSSP rules defined by Kabsch and Sander.34 The hydrogen bonds and salt bridges between the domains and proteins were calculated based on geometric criteria. A hydrogen bond was defined as a hydrogen atom connected to a donor atom with an acceptor atom within 0.25 nm and a donor–hydrogen–acceptor angle of at least 135°. A salt bridge was considered to be present if the distance between the central atoms of positively and negatively charged groups were within 0.8 nm. The interface surface between the two proteins in the complex was calculated using the solvent accessible surface area calculation tool35 of VMD.36
Electron pathway calculations
The program epath was implemented in C++ within the GROMOS++ library. The program finds electron-tunneling pathways in proteins by using Dijkstra's graph search algorithm37 to find the pathway with the highest product of the decay factors, corresponding to the most likely path. In order to do this, the program determines for every atom of the system the neighboring atoms within a user-specified cutoff and classifies their connectivity as “covalent bond,” “hydrogen bond,” or “through space.” The decay factor for the electron transfer between two atoms i and j is calculated according to:
 where
where is the distance between the atoms and different parameters A, B, and R are taken according to the classified connectivity.38 The accumulated decay factor for the neighboring atoms is calculated by multiplying the accumulated decay factor of i with
 . If the accumulated decay factor on an atom j is higher than the accumulated decay factor that was already stored from a previous cycle, it is stored. Additionally, the connectivity type and the atom i from where the electron was transferred are stored. The next cycle is started from the atom with the highest accumulated decay factor. After all atoms have been analyzed, the shortest path from any acceptor position can be back traced to the donor. The program epath can perform the analysis over all snapshots in a simulation trajectory and writes out a time series of the accumulated decay factor between donor and acceptor, as well as its logarithm and their average values. Furthermore, the paths may be written out and a pdb file containing the coordinates of all atoms that have been part of a path throughout the different frames is written out, where the temperature column contains their relative occurrence in all paths. Here, the parameters A, B, and R were set to 0.6, 0 nm−1, and 0 nm for a transition through a covalent bond, to 0.36, −17 nm−1, and 0.28 nm for a transition through a hydrogen bond and to 0.6, −17 nm−1, and 0.14 nm for a transition through space.38
Acknowledgments
Prof. Jung-Ja Kim, Medical College of Wisconsin is gratefully acknowledged for providing us with a preliminary X-ray structure of the cytochrome P450 reductase. Both Prof. Jung-Ja Kim and Michel Kranendonk are thanked for critical reading of the manuscript.
Glossary
- CYPOR
cytochrome P450 reductase
- 2D6
cytochrome P450 2D6
- NADPH
nicotinamide adenine dinucleotide phosphate
- FAD
flavin adenine dinucleotide
- FMN
flavin mononucleotide
- CC
cytochrome P450 reductase in a closed conformation
- CN
cytochrome P450 reductase in a closed conformation with NADP+ rather than NADPH
- OC
cytochrome P450 reductase in an open conformation
- OM
cytochrome P450 reductase in an open conformation embedded in a membrane
- CO
complex of cytochrome P450 reductase and cytochrome P450 2D6
- CM
complex of cytochrome P450 reductase and cytochrome P450 2D6 embedded in a membrane
- PR
opening simulation with position restraints
- SB
closing simulation with restraints on salt bridges
- HB
closing simulation with restraints on hydrogen bonds
- PP
closing simulation with restraints on the ϕ and ψ angles.
References
- 1.Phillips AH, Langdon RG. Hepatic triphosphopyridine nucleotide-cytochrome c reductase: isolation, characterization, and kinetic studies. J Biol Chem. 1962;237:2652–2660. [PubMed] [Google Scholar]
- 2.Williams CH, Kamin H. Microsomal triphosphopyridine nucleotide-cytochrome c reductase of liver. J Biol Chem. 1962;237:587–595. [PubMed] [Google Scholar]
- 3.Laursen T, Jensen K, Möller BL. Conformational changes of the NADPH-dependent Cytochrome P450 reductase in the course of electron transfer to Cytochromes P450. Biochim Biophys Acta. 2011;1814:132–138. doi: 10.1016/j.bbapap.2010.07.003. [DOI] [PubMed] [Google Scholar]
- 4.Ellis J, Gutierrez A, Barsukov IL, Huang WC, Grossmann JG, Roberts GCK. Domain motion in Cytochrome P450 reductase: conformational equilibria revealed by NMR and small-angle X-ray scattering. J Biol Chem. 2009;284:36628–36637. doi: 10.1074/jbc.M109.054304. [DOI] [PMC free article] [PubMed] [Google Scholar]
- 5.Guengerich FP. Cytochrome P450 structure, mechanism, and biochemistry. New York: Kluwer Academic/Plenum Publishers; 2005. [Google Scholar]
- 6.Blom N, Gammeltoft S, Brunak S. Sequence and structure-based prediction of eukaryotic protein phosphorylation sites. J Mol Biol. 1999;294:1351–1362. doi: 10.1006/jmbi.1999.3310. [DOI] [PubMed] [Google Scholar]
- 7.Hamdane D, Xia C, Im SC, Zhang H, Kim JJP, Waskell L. Structure and function of an NADPH-Cytochrome P450 oxidoreductase in an open conformation capable of reducing Cytochrome P450. J Biol Chem. 2009;284:11374–11384. doi: 10.1074/jbc.M807868200. [DOI] [PMC free article] [PubMed] [Google Scholar]
- 8.Xia C, Panda SP, Marohnic CC, Martásek P, Masters BS, Kim JJP. Structural basis for human NADPH-Cytochrome P450 oxidoreductase deficiency. Proc Natl Acad Sci USA. 2011;108:13486–13491. doi: 10.1073/pnas.1106632108. [DOI] [PMC free article] [PubMed] [Google Scholar]
- 9.Iyanagi T, Xia C, Kim JJP. NADPH-Cytochrome P450 oxidoreductase: prototypic member of the diflavin reductase family. Arch Biochem Biophys. 2012;528:72–89. doi: 10.1016/j.abb.2012.09.002. [DOI] [PMC free article] [PubMed] [Google Scholar]
- 10.Aigrain L, Pompon D, Moréra S, Truan G. Structure of the open conformation of a functional chimeric NADPH Cytochrome P450 reductase. EMBO Rep. 2009;10:742–747. doi: 10.1038/embor.2009.82. [DOI] [PMC free article] [PubMed] [Google Scholar]
- 11.Vincent B, Morellet N, Fatemi F, Aigrain L, Truan G, Guittet E, Lescop E. The closed and compact domain organization of the 70-kDa human Cytochrome P450 reductase in its oxidized state as revealed by NMR. J Mol Biol. 2012;420:296–309. doi: 10.1016/j.jmb.2012.03.022. [DOI] [PubMed] [Google Scholar]
- 12.Pudney CR, Khara B, Johannissen LO, Scrutton NS. Coupled motions direct electrons along human microsomal P450 chains. PLoS Biol. 2011;9:e1001222. doi: 10.1371/journal.pbio.1001222. [DOI] [PMC free article] [PubMed] [Google Scholar]
- 13.Xia C, Hamdane D, Shen AL, Choi V, Kasper CB, Pearl NM, Zhang H, Im SC, Waskell L, Kim JJP. Conformational changes of NADPH-Cytochrome P450 oxidoreductase are essential for catalysis and cofactor binding. J Biol Chem. 2011;286:16246–16260. doi: 10.1074/jbc.M111.230532. [DOI] [PMC free article] [PubMed] [Google Scholar]
- 14.Zhao Q, Modi S, Smith G, Paine M, McDonagh PD, Wolf CR, Tew D, Lian LY, Roberts GC, Driessen HP. Crystal structure of the FMN-binding domain of human Cytochrome P450 reductase at 1.93 å resolution. Protein Sci. 1999;8:298–306. doi: 10.1110/ps.8.2.298. [DOI] [PMC free article] [PubMed] [Google Scholar]
- 15.Cojocaru V, Balali-Mood K, Sansom MSP, Wade RC. Structure and dynamics of the membrane-bound Cytochrome P450 2C9. PLoS Comput Biol. 2011;7:e1002152. doi: 10.1371/journal.pcbi.1002152. [DOI] [PMC free article] [PubMed] [Google Scholar]
- 16.Aigrain L, Pompon D, Truan G. Role of the interface between the FMN and FAD domains in the control of redox potential and electronic transfer of NADPH-Cytochrome P450 reductase. Biochem J. 2011;435:197–206. doi: 10.1042/BJ20101984. [DOI] [PubMed] [Google Scholar]
- 17.Rowland P, Blaney FE, Smyth MG, Jones JJ, Leydon VR, Oxbrow AK, Lewis CJ, Tennant MG, Modi S, Eggleston DS, Chenery RJ, Bridges AM. Crystal structure of human Cytochrome P450 2D6. J Biol Chem. 2006;281:7614–7622. doi: 10.1074/jbc.M511232200. [DOI] [PubMed] [Google Scholar]
- 18.de Graaf C, Oostenbrink C, Keizers PHJ, van Vugt-Lussenburg BMA, van Waterschoot RAB, Tschirret-Guth RA, Commandeur JNM, Vermeulen NPE. Molecular modeling-guided site-directed mutagenesis of Cytochrome P450 2D6. Curr Drug Metab. 2007;8:59–77. doi: 10.2174/138920007779315062. [DOI] [PubMed] [Google Scholar]
- 19.Im SC, Waskell L. The interaction of microsomal Cytochrome P450 2B4 with its redox partners, Cytochrome P450 reductase and Cytochrome b(5) Arch Biochem Biophys. 2011;507:144–153. doi: 10.1016/j.abb.2010.10.023. [DOI] [PMC free article] [PubMed] [Google Scholar]
- 20.Allorge D, Bréant D, Harlow J, Chowdry J, Lo-Guidice JM, Chevalier D, Cauffiez C, Lhermitte M, Blaney FE, Tucker GT, Broly F, Ellis SW. Functional analysis of CYP2D6.31 variant: homology modeling suggests possible disruption of redox partner interaction by Arg440His substitution. Proteins. 2005;59:339–346. doi: 10.1002/prot.20399. [DOI] [PubMed] [Google Scholar]
- 21.Nicolo C, Flück CE, Mullis PE, Pandey AV. Restoration of mutant Cytochrome P450 reductase activity by external flavin. Mol Cell Endocrinol. 2010;321:245–252. doi: 10.1016/j.mce.2010.02.024. [DOI] [PubMed] [Google Scholar]
- 22.Schmid N, Christ CD, Christen M, Eichenberger AP, van Gunsteren WF. Architecture, implementation and parallelisation of the GROMOS software for biomolecular simulation. Comp Phys Commun. 2012;183:890–903. [Google Scholar]
- 23.Hritz J, de Ruiter A, Oostenbrink C. Impact of plasticity and flexibility on docking results for Cytochrome P450 2D6: a combined approach of molecular dynamics and ligand docking. J Med Chem. 2008;51:7469–7477. doi: 10.1021/jm801005m. [DOI] [PubMed] [Google Scholar]
- 24.Wang A, Savas U, Hsu MH, Stout CD, Johnson EF. Crystal structure of human Cytochrome P450 2D6 with prinomastat bound. J Biol Chem. 2012;287:10834–10843. doi: 10.1074/jbc.M111.307918. [DOI] [PMC free article] [PubMed] [Google Scholar]
- 25.Malde AK, Zuo L, Breeze M, Stroet M, Poger D, Nair PC, Oostenbrink C, Mark AE. An automated force field topology builder (ATB) and repository: Version 1.0. J Chem Theory Comput. 2011;7:4026–4037. doi: 10.1021/ct200196m. [DOI] [PubMed] [Google Scholar]
- 26.Schmid N, Eichenberger AP, Choutko A, Riniker S, Winger M, Mark AE, van Gunsteren WF. Definition and testing of the GROMOS force-field versions 54A7 and 54B7. Eur Biophys J. 2011;40:843–856. doi: 10.1007/s00249-011-0700-9. [DOI] [PubMed] [Google Scholar]
- 27.Berendsen HJC, Postma JPM, van Gunsteren WF, Hermans J. Interaction models for water in relation to protein hydration. Intermolecular Forces. 1981:331–342. [Google Scholar]
- 28.Berendsen HJC, Postma JPM, van Gunsteren WF, DiNola A, Haak JR. Molecular dynamics with coupling to an external bath. J Chem Phys. 1984;81:3684–3690. [Google Scholar]
- 29.Ryckaert JP, Ciccotti G, Berendsen HJC. Numerical integration of the Cartesian equations of motion of a system with constraints: molecular dynamics of n-alkanes. J Comput Phys. 1977;23:327–341. [Google Scholar]
- 30.Berendsen HJC, van Gunsteren WF, Zwinderman HRJ, Geurtsen RG. Simulations of proteins in water. Ann NY Acad Sci. 1986;482:269–286. doi: 10.1111/j.1749-6632.1986.tb20961.x. [DOI] [PubMed] [Google Scholar]
- 31.Tironi IG, Sperb R, Smith PE, van Gunsteren WF. A generalized reaction field method for molecular dynamics simulations. J Chem Phys. 1995;102:5451–5459. [Google Scholar]
- 32.Heinz TN, van Gunsteren WF, Hünenberger PH. Comparison of four methods to compute the dielectric permittivity of liquids from molecular dynamics simulations. J Chem Phys. 2001;115:1125–1136. [Google Scholar]
- 33.Eichenberger AP, Allison JR, Dolenc J, Geerke DP, Horta BAC, Meier K, Oostenbrink C, Schmid N, Steiner D, Wang D, van Gunsteren WF. GROMOS++ software for the analysis of biomolecular simulation trajectories. J Chem Theory Comput. 2011;7:3379–3390. doi: 10.1021/ct2003622. [DOI] [PubMed] [Google Scholar]
- 34.Kabsch W, Sander C. Dictionary of protein secondary structure: pattern recognition of hydrogen-bonded and geometrical features. Biopolymers. 1983;22:2577–2637. doi: 10.1002/bip.360221211. [DOI] [PubMed] [Google Scholar]
- 35.Varshney A, Brooks FP, Wright WV. Linearly scalable computation of smooth molecular surfaces. IEEE Comp Graph Appl. 1994;14:19–25. [Google Scholar]
- 36.Humphrey W, Dalke A, Schulten K. VMD – Visual Molecular Dynamics. J Mol Graph. 1996;14:33–38. doi: 10.1016/0263-7855(96)00018-5. [DOI] [PubMed] [Google Scholar]
- 37.Dijkstra EW. A note on two problems in connexion with graphs. Numer Mathem. 1959;1:269–271. [Google Scholar]
- 38.Beratan DN, Onuchic JN, Betts JN, Bowler BE, Gray HB. Electron tunneling pathways in ruthenated proteins. J Amer Chem Soc. 1990;112:7915–7921. [Google Scholar]