Abstract
Neurotransmission depends on movements of transmitter-laden synaptic vesicles, but accurate, nanometer-scale monitoring of vesicle dynamics in presynaptic terminals has remained elusive. Here, we report three-dimensional, real-time tracking of quantum dot-loaded single synaptic vesicles with an accuracy of 20 to 30 nanometers, less than a vesicle diameter. Determination of the time, position, and mode of fusion, aided by trypan blue quenching of Qdot fluorescence, revealed that vesicles starting close to their ultimate fusion sites tended to fuse earlier than those positioned farther away. The mode of fusion depended on the prior motion of vesicles, with long-dwelling vesicles preferring kiss-and-run rather than full-collapse fusion. Kiss-and-run fusion events were concentrated near the center of the synapse, whereas full-collapse fusion events were broadly spread.
Neurons communicate by releasing neurotransmitter and thus activating postsynaptic receptors. The position and movement of neurotransmitter-containing vesicles are essential for proper communication. However, vesicle dynamics during the period leading up to release remain mysterious. Uncertainty exists about the possible role of vesicle position in the determination of vesicle fusion probability (1). A controversy concerns the possible existence of two modes of fusion—full-collapse fusion (FCF) or kiss-and-run (K&R)—reported in central nervous system (CNS) neurons (2–6), but having an uncertain relation between vesicle movement and fusion location—especially in three dimensions (7). Recently, several methods have been developed to localize fluorescent molecules in three dimensions (8–10) but real-time three-dimensional (3D) localization has not been applied to synaptic vesicles in living neurons.
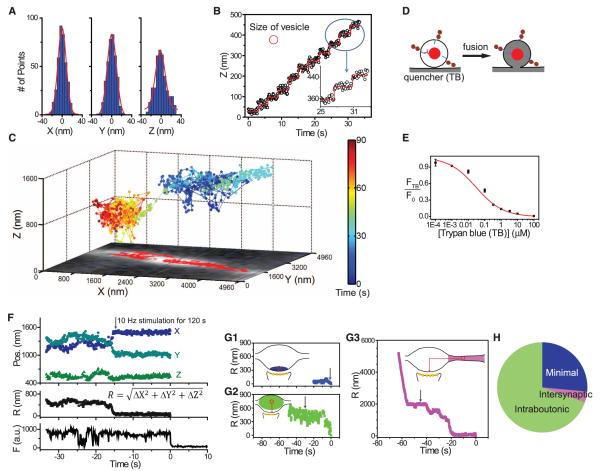
To localize single synaptic vesicles in real-time and in three dimensions, we built a microscope with dual-focus imaging optics, modified from a published design (9) (fig. S1). The accuracy of the localization (2.35 σ, corresponding to the full-width at half maximum) was ~20 nm for x- and y- and ~30 nm for z-localization (Fig. 1A) (for 10 Hz imaging, standard in this paper). Real-time capabilities were tested by imposing stepwise movements on single Qdot-containing vesicles in a fixed neuron. For z axis displacements of 40 nm (~1 vesicle diameter), the estimated z axis displacement for individual frames was 42 ± 2.7 nm (SEM) (n = 10) (Fig. 1B), an accuracy well below a single vesicle diameter.
Fig. 1.
Real-time, 3D tracking of single vesicles. (A) Immobilized Qdot (10-Hz imaging). Positional estimates had standard deviations (σ) of 8.5 nm (x), 8.5 nm (y), and 12.3 nm (z). (B) Tracking z-axial, 40-nm movements of a single Qdot in a fixed neuron. Red circle, approximate size of a vesicle. (Inset) Expanded view. (C) 3D trace of Qdot-labeled vesicle in living neuron, with x-y plane projection (red squares), overlaid on image of FM 4-64–labeled vesicles (white). Color bar, elapsed time. Stimulation (10 Hz, 120 s) started at 20 s; vesicle exocytosed at 90 s. (D) Quenching of Qdot fluorescence by TB pinpoints the moment of exocytosis. (E) Dependence of unquenched fraction (FTB/F0) on TB concentration. (F) 3D position and fluorescence of Qdot-labeled vesicle (exocytosis, t = 0). (G) Traces and representations of minimal, intraboutonic, and intersynaptic patterns of vesicle movement before exocytosis (G1 to G3, respectively). Average latencies to fusion were 40.7, 42.9, and 55.5 s, respectively. Gray arrows, initiation of 1200 APs stimulation. (H) Prevalence of three patterns of movement.
Single vesicles were efficiently labeled by use of streptavidin-coated Qdots conjugated to biotinylated antibodies against the luminal domain of the vesicular protein synaptotagmin 1. In an exemplar 3D trajectory (Fig. 1C), a single vesicle in a living neuron underwent ~12 s of intense movement, travelling almost unidirectionally with the net displacement of 3.2 μm over 90 s of imaging, with dwelling in two discrete zones, presumptive presynaptic terminals marked by distinct clouds of vesicles labeled with FM 4-64, a lipophilic probe for vesicular turnover.
Exocytosis of the Qdot-loaded vesicles was registered by a sudden drop in the fluorescence, caused by uptake of an extracellular quencher, trypan blue (TB) (6, 11) (Fig. 1D). We used 1 μM TB in most experiments, guided by the concentration dependence of TB quenching of Qdots (FTB/F0) (Fig. 1E). Neither the quencher nor loading with antibody-conjugated Qdots affected vesicle dynamics, as assessed by uptake and destaining of FM 4-64 (fig. S2).
We analyzed 3D positions over time, calculating the momentary radial distance to the eventual location of fusion . In one example (Fig. 1F), a tracked vesicle was mobile for the first 18 s of imaging but then remained stationary at the fusion site (R ≈ 0) for another 15 s before undergoing fusion (t = 0). The fluorescence trace included a blinking event (−24 s), which confirmed that the signal arose from a single Qdot, and displayed a sharp drop 14 s after the onset of field stimulation, which corresponded to complete equilibration of the vesicle lumen with the quencher-containing external solution. Similar traces were obtained from γ-aminobutyric acid (GABA)–releasing (GABAergic) terminals, by using Qdots conjugated to biotinylated antibodies against the luminal domain of vesicular GABA transporter (VGAT) (fig. S3A).
Single vesicles displayed three patterns of movement before exocytosis—intersynaptic, intraboutonic, and minimal (residing very close to the fusion site for the entire observation period). Intersynaptic movement was categorized by a net displacement of >1 μm (Fig. 1, C and G3), consistent with vesicle sharing between nearby synapses (12), and was the least prevalent [3 out of 81 (4%)] (Fig. 1H). Intraboutonic movement, defined by net displacements between 0.1 μm and 1 μm (Fig. 1G2), was the most abundant pattern [56 out of 81 (69%)], presumably because it typifies the bulk of recycling vesicles. Net movements of <0.1 μm before exocytosis (Fig. 1G1), categorized as minimal, were observed in 22 of 81 (27%) of cases.
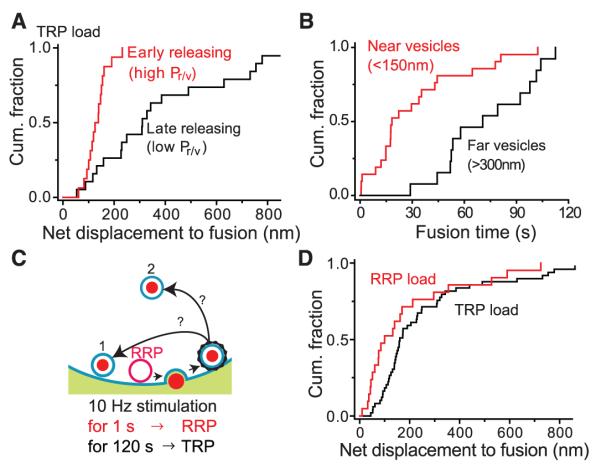
Next, we tested whether proximity to release sites is a critical determinant of vesicle-release probability (Fig. 2). This long-held assumption (1, 13) predicts that, on average, a vesicle starting off close to its ultimate release site will fuse earlier than one located further away. Accordingly, we directly determined the net 3D displacement from the starting position of vesicles to their fusion sites, information unobtainable from static electron microscopy (EM) images. The net displacement to fusion site proved to be a strong predictor of the latency to fusion (P < 0.005) (fig. S4). Vesicles with relatively high release probability (high Pr/v) were defined by a brief latency to release (<20 s after onset of stimulation), whereas vesicles with relatively low Pr/v were discerned by long latency (>50 s after onset of stimulation). The high Pr/v vesicles traveled a shorter distance to fusion sites (median, 125 nm, n = 15) than low Pr/v vesicles (median, 310 nm, n = 19) [P < 0.001, Kolmogorov–Smirnov (K-S) test] (Fig. 2A). Likewise, vesicles starting near fusion sites (<150 nm) underwent exocytosis earlier (median, 18 s; average, 31 ± 6.2 s; n = 21) than those starting further away (>300 nm) (median, 71 s; average, 73 ± 7.4 s; n = 13) (P < 0.0005, K-S test) (Fig. 2B). Thus, proximity is a key factor in determining vesicle release probability even for vesicles not already docked to their release site.
Fig. 2.
Influence of distance traveled on latency to fusion. (A) Net displacements of early-releasing vesicles and late-releasing vesicles were significantly different (P < 0.001, K-S test). (B) Vesicles located near fusion sites fused significantly earlier than those located farther away (P < 0.0005, K-S test). (C) Schematic representation of possible locations of recycled RRP vesicles after FCF and retrieval, wherein recycled RRP vesicles return to (1) positions close to the plasma membrane or (2) away from the plasma membrane. The protocols for loading RRP or TRP vesicles used 10-Hz stimulation for 1 s or 120 s. (D) Recycled RRP vesicles took up Qdots and repositioned nearer to ultimate fusion sites than recycled TRP vesicles (P < 0.05, K-S test).
To determine whether a vesicle’s pool of origin influences its eventual position after FCF and retrieval or if vesicles become randomly dispersed (Fig. 2C), we investigated the positions of the readily releasable pool (RRP) and total recycling pool (TRP) of vesicles after recycling, in experiments akin to those in previous EM studies (14, 15). Labeling of vesicles was either sharply restricted to vesicles from the RRP {10 Hz for 1 s [10 action potential (AP) stimulation]} or spread across the TRP (1200 APs). Vesicles originating from the RRP relocated at positions significantly closer to the fusion sites (median 100 nm, n = 21) (Fig. 2D) than vesicles derived from the TRP (median 160 nm, n = 49) (K-S test, P < 0.05) [see also (15)]. The observed difference in spatial distribution was remarkable, because Qdots (unlike FM dye) can only be taken up after FCF and clathrin-mediated retrieval (Fig. 2C) (5). Nevertheless, vesicles with a high probability of release in a first round of exocytosis behaved detectably differently compared with recycling vesicles as a whole, consistent with a role for molecular determinants as contributors to pool identity (14). Such determinants may apply to RRP vesicles that reside far enough from the fusion site to be strictly undocked (1, 13, 14).
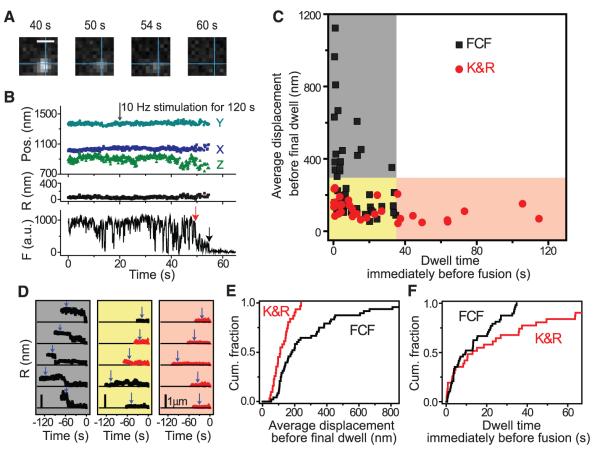
The degree of quenching of Qdot fluorescence by TB distinguished FCF and K&R. TB should completely equilibrate after FCF but only partially equilibrate during a brief fusion pore opening of K&R. Partial quenching of a single Qdot due to K&R is illustrated in Fig. 3A (see detailed analyses in SOM and fig. S5). The fluorescence trace showed a sudden, irreversible, but only partial, drop (red arrow), falling from an initial level (defined as 1.0) to a partially quenched level (FTB/F0 = 0.312), significantly larger than expected for Qdots steadily exposed to 1 μM TB [0.137 ± 0.003 (SEM), n = 3]. After a sojourn of ~5 s, the fluorescence dropped further (black arrow), to a level of virtually zero, presumably in association with Qdot movement out of the region of interest after full fusion. Similar two-step losses of fluorescence, apparently K&R and FCF events in succession, were observed with single vesicles in inhibitory nerve terminals, tracked with VGAT-antibody–conjugated Qdots (fig. S3B). We verified that partial quenching denoted K&R fusion by using a lower quencher concentration and observing a milder degree of partial quenching (fig. S6A).
Fig. 3.
Detection of K&R by partial quenching and relation of fusion mode to prior motion. (A) Images taken before fusion (40 s), after partial quenching (50 s), and before (54 s) and after full quenching (60 s). The intersection of the perpendicular lines marked the position before the first fusion. Bar, 0.8 μm. (B) 3D position and fluorescence of Qdot-loaded vesicle in (A). Red arrow, K&R; black arrow, final FCF event. (C) Relation of fusion mode to final dwell time and average displacement preceding final dwell. (D) Traces exemplifying three categorized groups. Blue arrows, stimulation initiation. Bar, 1 μm. (E) Average displacements before final dwell were significantly smaller with K&R (average, 105 ± 10.8 nm, n = 22) than with FCF (average, 278 ± 34.2 nm, n = 48) (P < 0.005, K-S test). (F) Dwell times at the final position were significantly longer with K&R (average, 30.3 ± 7.01 s) than with FCF (average, 10.7 ± 1.55 s) (P < 0.001, K-S test).
On many occasions, the Qdot-labeled vesicle remained stationary before undergoing K&R (Fig. 3B), which raised the question of whether the fusion mode is influenced by prior motion. To investigate this, we determined the final dwell time before fusion and the average displacement before that final dwell. These parameters varied between the two fusion modes (Fig. 3C; specific examples in Fig. 3D). Vesicles located close (<300 nm) to their fusion sites with dwell times longer than 35 s (pink shading) invariably underwent K&R. In contrast, vesicles that approached from a long distance (>300 nm) before the final dwell time (gray shading) consistently underwent FCF. Vesicles characterized by both a brief dwell time and previously close proximity to fusion sites showed mixed results (yellow shading). Analysis of pooled data (Fig. 3, E and F) confirmed that vesicles undergoing K&R traveled shorter distances to reach fusion sites than those undergoing FCF (P < 0.005, K-S test), whereas vesicles undergoing K&R remained stationary at fusion sites for longer than those undergoing FCF (P < 0.001, K-S test). Thus, determination of fusion mode is not a strictly stochastic decision at the time of exocytosis but is strongly dependent on the prior history of vesicle position.
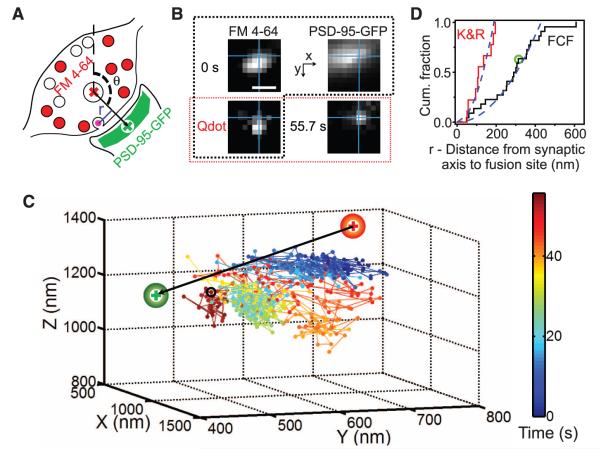
Next, we pinpointed the locus of fusion relative to pre- and postsynaptic markers (Fig. 4, A and B): FM 4-64–stained presynaptic vesicles (red) and postsynaptic density protein PSD-95 fused to green fluorescent protein (PSD-95–GFP) (green). The “synaptic axis,” defined by a vector connecting centroids of pre- and postsynaptic markers (→, Fig. 4, A and C), was presumed to pass roughly through the center of the active zone. The angle (θ, Fig. 4A) between the synaptic axis and the z axis of the microscope was 122° in Fig. 4B (average, 126 ± 3.3°, n = 31). The pre- and postsynaptic landmarks provided a spatial context for the pre-exocytosis motion of Qdot-labeled vesicles (Fig. 4C). The trajectory of an exemplar vesicle began near the center of FM 4-64 staining but ended at a site of exocytosis near the centroid labeled with PSD-95–GFP. Just before fusion by FCF (55.7 s) (black circle, Fig. 4C), the vesicle was 314 nm away from the synaptic axis (r = 314 nm). Collectively, FCF events appeared evenly distributed over a disc centered on the synaptic axis, the cumulative distribution of events increasing with the square of distance (r2) (dashed line, Fig. 4D) [coefficient of determination (R2) = 0.94; rmedian = 295 nm; n = 22]. In contrast, K&R events occurred closer to the synaptic axis (P < 0.001, K-S test), with rmedian = 109 nm, as if kept within a smaller zone (R2 = 0.87 for parabolic fit, n = 9). The confinement of K&R events near the center of the presynaptic terminal would put glutamate release by K&R in alignment with N-methyl-d-aspartate receptors (NMDARs) located close to the center of the postsynaptic density but in less direct apposition with most of the fast α-amino-3-hydroxy-5-methyl-4-isoxazolepropionic acid receptors (AMPARs), which appear dominant over NMDARs at the periphery (fig. S7) [(16, 17) but see also (18)]. Differences in alignment are important because (i) lateral spread of neurotransmitter causes rapid dilution of peak [glutamate] (19), with a lateral space constant of ~125 nm (20) and (ii) AMPARs require millimolar [glutamate] for activation (21). Thus, our findings predict that exocytosis by K&R should strongly activate NMDARs but cause uneven activation of AMPARs, whereas both receptor types should be robustly activated by FCF, as recently found [(4), see also (22)].
Fig. 4.
Relation between fusion mode and proximity to synaptic axis (r). (A) Synaptic axis (→) defined as a vector connecting centroids of FM 4-64 (+) and PSD-95–GFP (+), pre- and postsynaptic markers. r defined as orthogonal distance from fusion site to synaptic axis. (B) Images of FM 4-64, PSD-95–GFP, and Qdot in the same plane, taken initially (0 s, surrounded by dashed black line) and just before fusion (55.7 s). Images of Qdot are marked by a red-outlined rectangle. The intersection of the perpendicular lines marked the last position before fusion. Bar, 0.8 μm. (C) 3D trajectory of the vesicle in (B) relative to FM 4-64 and PSD-95–GFP centroids. Color bar, elapsed time; 10-Hz stimulation starting at 20 s. Black circle, the last position before fusion. (D) Differing cumulative distributions of r for two fusion modes. Dashed line shows parabolic fit, corresponding to uniform distribution. Circle indicates the vesicle in Fig. 4, B and C.
Our real-time 3D tracking of single synaptic vesicles in living hippocampal nerve terminals enabled direct observation of the motion of single vesicles toward their fusion sites. It also revealed unexpected relations between the trajectory of vesicles, the location of fusion, and their mode of exocytosis.
Supplementary Material
Acknowledgments
We thank Q. Zhang for discussion and for first applying Qdots to the research on vesicle release; T. Watanabe for help with building the 3D microscope; S. Syed, S.-Y. Oh, and S. Ryu for analysis programs; I. Shim for help with data analysis; A. Mitra for the construct for PSD-95–GFP; H. Martens for biotinylated antibodies against VGAT; and members of the Tsien lab for discussion. Supported by grants from National Institute of Mental Health (NIH), the Burnett Family Foundation, and Mathers Foundation.
Footnotes
Supporting Online Material www.sciencemag.org/cgi/content/full/science.1216937/DC1 Materials and Methods SOM Text Figs. S1 to S9 References (23–35)
References and Notes
- 1.Rizzoli SO, Betz WJ. Nat. Rev. Neurosci. 2005;6:57. doi: 10.1038/nrn1583. [DOI] [PubMed] [Google Scholar]
- 2.Aravanis AM, Pyle JL, Tsien RW. Nature. 2003;423:643. doi: 10.1038/nature01686. [DOI] [PubMed] [Google Scholar]
- 3.Gandhi SP, Stevens CF. Nature. 2003;423:607. doi: 10.1038/nature01677. [DOI] [PubMed] [Google Scholar]
- 4.Richards DA. J. Physiol. 2009;587:5073. doi: 10.1113/jphysiol.2009.175315. [DOI] [PMC free article] [PubMed] [Google Scholar]
- 5.Zhang Q, Li Y, Tsien RW. Science. 2009;323:1448. doi: 10.1126/science.1167373. [DOI] [PMC free article] [PubMed] [Google Scholar]
- 6.Harata NC, Choi S, Pyle JL, Aravanis AM, Tsien RW. Neuron. 2006;49:243. doi: 10.1016/j.neuron.2005.12.018. [DOI] [PubMed] [Google Scholar]
- 7.Vanden Berghe P, Klingauf J. J. Physiol. 2006;572:707. doi: 10.1113/jphysiol.2005.100842. [DOI] [PMC free article] [PubMed] [Google Scholar]
- 8.Huang B, Wang W, Bates M, Zhuang X. Science. 2008;319:810. doi: 10.1126/science.1153529. [DOI] [PMC free article] [PubMed] [Google Scholar]
- 9.Watanabe TM, Sato T, Gonda K, Higuchi H. Biochem. Biophys. Res. Commun. 2007;359:1. doi: 10.1016/j.bbrc.2007.04.168. [DOI] [PubMed] [Google Scholar]
- 10.Shtengel G, et al. Proc. Natl. Acad. Sci. U.S.A. 2009;106:3125. doi: 10.1073/pnas.0813131106. [DOI] [PMC free article] [PubMed] [Google Scholar]
- 11.Howarth M, et al. Nat. Methods. 2008;5:397. doi: 10.1038/nmeth.1206. [DOI] [PMC free article] [PubMed] [Google Scholar]
- 12.Darcy KJ, Staras K, Collinson LM, Goda Y. Nat. Neurosci. 2006;9:315. doi: 10.1038/nn1640. [DOI] [PubMed] [Google Scholar]
- 13.Denker A, Rizzoli SO. Front. Synaptic Neurosci. 2010;2:135. doi: 10.3389/fnsyn.2010.00135. [DOI] [PMC free article] [PubMed] [Google Scholar]
- 14.Rizzoli SO, Betz WJ. Science. 2004;303:2037. doi: 10.1126/science.1094682. [DOI] [PubMed] [Google Scholar]
- 15.Schikorski T, Stevens CF. Nat. Neurosci. 2001;4:391. doi: 10.1038/86042. [DOI] [PubMed] [Google Scholar]
- 16.Kharazia VN, Weinberg RJ. Neurosci. Lett. 1997;238:41. doi: 10.1016/s0304-3940(97)00846-x. [DOI] [PubMed] [Google Scholar]
- 17.Somogyi P, Tamás, Lujan R, Buhl EH. Brain Res. Brain Res. Rev. 1998;26:113. doi: 10.1016/s0165-0173(97)00061-1. [DOI] [PubMed] [Google Scholar]
- 18.Dani A, Huang B, Bergan J, Dulac C, Zhuang X. Neuron. 2010;68:843. doi: 10.1016/j.neuron.2010.11.021. [DOI] [PMC free article] [PubMed] [Google Scholar]
- 19.Uteshev VV, Pennefather PS. Biophys. J. 1997;72:1127. doi: 10.1016/S0006-3495(97)78761-7. [DOI] [PMC free article] [PubMed] [Google Scholar]
- 20.Franks KM, Stevens CF, Sejnowski TJ. J. Neurosci. 2003;23:3186. doi: 10.1523/JNEUROSCI.23-08-03186.2003. [DOI] [PMC free article] [PubMed] [Google Scholar]
- 21.Diamond JS, Jahr CE. J. Neurosci. 1997;17:4672. doi: 10.1523/JNEUROSCI.17-12-04672.1997. [DOI] [PMC free article] [PubMed] [Google Scholar]
- 22.Choi S, Klingauf J, Tsien RW. Philos. Trans. R. Soc. London B Biol. Sci. 2003;358:695. doi: 10.1098/rstb.2002.1249. [DOI] [PMC free article] [PubMed] [Google Scholar]
Associated Data
This section collects any data citations, data availability statements, or supplementary materials included in this article.


