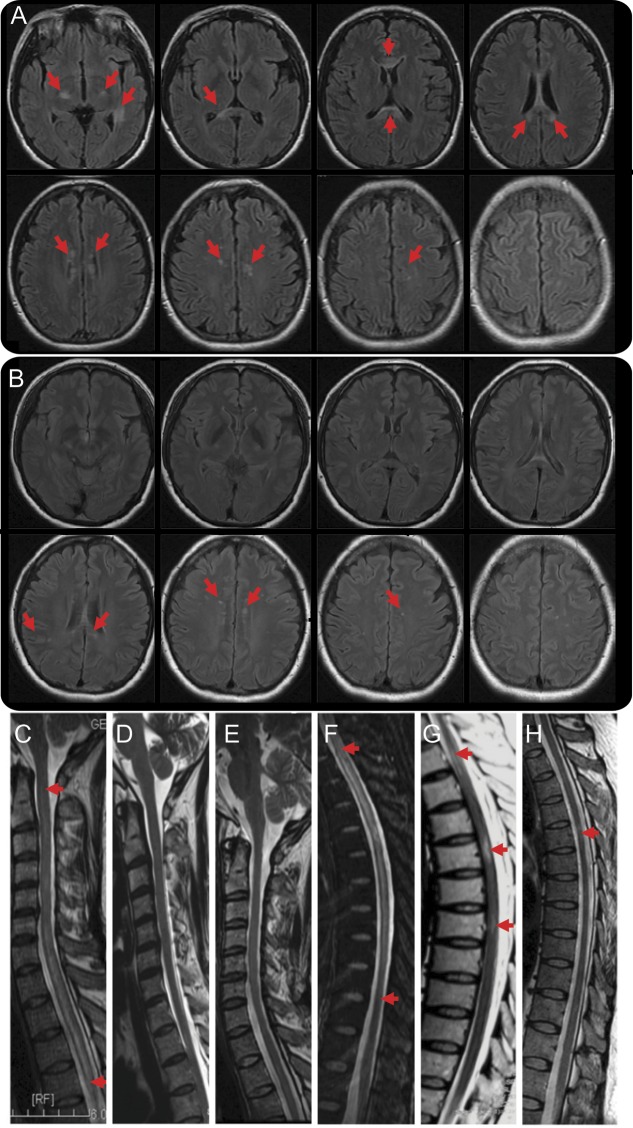
Figure 2. Brain and spinal cord MRIs of a patient treated with repeated dosages of 100 mg rituximab.
(A) Axial brain MRI scan of patient 3 illustrated multiple lesions bilaterally at bilateral basal ganglia, the thalamus, corpus callosum, and centrum ovale (arrows) on T2 fluid-attenuated inversion recovery before rituximab infusion. (B) Dramatic reduction and/or disappearance of lesions (arrows) were noted 1 year after rituximab therapy at the corresponding segments to panel A. (C–E) Sagittal T2W1 MRI of C1-T4 segments of spinal cord exhibits long segments of diffused signal enhancement before rituximab infusion (C); a gradual reduction in the extent of these lesions was observed between the sixth (D) and tenth (E) months during rituximab therapy. (F–H) No new lesions were found. Similar alterations in lesions were observed in T1-11 segments (arrows, F–H).

