

Abstract
The burgeoning field of high-throughput sequencing significantly improves our ability to understand the complexity of transcriptomes. Alternative splicing, as one of the most important driving forces for transcriptome diversity, can now be studied at an unprecedent resolution. Efficient and powerful computational and statistical methods are in urgent need to facilitate the characterization and quantification of alternative splicing events. Here we discuss methods in splice junction read mapping, and methods in exon-centric or isoform-centric quantification of alternative splicing. In addition, we discuss HITS-CLIP and splicing QTL analyses which are novel high-throughput sequencing based approaches in the dissection of splicing regulation.
Keywords: High-throughput sequencing, RNA-seq, Alternative splicing, Transcript isoform
1 Introduction
High-throughput sequencing of transcriptome (RNA-seq) has provided an unprecedent depth of understanding the complexity of transcriptome and its regulation. It has been known for a long time that transcriptomes of eukaryotes are particulary complicated by alternative splicing in which multiple transcript isoforms can be produced from a single gene [4]. RNA-seq analyses estimate that more than 90 % of human genes are alternatively spliced [36, 51]. The importance of alternative splicing is underscored by the fact that defects in alternative splicing regulation can lead to human diseases such as spinal muscular atrophy, retinitis pigmentosa, several forms of cystic fibrosis, Prader–Willi syndrome, and so on [10, 30, 39, 52]. It is crucial to characterize and quantify alternative splicing events, understand how these splicing events are regulated, and how the changes in splicing contribute to development, cell differentiation, and human disease. Here we discuss the statistical and computational methods for the analysis of alternative splicing based on high-throughput sequencing data. First, we describe methods for mapping splice junction reads, which help to catalogue the repertoire of alternative splicing events. Second, we present methods to quantify alternative splicing in exon-centric analyses or isoform-centric analyses. Third, we discuss the experimental advances of identifying the RNA binding sites of splicing regulators. Fourth, we briefly summarize the studies of quantitative trait locus mapping for splicing ratio variation (i.e. sQTL). The discussed methods are summarized in Table 1. With the ongoing improvements of high-throughput sequencing technologies, the statistical and computational methods have been and will continuously be evolving rapidly. However, the standard quality control methods are still urgently needed.
Table 1.
List of discussed methods for RNA-seq data analysis
| Method | Description | Note |
|---|---|---|
| Sequence read aligners: | ||
|
| ||
| Bowtie | Use the “Burrows–Wheeler transform” data compression algorithm | Fast and memory efficient; supports paired-end reads. |
| BWA | ||
| SOAP2 | ||
|
| ||
| Novoalign | Use the hash-based algorithm | More sensitive; supports paired-end reads. |
| Stampy | ||
| MAQ | ||
|
| ||
| De novo junction read mapping: | ||
|
| ||
| TopHat | Align reads (or split-read segments) to genome using Bowtie | Supports paired-end reads; finds “GT–AG”, “GC–AG”, and “AT–AC” splice sites for long (≥75 bp) reads and only “GT–AG” splice sites for short reads; users specify potential intron length. |
| SpliceMap | Align split-read segments to genome using Bowtie, Eland or SeqMap | Supports paired-end reads; requires the read length ≥ 50; only “GT–AG” splice sites; users specify potential intron length. |
| MapSplice | Align split-read segments to genome using Bowtie | Supports paired-end reads; incorporates anchor significance and entropy of read positions. |
|
| ||
| Alternative splicing quantification: | ||
|
| ||
| ΨSJ | Based on inclusive and exclusive reads. | |
| ΨMI SO | Exon-centric analysis | Incorporates body reads of the flanking exons; incorporates segment length information for paired-end reads; uniform assumption for positions of mapped reads; has an isoform-centric version. |
| SpliceTrap | Utilizes known gene annotation information; incorporates segment length information for paired-end reads; uniform assumption for positions of mapped reads. | |
| GPseq | No uniform assumption for positions of mapped reads; estimates the local bias directly from the data. | |
|
| ||
| rSeq | Isoform-centric analysis with reference genome sequences and gene annotations | Linear model based on known gene annotations; Poisson assumption for read counts. |
| RSEM | EM algorithm based on known gene annotations; incorporate multi-reads; uniform or specified distribution of the positions of mapped reads. | |
|
| ||
| Cufflinks | Isoform-centric analysis with reference genome sequences, but without gene annotations | Assembles read alignments into a parsimonious set of transcripts; uniform or specified distribution of positions of mapped reads. |
| Scripture | Segmentation strategy to assemble read alignments into transcripts; uniform assumption for positions of mapped reads. | |
|
| ||
| Transcriptome assembly: | ||
|
| ||
| ABySS | Parallel de Bruijn graph assembler; single k-mer value | Usually the performance is worse than the reference-genome based approaches; useful for organisms without reference genomes; a small or a large k works well for lowly or highly expressed genes. |
| SOAPdenovo | ||
| Oases | ||
|
| ||
| trans-ABySS | Multiple k-mer values | Good for all ranges of expression levels. |
| SOAPdenovo-trans | ||
| Oases-MK | ||
2 Splice Junction Read Mapping Algorithms
RNA-seq data contain two types of mappable reads (Fig. 1): (1) reads that can be mapped to a reference genome without large gaps (such as exon body reads); (2) reads that span exon–exon junctions and have to allow large gaps when mapping to the reference genome (i.e. splice junction reads). Exon body reads can be mapped by standard short sequence aligners that are based on either the “Burrows–Wheeler transform” data compression algorithm (e.g., Bowtie [23], BWA [27], SOAP2 [29]) or the “hashing” algorithm (e.g., Novoalign (Novocraft Technologies), Stampy [32], MAQ [28]). On the other hand, splice junction reads play an important role in the detection and quantification of alternative splicing events because they provide the direct evidence of exon–exon joining events. There are two common ways to map these splice junction reads. The first one is to enumerate all potential junctions and map sequence reads that cannot be mapped to the reference genome to the junction list. For example, Wang et al. [51] generated a list of all possible splice junctions between any two known or predicted exons of the same gene locus based on multiple gene annotations. The junction read mapping further required at least 4 bases on each side of the junctions for their 32-bp reads. The second approach is de novo junction read mapping. For example, TopHat [48] identifies junction reads including the ab initio ones through two steps: at the first step, TopHat calls Bowtie [23] to map all reads to the reference genome. At the second step, TopHat assembles the mapped reads into island sequences. Then TopHat enumerates all possible canonical donor and acceptor splice site pairs (GT–AG) and maps reads that cannot be mapped to the reference genome to these junctions using gapped alignment. Another popular algorithm is SpliceMap in which half-read mapping is performed for reads split in half and the mapped hits of half-reads are used as seeding for potential junctions [1]. Note that TopHat version 1.0.7 and later also splits a read of 75 bp or longer into multiple segments to assemble exons. SpliceMap requires a read length of at least 50 bp and only considers canonical “GT–AG” splice sites, because the EST (Expressed Sequence Tag) based analysis shows that more than 98 % of splice sites are canonical splice sites in mammals [6]. Wang et al. [53] developed the MapSplice algorithm which splits each read into multiple segments. Segments that cannot be mapped to the reference genome (i.e. without exon body alignments) are aligned by the double anchored spliced alignment (i.e. the two neighboring segments have exon body alignments) or the single anchored spliced alignment (i.e. only one of the two neighboring segments has an exon body alignment). Unlike TopHat and SpliceMap which utilize splice site features or intron lengths to choose potential junctions, MapSplice chooses the most likely splice junctions based on the quality and the entropy (i.e. the uniformity of positions with mapped reads) of alignments, which improves the specificity of splice junction detection and enables the identification of non-canonical junctions. In the simulated “error-free” data sets [53], about 10 % of the discovered junctions were false for TopHat (version 1.0.12). The percentage decreased to ~1 % for SpliceMap and MapSplice. However, the computation time for MapSplice was about 20~30-fold shorter than for SpliceMap (C++, version 3.0). In a recent comparison of TopHat (version 1.1.4), SpliceMap (version 3.3.5.2), and MapSplice (version 1.14.1) [14], two sets of RNA-seq data were simulated with low polymorphism (indels or SNPs) and sequencing error rates, or moderate polymorphism and error rates, respectively. MapSplice has the best performance in terms of the lowest sum of false positive and false negative rates for junction read detection. However, in these “error-prone” simulated data sets, the false positive rates for MapSplice and TopHat are comparable but MapSplice has a much smaller false negative rate (9.9 vs. 15.6 % or 19.8 vs. 25.5 %). In addition, MapSplice has the highest detection rate for novel junctions in a mouse RNA-seq data set (98 vs. 81 % for SpliceMap and 27 % for TopHat).
Fig. 1.
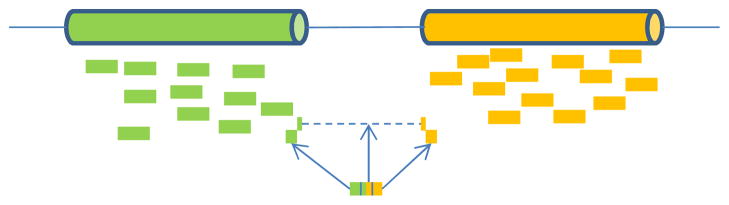
Read mapping for RNA-seq. Exon body reads can be mapped to the reference genome directly. Splice junction reads cannot be mapped to the reference genome without allowing large gaps. They are usually split into multiple segments. Segments that can be mapped to the reference genome help to locate splice junction sites
Regarding the base level alignment accuracy, MapSplice has the highest percentage of bases mapped correctly. The comparison shows that MapSplice is more powerful and robust. It also indicates the need of a benchmark RNA-seq data set or a carefully simulated data set for the comparison of different alignment algorithms. The de novo junction read mapping is still a challenging problem especially for the low abundance transcripts. With the mapped splice junction reads, different types of alternative splicing events can be characterized: such as exon skipping (or cassette exons), mutually exclusive exons, alternative 5′ donor sites, and alternative 3′ acceptor sites.
3 Alternative Splicing Quantification
To quantify alternative splicing, there are exon-centric analyses and isoform-centric analyses. For the exon-centric analyses, the inclusion ratio of each individual exon is considered. The considered exon can be included in multiple transcript isoforms and excluded in another set of isoforms. For isoform-centric analyses, every isoform abundance is quantified and compared with each other to infer the alternative splicing level. Here we first discuss the exon-centric analyses, and then the isoform-centric analyses.
3.1 Exon-Centric Analyses
The initial high-throughput exon-centric analyses are based on microarray designs. For example, Affymetrix human exon arrays contain millions of body probe sets interrogating over 1 million exons. Some microarrays include both exon body probes and junction probes [7]. Gene-level normalized exon intensity is defined as the ratio of the exon intensity to the gene intensity. The ratios under two conditions are then compared to identify differential alternative splicing events. In the analysis of RNA-seq data, more attention was paid to splice reads spanning exon–exon junctions for the quantification of exon splicing ratios.
3.1.1 Ψ Estimates
Burge’s group developed “percentage spliced in” (PSI or Ψ) estimates for the percentage of isoforms that include the considered cassette exon [20, 51]. One estimate is called ΨSJ [51], which estimates exon inclusion based on the inclusive and exclusive junction reads as well as the body reads on the cassette exon (as shown in Fig. 2A). It is denoted as
Fig. 2.
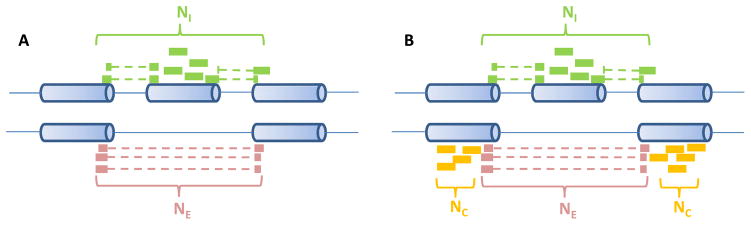
Single-end reads considered in Ψ estimates. (A) ΨSJ considers the number of reads supporting the inclusive isoform (NI ) and the number of reads supporting the exclusive isoform (NE ). (B) Besides NI and NE, ΨMI SO also considers the reads supporting both isoforms (NC )
| (1) |
where DI is the density of inclusion reads and DE is the density of exclusion reads. More formally,
| (2) |
where NI and NE are the numbers of reads supporting the inclusive and exclusive isoforms (as shown in Fig. 2A), e is the length of the cassette exon, r is the read length, and o is the overhang constraint placed on splice junctions. The underlying assumption here is that all considered positions are uniformly mappable. The ΨSJ has been applied to tissue RNA-seq data to quantify alternative splicing events [51].
A more comprehensive estimate is ΨMI SO [20]. The ΨMI SO is based on a Bayesian framework to calculate the posterior probability of annotated transcript isoforms. For exon-centric analyses, an analytic solution was obtained under the uniform prior distribution. For isoform-centric analyses, the Dirichlet-Multinomial distribution was applied. The analytic solution for the exon-centric analyses is:
| (3) |
where Ψo1 is the fraction of isoforms including the considered exon, Ψo2 is the fraction of isoforms excluding the considered exon, and:
| (4) |
| (5) |
| (6) |
| (7) |
Here, NI, NE, NC are the numbers of inclusion, exclusion, and common reads (as shown in Fig. 2B); p1 and p2 denote the probability of a read being generated from the inclusive or exclusive isoforms and where m(r, Ii ) represents the number of mappable positions in isoform Ii for an RNA-seq experiment with the read length r. Then Ψo1 and Ψo2 are further re-scaled by the effective length of isoforms to obtain ΨMI SO. Since ΨMI SO further utilizes reads aligned to the bodies of the flanking constitutive exons (NC ), it provides an improved estimate over ΨSJ. For the isoform-centric version of ΨMI SO, the paired-end information such as the fragment length can be further incorporated into the Bayesian model.
3.1.2 SpliceTrap
Wu et al. [54] also proposed a Bayesian statistics to summarize exon-inclusion rates based on paired-end RNA-seq data. The pipeline was named “SpliceTrap.” Specifically, they assembled all possible exon-skipping events, alternative 5′ or 3′ splice sites, and intron retention based on annotation databases. We should note that although intron retention was considered in SpliceTrap, it is extremely challenging to distinguish intron retention from unspliced or partially spliced transcripts due to the inefficiency of Poly(A) enrichment in RNA-seq. As shown in Fig. 3A, for each cassette exon, inclusion isoforms (f1) contain both the middle exon and the two flanking exons. Skipping isoforms (f2) contain the two flanking exons but not the middle exon. Wu et al. called it an exon trio. For each alternative splice site event (Fig. 3, B and C), f1 represents the extended isoforms and f2 represents the shortened isoforms. They called it an exon duo. Note that f1 and f2 are not full-length transcript isoforms. They only contain the considered three or two exons and they represent a family of isoforms with these three or two exons. The lengths and the relative expression levels of these isoforms are L = {L1, L2} and E = {e1, e2}. Then, the probability of observing fi given the expression level E is:
| (8) |
Fig. 3.
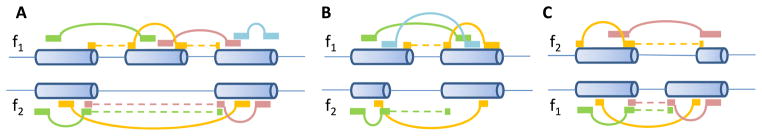
Paired-end reads mapped to alternatively spliced exons. (A) Cassette exon. (B) Alternative 5′ splice sites. (C) Alternative 3′ splice sites
For each paired-end fragment rj, the beginning position is bj and the size of the fragment (including the unknown sequence between mate pairs) is sj. Assume that the positions of the mapped fragments are uniformly distributed and bj is independent of sj; then
| (9) |
where li is the effective length of fi (li = Li − sj + 1). Then
| (10) |
Given the prior distributions P (E) and P (S), we have
| (11) |
where R are all fragments mapped to F = {f1, f2}. Then the posterior probability P (E|R) was maximized to estimate the inclusion ratio e1 for every exon. The fragment size distribution P (S) was empirically estimated from the data. The P (E) was estimated based on exon trios with high coverage and further smoothed by fitting beta distributions. SpliceTrap demonstrated improved accuracy when compared to Cufflinks and Scripture. The latter two methods are however isoform-centric analyses which reconstruct full-length transcript structures using directed graphs and assign relative expression to each transcript isoform. They will be further discussed in Sects. 3.2.3 and 3.2.4.
3.1.3 GPseq
The above methods all assume that positions are uniformly mappable. However, it is well known that RNA-seq exhibits strong spatial bias along the genome [34]. The random hexamer priming [16] or the sequence component [60] induces some of the bias, but the reasons for the non-uniformity are still largely unknown. It is usually assumed that the position-level read count follows a Poisson distribution with rate θ. The length-normalized read count, which is a popular gene expression estimate (RPKM is the measurement further divided by the total mapped reads), is then the maximum likelihood estimator (MLE) of θ. However, a Poisson distribution with rate θ cannot explain the non-uniform distribution of the reads across the same gene or the same exon. A different distribution is needed to better characterize the randomness of the sequence reads. Srivastava and Chen [45] proposed a two-parameter generalized Poisson (GP) model for the gene and exon expression estimation. A GP model with parameters θ and λ was fit to the position-level read counts across all of the positions of a gene (or an exon). The GP distribution is given by [9]:
| (12) |
where X represents the position-level read count and x is the number of sequence reads starting from that position. The estimated parameter θ reflects the transcript amount for the gene (or exon) and λ represents the sequencing bias causing the overdispersion or underdispersion in the read count variability. The two-parameter GP model fits RNA-seq data much better than the usual Poisson model. It significantly improves gene (or exon) expression estimation, and provides the foundation for downstream analysis such as normalization across different samples, identification of differently expressed genes or differentially spliced exons, and so on [45].
3.2 Isoform-Centric Analyses
3.2.1 rSeq
Besides the analyses at the individual exon level, Jiang and Wong [19] developed a method to estimate individual transcript isoform abundance from RNA-seq data. This is achieved by solving a Poisson model. Suppose a gene has m exons with lengths L = (l1, …, lm) and n transcript isoforms with expressions Θ = (θ1, …, θn). The count of reads falling into a specific region s (e.g., an exon or an exon–exon junction) is the observed data Xs. Let w be the total number of mapped reads. Then X follows a Poisson distribution with mean λ. When s is exon j, where cij is 1 if isoform i contains exon j and 0 otherwise. When s is an exon–exon junction, where l is the length of the junction region, and j and k are indices of the two exons involved in the junction. Assuming the independence among different regions, the joint log-likelihood function can be written as:
| (13) |
The isoform abundance θ’s can be obtained by the maximum likelihood estimate (MLE). When the true isoform abundance θ is not on the boundary of the parameter space, the distribution of Θ̂ can be approximated asymptotically by a normal distribution with mean Θ and covariance matrix equal to the inverse Fisher information matrix I (Θ)−1. However, in one experimental condition, many isoforms are lowly expressed and the likelihood function is truncated at θi = 0. The constraints θi = 0 for all i make the covariance matrix estimated by I (Θ)−1 unreliable. Instead, Jiang and Wong developed a Bayesian inference method based on importance sampling form of the posterior distribution of θ’s. They utilized the RefSeq mouse annotations and applied their model to an RNA-seq data set. Their results have good consistency with RT-PCR experiments (Pearson’s correlation coefficient >0.6).
3.2.2 RSEM
Besides the above linear model based method, Li et al. [26] developed an EM-algorithm-based method RSEM (RNA-Seq by Expectation-Maximization) to allocate reads to different transcript isoforms of the same gene. The improved accuracy is achieved from the assignment of multi-reads (e.g., reads mapped to multiple locations of the genome) with a statistical model. In their studies, reads with 25 bp length were simulated. However, with the increased read length, the non-uniqueness issue only affects a very small percentage of reads (e.g. 2–3 % for 100-bp reads in mice [14]). On the other hand, RSEM would be useful for organisms with significant portion of repetitive sequences (e.g., maize). In RSEM, gene expression was estimated as the sum of isoform expression levels. Bullard et al. [5] estimated gene expression through “union-intersection” genes. Specifically, the union-intersection genes are the regions consisting of the union of constitutive exons and without overlapping with other genes. The constitutive exon is defined as a set of consecutive exonic bases shared by all transcript isoforms of the gene.
3.2.3 Cufflinks
The rSeq and RSEM methods rely on the known gene annotations. Cufflinks developed by Trapnell et al. [49] aims to quantify transcript isoforms including the novel unannotated transcripts. Particularly, Cufflinks calls TopHat to do the sequence read mapping and the mapped fragments are assembled to find the minimal number of transcripts that “explain” the reads. If two sequence fragments do not overlap, or they contain the same implied introns (or none), they are compatible (Fig. 4A for single-end read design and Fig. 4C for paired-end read design). Two fragments are incompatible if they cannot be treated as originating from the same transcript (Fig. 4B for single-end read design and Fig. 4D for paired-end read design). Sometimes it may be impossible to determine the compatibility. For example, in Fig. 4E, X5 overlaps two different introns in Y5 and Y6. These uncertain reads are discarded in the transcript assembly, but included in expression quantification. The compatible fragments are ordered according to the their beginning locations to construct a partial order graph. Cufflinks then finds a minimum partition of the graph into chains that are incompatible with each other (i.e. different isoforms). Sometimes, the minimum partition is not unique. To “phase” distant exons, the read coverage is further incorporated. Thus, if the two distant exons are from the same transcript isoform, they should have similar sequence read coverage.
Fig. 4.

Compatibility and incompatibility of fragments. The boxes represent exons, the dotted lines represent implied introns, and the solid lines represent the fragments between pair mates. (A) Compatible single-end reads. (B) Incompatible single-end reads. (C) Compatible paired-end reads. (D) Incompatible paired-end reads. (E) X5 is an uncertain read because it overlaps the intron in Y5 and another different intron in Y6
The transcript abundance is estimated by a generative statistical model. For each gene locus, the effective length of a transcript is denoted as
| (14) |
where l(t) is the length of a transcript t and F (i) is the probability that the fragment is starting from i. Then the likelihood function of the non-negative isoform abundance ρt is
| (15) |
where the products are over all fragment alignments R and transcripts T, and It (r) is the implied length of a fragment determined by a pair of reads assuming that it is originating from a transcript t. Similarly to rSeq, the maximum a posteriori (MAP) estimate for ρt is identified through a Bayesian inference procedure based on importance sampling. The proposal distribution is multivariate normal, with the mean given by the maximum likelihood estimates via a numerical optimization procedure, and the variance-covariance matrix given by the inverse of the observed Fisher information matrix. The final abundances are reported in FPKM (expected fragments per kilobase of transcript per million fragments sequenced) which is a scalar multiple of ρt. Then the FPKM measurements and their associated confidence intervals are used for the differential expression analysis including the differential splicing analysis. The later version of Cufflinks further incorporates the sequencing bias through a specified weighting scheme [40].
3.2.4 Scripture
Scripture reconstructs transcriptomes using RNA-seq reads and the reference genome sequence without using the gene annotation information [15]. Sequence reads were first aligned using TopHat. Then the mapped reads including both the body reads and the junction reads as well as the reference genome were used to construct connectivity graphs. Each chromosome has a separate connectivity graph in which the nodes are bases and the edges connect each base to the immediate neighboring base either in the genome sequence or within a junction read. To further construct a transcript graph, they used a statistical segmentation strategy to traverse the graph topology and determine contiguous paths with significant mapped read enrichment over the background distribution. The background distribution was estimated through permuting the read alignments in the genome and counting the number of reads that overlap each region. Specifically, sliding windows were used to scan the connectivity graph to identify significant segments. Consecutive segments with only body reads were inferred exons. The edges of the exons were determined by the bases connecting their neighbors in the junction reads. Alternative splicing happens when a base can be connected to multiple bases. Thus, we have alternative paths on this splicing site. By enumerating all possible paths in the transcript graph, we can obtain all possible alternative spliced isoforms. To remove unlikely isoforms, paired-end reads and their distance constraints were utilized to filter out paths with little support from the paired-end reads. Scripture has been applied to discover the gene structures of more than a thousand large intergenic noncoding RNAs (lincRNA) [15].
3.3 Transcriptome Assembly
3.3.1 ABySS
For organisms without reference genomes, ABySS (Assembly By Short Sequences) provides a transcriptome assembly just based on RNA-seq reads [3]. The ABySS algorithm is based on a de Bruijn graph representation of sequence neighborhoods, where a sequence read is decomposed into tiled sub-reads of length k (k-mers) and sequences sharing k − 1 bases are connected by directed edges. After culling the false branches and removing bubbles, unambiguously linear paths along the de Bruijn graph are connected to form the assembly contigs. The uniqueness of ABySS is that the adjacency information between k-mers is stored in a manner that is independent of the actual location of the k-mer. Therefore, it allows parallel computation of the assembly algorithm across a network of computers, which makes the computation feasible. Based on ABySS, trans-ABySS specific to transcriptomes was developed [41]. A single specific value k for the substring length was used in the genome assembly, because the genome sequencing library provides a uniform representation of the genome. However, in a transcriptome library, individual transcripts may differ a lot in expression levels. A single k value cannot yield an optimal overall assembly. Therefore, a wide range of k values were used in trans-ABySS, then contigs from independent assemblies were merged into a smaller set of meta-assembly contigs for analysis. Similar tools include SOAPdenovo and its multiple k-mer version SOAPdenovo-trans [26]; Oases and Oases-MK [43]. The assembly-based methods usually perform worse in the transcript quantification. About 100× average coverage on expressed transcripts is recommended for de novo assembly [58].
4 Alternative Splicing Databases
As we mentioned above, many tools rely on the accurate and complete gene annotations. In the UCSC genome browser (http://genome.ucsc.edu/), there are multiple annotation tracks for each organism. These human-curated or computationally predicted annotations provide us useful prior information when mapping junction reads or quantifying alternative splicing. In addition, many databases specific to alternative splicing events have been built. In Table 2 we list some of the online databases for alternative splicing events.
Table 2.
Online databases for alternative splicing events
| Database | Description | Link |
|---|---|---|
| Ensemble genome alternative splicing events [46] | Human, Mouse, Zebra fish, Worm and Fruit fly | http://www.ensembl.org/ |
| H-DBAS [47] | Human | http://h-invitational.jp/h-dbas/ |
| TassDB2 [44] | Human and Mouse (only for short distance tandem splice sites) | http://www.tassdb.info |
| SpliceInfo [18] | Human | http://spliceinfo.mbc.nctu.edu.tw/ |
| ASG [25] | Human | http://statgen.ncsu.edu/asg/ |
| DEDB [24] | Fruit fly | http://proline.bic.nus.edu.sg/dedb/ |
| ASPicDB [7] | Human | http://t.caspur.it/ASPicDB/ |
| HOLLYWOOD [17] | Human and mouse | http://hollywood.mit.edu |
5 HITS-CLIP
Besides the quantification of alternative splicing, it is essential to investigate the detailed splicing regulation mechanisms. Alternative splicing regulation involves a large number of cis regulatory elements and trans-acting factors. The trans factors (i.e. splicing regulators) are usually RNA-binding proteins that bind to exons or flanking introns of pre-mRNA and subsequently affect spliceosome assembly and splice site choices. The genome-wide RNA binding locations of splicing regulators can be determined through experimental techniques based on crosslinking immunoprecipitation (CLIP) coupled with high-throughput sequencing (HITS-CLIP, Fig. 5) [31]. The original CLIP can sequence hundreds of unique protein-bound RNAs [50]. High-throughput sequencing enables the genomic scale studies of RNA binding sites. So far, only a few splicing regulators have been profiled experimentally at the genomic scale (e.g., [21, 31, 42, 55, 56]). In addition to splicing regulators, HITS-CLIP (or CLIP-seq) has also been used to survey the binding sites of other RNA-binding proteins. For example, it has been used to survey the miRNA binding sites through the HITS-CLIP on argonaute proteins [8, 61]. As an analog of the ChIP-seq design, methods developed for ChIP-seq can be readily applied to HITS-CLIP data. In the current literature, simple methods were usually applied. For example, regions with overlapping unique sequence tags were defined as clusters [31, 42]. Clusters that were highly reproducible between biological replicates and with a high peak were screened as binding sites [31, 55]. The signal-to-noise issue was addressed in the corresponding motif analysis. As discussed in [12], the signal-to-noise ratio differs for different experiments. For certain HITS-CLIP experiments, the noise was generally high. In an RNA target profiling of Fox2, only 22 % of the CLIP clusters had the binding motif UGCAUG, compared with 11 % expected by chance [56]. However, in a genome-wide study of the binding sites of Nova, the binding motif YCAY was ~5–6-fold enriched in Nova CLIP clusters [57]. The signal-to-noise ratio depends on the stringency of the biochemical conditions (e.g., purification), the specificity of the reagents (e.g. antibodies), and the bioinformatic analysis of data. More complicated statistical methods are in need to address the cluster identification.
Fig. 5.

HITS-CLIP or CLIP-seq experiment
6 sQTL Identification
The HITS-CLIP analyses map interactions between splicing regulators and target exons, which provides the cues about alternative splicing regulation. In addition, DNA variants altering splicing ratios can be mapped through the identification of splicing quantitative trait loci (sQTLs). Kwan et al. [22] investigated the alternative splicing variation among humans using exon array profiling in lymphoblastoid cell lines derived from the CEU HapMap population. Through family-based linkage studies and allelic association studies, they identified marker loci linked to particular alternative splicing events. They detected both annotated and novel alternatively spliced variants, and that such variation among individuals is heritable and genetically controlled. This analysis has been extend to RNA-seq data. For example, transcriptomes have been profiled through RNA-seq for a Caucasian population [33] and a Nigerian population [37] in the HapMap project. Both populations also have the genetic variant information available. These enabled the increased sensitivity to detect associations between DNA variants and splicing variation. Particularly, the original microarray studies along with RT-PCR validation identified dozens of genetically regulated alternative splicing events [11, 22]. Analyses of RNA-seq data increased the number to hundreds, demonstrating the prevalence of genetic regulation on splicing variation. Detailed analysis on transcript isoforms revealed that about ~60 % of the total variation in transcript isoform abundance is due to transcription variation. The remaining variability can be largely due to splicing variation [13]. With the development of high-throughput technologies, it is possible to distinguish transcriptional, co-transcriptional, or post-transcriptional variation among individuals and their corresponding DNA variants, which will ultimately help to gain the knowledge of phenotypic variation and susceptibility to complex disease.
7 Future Perspectives
The revolution in biology brought by the next generation sequencing is still ongoing. The sequencing experimental protocol itself still contains many issues that deserve special attention in data analysis. The paper of Quail et al. [38] discussed some of the issues. For example, during sequencing library preparation, a specific range of fragment sizes was selected after the fragmentation step. However, the size of selected sample only represents a small percentage of total DNA/cDNA and much of DNA vaporizes during the nebulization fragmentation procedure. During the gel extraction step, many AT-rich sequences are likely to be denatured, causing the GC bias. Benjamini and Speed [2] also reported the GC content bias at the full fragment level, not only at the sequence read level, and they hypothesized that PCR is the major source of the GC bias. For RNA-seq, contaminated unspliced or partially spliced transcripts due to the inefficiency of Poly(A) enrichment (or transcripts contain oligonucleotides similar to the Poly(A) signal) will affect the downstream analysis. For example, it leads to the falsely declaimed intron retention events and it can confound the isoform quantification. Besides the positional bias, Zheng and Chen [59] reported a significant positive correlation between the power of differential isoform identification and the transcript length (i.e. sample size in the considered statistical model). Oshlack and Wakefield [35] also observed that the power of differentially expressed gene identification is strongly associated with transcript length, which could affect the downstream pathway analysis. Statistical and computational methods for high-throughput sequencing data analysis are still in their infancy. A benchmark RNA-seq data set is in urgent need for the model comparison and validation. Currently, there is almost no way to validate the results on each individual isoform at a large scale. Quantitative reverse transcription PCR (qRT-PCR) can be designed for individual exons, but not full-length isoforms, and it may also contain its own essay-specific noise and bias. The recent NanoString nCounter gene expression system also contains outliers and displays high variance between technical replicates [40]. All these make the development of isoform-centric analysis tools challenging.
With the maturation of sequencing technology, the statistical and computational methods keep evolving. For example, read length is increasing and many of reads may span multiple junctions. Efficient methods are needed to incorporate this information to better infer transcript isoforms. In the near future, the wide application of direct sequencing of RNA or single molecular sequencing may provide us more accurate transcriptomic data. Novel and efficient statistical and computational tools will need to meet the analysis challenges and facilitate the broad application of the high-throughput sequencing technologies in a variety of biological problems.
Acknowledgments
L. Chen is supported in part by the NIH Grant R01GM097230.
References
- 1.Au K, Jiang H, Lin L, Xing Y, Wong W. Detection of splice junctions from paired-end RNA-seq data by SpliceMap. Nucleic Acids Res. 2010;38(14):4570–4578. doi: 10.1093/nar/gkq211. [DOI] [PMC free article] [PubMed] [Google Scholar]
- 2.Benjamini Y, Speed T. Summarizing and correcting the GC content bias in high-throughput sequencing. Nucleic Acids Res. 2012 doi: 10.1093/nar/gks001. Epub ahead of print. [DOI] [PMC free article] [PubMed] [Google Scholar]
- 3.Birol I, Jackman S, Nielsen C, Qian J, Varhol R, Stazyk G, Morin R, Zhao Y, Hirst M, Schein J. De novo transcriptome assembly with ABySS. Bioinformatics. 2009;25(21):2872–2877. doi: 10.1093/bioinformatics/btp367. [DOI] [PubMed] [Google Scholar]
- 4.Black D. Protein diversity from alternative splicing: A challenge for bioinformatics and post-genome biology. Cell. 2000;103(3):367–370. doi: 10.1016/s0092-8674(00)00128-8. [DOI] [PubMed] [Google Scholar]
- 5.Bullard J, Purdom E, Hansen K, Dudoit S. Evaluation of statistical methods for normalization and differential expression in mRNA-seq experiments. BMC Bioinform. 2010;11(94) doi: 10.1186/1471-2105-11-94. [DOI] [PMC free article] [PubMed] [Google Scholar]
- 6.Burset M, Seledtsov I, Solovyev V. Analysis of canonical and non-canonical splice sites in mammalian genomes. Nucleic Acids Res. 2000;28(21):4364–4375. doi: 10.1093/nar/28.21.4364. [DOI] [PMC free article] [PubMed] [Google Scholar]
- 7.Castle J, Zhang C, Shah J, Kulkarni A, Kalsotra A, Cooper T, Johnson J. Expression of 24,426 human alternative splicing events and predicted cis regulation in 48 tissues and cell lines. Nat Genet. 2008;40(12):1416–1425. doi: 10.1038/ng.264. [DOI] [PMC free article] [PubMed] [Google Scholar]
- 8.Chi S, Zang J, Mele A, Darnell R. Argonaute HITS-CLIP decodes microRNA-mRNA interaction maps. Nature. 2009;460(7254):479–486. doi: 10.1038/nature08170. [DOI] [PMC free article] [PubMed] [Google Scholar]
- 9.Consul P, Jain G. Generalization of Poisson distribution. Technometrics. 1973;15(4):791–799. [Google Scholar]
- 10.Cooper T, Wan L, Dreyfuss G. RNA and disease. Cell. 2009;136(4):777–793. doi: 10.1016/j.cell.2009.02.011. [DOI] [PMC free article] [PubMed] [Google Scholar]
- 11.Coulombe-Huntington J, Lam K, Dias C, Majewski J. Fine-scale variation and genetic determinants of alternative splicing across individuals. PLoS Genet. 2009;5(12):e1000766. doi: 10.1371/journal.pgen.1000766. [DOI] [PMC free article] [PubMed] [Google Scholar]
- 12.Darnell R. HITS-CLIP: Panoramic views of protein-RNA regulation in living cells. Wiley Interdiscip Rev RNA. 2010;1(2):266–286. doi: 10.1002/wrna.31. [DOI] [PMC free article] [PubMed] [Google Scholar]
- 13.Gonzalez-Porta M, Calvo M, Sammeth M, Guigo R. Estimation of alternative splicing variability in human populations. Genome Res. 2011 doi: 10.1101/gr.121947.111. page Epub ahead of print. [DOI] [PMC free article] [PubMed] [Google Scholar]
- 14.Grant G, Farkas M, Pizarro A, Lahens N, Schug J, Brunk B, Stoeckert C, Hogenesch J, Pierce E. Comparative analysis of RNA-seq alignment algorithms and the RNA-seq unified mapper (RUM) Bioinformatics. 2011;27(18):2518–2528. doi: 10.1093/bioinformatics/btr427. [DOI] [PMC free article] [PubMed] [Google Scholar]
- 15.Guttman M, Garber M, Levin J, Donaghey J, Robinson J, Adiconis X, Fan L, Koziol M, Gnirke A, Nusbaum C. Ab initio reconstruction of cell type-specific transcriptomes in mouse reveals the conserved multi-exonic structure of lincRNAs. Nat Biotechnol. 2010;28(5):503–510. doi: 10.1038/nbt.1633. [DOI] [PMC free article] [PubMed] [Google Scholar]
- 16.Hansen K, Brenner S, Dudoit S. Biases in illumina transcriptome sequencing caused by random hexamer priming. Nucleic Acids Res. 2010;38(12):e131. doi: 10.1093/nar/gkq224. [DOI] [PMC free article] [PubMed] [Google Scholar]
- 17.Holste D, Huo G, Tung V, Burge C. Hollywood: A comparative relational database of alternative splicing. Nucleic Acids Res. 2006;34:D56–62. doi: 10.1093/nar/gkj048. [DOI] [PMC free article] [PubMed] [Google Scholar]
- 18.Huang H, Horng J, Lin F, Chang Y, Huang C. SpliceInfo: An information repository for mRNA alternative splicing in human genome. Nucleic Acids Res. 2005;33:D80–85. doi: 10.1093/nar/gki129. [DOI] [PMC free article] [PubMed] [Google Scholar]
- 19.Jiang H, Wong W. Statistical inferences for isoform expression in RNA-seq. Bioinformatics. 2009;25(8):1026–1032. doi: 10.1093/bioinformatics/btp113. [DOI] [PMC free article] [PubMed] [Google Scholar]
- 20.Katz Y, Wang E, Airoldi E, Burge C. Analysis and design of RNA sequencing experiments for identifying isoform regulation. Nat Methods. 2010;7(12):1009–1015. doi: 10.1038/nmeth.1528. [DOI] [PMC free article] [PubMed] [Google Scholar]
- 21.Konig J, Zarnack K, Rot G, Curk T, Kayikci M, Zupan B, Turner D, Luscombe N, Ule J. iClip reveals the function of hnRNP particles in splicing at individual nucleotide resolution. Nat Struct Mol Biol. 2010;17(7):909–915. doi: 10.1038/nsmb.1838. [DOI] [PMC free article] [PubMed] [Google Scholar]
- 22.Kwan T, Benovoy D, Dias C, Gurd S, Serre D, Zuzan H, Clark T, Schweitzer A, Staples M, Wang H. Heritability of alternative splicing in the human genome. Genome Res. 2007;17(8):1210–1218. doi: 10.1101/gr.6281007. [DOI] [PMC free article] [PubMed] [Google Scholar]
- 23.Langmead B, Trapnell C, Pop M, Salzberg S. Ultrafast and memory-efficient alignment of short DNA sequences to the human genome. Genome Biol. 2009;10(3):R25. doi: 10.1186/gb-2009-10-3-r25. [DOI] [PMC free article] [PubMed] [Google Scholar]
- 24.Lee B, Tan T, Ranganathan S. DEDB: A database of Drosophila melanogaster exons in splicing graph form. BMC Bioinform. 2004;5:189. doi: 10.1186/1471-2105-5-189. [DOI] [PMC free article] [PubMed] [Google Scholar]
- 25.Leipzig J, Pevzner P, Heber S. The alternative splicing gallery (ASG): Bridging the gap between genome and transcriptome. Nucleic Acids Res. 2004;32(13):3977–3983. doi: 10.1093/nar/gkh731. [DOI] [PMC free article] [PubMed] [Google Scholar]
- 26.Li B, Ruotti V, Stewart R, Thomson J, Dewey C. RNA-seq gene expression estimation with read mapping uncertainty. Bioinformatics. 2010;26(4):493–500. doi: 10.1093/bioinformatics/btp692. [DOI] [PMC free article] [PubMed] [Google Scholar]
- 27.Li H, Durbin R. Fast and accurate short read alignment with Burrows–Wheeler transform. Bioinformatics. 2009;25(14):1754–1760. doi: 10.1093/bioinformatics/btp324. [DOI] [PMC free article] [PubMed] [Google Scholar]
- 28.Li H, Ruan J, Durbin R. Mapping short DNA sequencing reads and calling variants using mapping quality scores. Genome Res. 2008;18(11):1851–1858. doi: 10.1101/gr.078212.108. [DOI] [PMC free article] [PubMed] [Google Scholar]
- 29.Li R, Yu C, Li Y, Lam T, Yiu S, Kristiansen K, Wang J. SOAP2: An improved ultrafast tool for short read alignment. Bioinformatics. 2009;25(15):1966–1967. doi: 10.1093/bioinformatics/btp336. [DOI] [PubMed] [Google Scholar]
- 30.Licatalosi D, Darnell R. Splicing regulation in neurologic disease. Neuron. 2006;52(1):93–101. doi: 10.1016/j.neuron.2006.09.017. [DOI] [PubMed] [Google Scholar]
- 31.Licatalosi D, Mele A, Fak J, Ule J, Kayikci M, Chi S, Clark T, Schweitzer A, Blume J, Wang X. HITS-CLIP yields genome-wide insights into brain alternative RNA processing. Nature. 2008;456(7221):464–469. doi: 10.1038/nature07488. [DOI] [PMC free article] [PubMed] [Google Scholar]
- 32.Lunter G, Goodson M. Stampy: A statistical algorithm for sensitive and fast mapping of illumina sequence reads. Genome Res. 2011;21(6):936–939. doi: 10.1101/gr.111120.110. [DOI] [PMC free article] [PubMed] [Google Scholar]
- 33.Montgomery S, Sammeth M, Gutierrez-Arcelus M, Lach R, Ingle C, Nisbett J, Guigo R, Dermitzakis E. Transcriptome genetics using second generation sequencing in a Caucasian population. Nature. 2010;464(7289):773–777. doi: 10.1038/nature08903. [DOI] [PMC free article] [PubMed] [Google Scholar]
- 34.Mortazavi A, Williams B, McCue K, Schaeffer L, Wold B. Mapping and quantifying mammalian transcriptomes by RNA-seq. Nat Methods. 2008;5(7):621–628. doi: 10.1038/nmeth.1226. [DOI] [PubMed] [Google Scholar]
- 35.Oshlack A, Wakefield M. Transcript length bias in RNA-seq data confounds systems biology. Biol Direct. 2009;4:14. doi: 10.1186/1745-6150-4-14. [DOI] [PMC free article] [PubMed] [Google Scholar]
- 36.Pan Q, Shai O, Lee L, Frey B, Blencowe B. Deep surveying of alternative splicing complexity in the human transcriptome by high-throughput sequencing. Nat Genet. 2008;40(12):1413–1415. doi: 10.1038/ng.259. [DOI] [PubMed] [Google Scholar]
- 37.Pickrell J, Marioni J, Pai A, Degner J, Engelhardt B, Nkadori E, Veyrieras J, Stephens M, Gilad Y, Pritchard J. Understanding mechanisms underlying human gene expression variation with RNA sequencing. Nature. 2010;464(7289):768–772. doi: 10.1038/nature08872. [DOI] [PMC free article] [PubMed] [Google Scholar]
- 38.Quail M, Kozarewa I, Smith F, Scally A, Stephens P, Durbin R, Swerdlow H, Turner D. A large genome center’s improvements to the illumina sequencing system. Nat Methods. 2008;5(12):1005–1010. doi: 10.1038/nmeth.1270. [DOI] [PMC free article] [PubMed] [Google Scholar]
- 39.Raponi M, Baralle D. Alternative splicing: Good and bad effects of translationally silent substitutions. FEBS J. 2010;277(4):836–840. doi: 10.1111/j.1742-4658.2009.07519.x. [DOI] [PubMed] [Google Scholar]
- 40.Roberts A, Trapnell C, Donaghey J, Rinn J, Pachter L. Improving RNA-seq expression estimates by correcting for fragment bias. Genome Biol. 2011;12(3):R22. doi: 10.1186/gb-2011-12-3-r22. [DOI] [PMC free article] [PubMed] [Google Scholar]
- 41.Robertson G, Schein J, Chiu R, Corbett R, Field M, Jackman S, Mungall K, Lee S, Okada H, Qian J. De novo assembly and analysis of RNA-seq data. Nat Methods. 2010;7(11):909–912. doi: 10.1038/nmeth.1517. [DOI] [PubMed] [Google Scholar]
- 42.Sanford J, Wang X, Mort M, Vanduyn N, Cooper D, Mooney S, Edenberg H, Liu Y. Splicing factor SFRS1 recognizes a functionally diverse landscape of RNA transcripts. Genome Res. 2009;19(3):381–394. doi: 10.1101/gr.082503.108. [DOI] [PMC free article] [PubMed] [Google Scholar]
- 43.Schulz M, Zerbino D, Vingron M, Birney E. Oases: Robust de novo RNA-seq assembly across the dynamic range of expression levels. Bioinformatics. 2012 doi: 10.1093/bioinformatics/bts094. Epub ahead of print. [DOI] [PMC free article] [PubMed] [Google Scholar]
- 44.Sinha R, Lenser T, Jahn N, Gausmann U, Friedel S, Szafranski K, Huse K, Rosenstiel P, Hampe J, Schuster S, Hiller M, Backofen R, Platzer M. TassDB2—A comprehensive database of subtle alternative splicing events. BMC Bioinform. 2010;11:216. doi: 10.1186/1471-2105-11-216. [DOI] [PMC free article] [PubMed] [Google Scholar]
- 45.Srivastava S, Chen L. A two-parameter generalized Poisson model to improve the analysis of RNA-seq data. Nucleic Acids Res. 2010;38(17):e170. doi: 10.1093/nar/gkq670. [DOI] [PMC free article] [PubMed] [Google Scholar]
- 46.Stamm S, Riethoven J, Le Texier V, Gopalakrishnan C, Kumanduri V, Tang Y, Barbosa-Morais N, Thanaraj T. ASD: A bioinformatics resource on alternative splicing. Nucleic Acids Res. 2006;34:D46–55. doi: 10.1093/nar/gkj031. [DOI] [PMC free article] [PubMed] [Google Scholar]
- 47.Takeda J, Suzuki Y, Sakate R, Sato Y, Gojobori T, Imanishi T, Sugano S. H-DBAS: Human-transcriptome database for alternative splicing: update 2010. Nucleic Acids Res. 2010;38:D86–90. doi: 10.1093/nar/gkp984. [DOI] [PMC free article] [PubMed] [Google Scholar]
- 48.Trapnell C, Pachter L, Salzberg S. TopHat: Discovering splice junctions with RNA-seq. Bioinformatics. 2009;25(9):1105–1111. doi: 10.1093/bioinformatics/btp120. [DOI] [PMC free article] [PubMed] [Google Scholar]
- 49.Trapnell C, Williams B, Pertea G, Mortazavi A, Kwan G, van Baren MJ, Salzberg S, Wold B, Pachter L. Transcript assembly and quantification by RNA-seq reveals unannotated transcripts and isoform switching during cell differentiation. Nat Biotechnol. 2010;28(5):511–515. doi: 10.1038/nbt.1621. [DOI] [PMC free article] [PubMed] [Google Scholar]
- 50.Ule J, Jensen K, Ruggiu M, Mele A, Ule A, Darnell R. Clip identifies nova-regulated RNA networks in the brain. Science. 2003;302(5648):1212–1215. doi: 10.1126/science.1090095. [DOI] [PubMed] [Google Scholar]
- 51.Wang E, Sandberg R, Luo S, Khrebtukova I, Zhang L, Mayr C, Kingsmore S, Schroth G, Burge C. Alternative isoform regulation in human tissue transcriptomes. Nature. 2008;456(7221):470–476. doi: 10.1038/nature07509. [DOI] [PMC free article] [PubMed] [Google Scholar]
- 52.Wang G, Cooper T. Splicing in disease: Disruption of the splicing code and the decoding machinery. Nat Rev Genet. 2007;8(10):749–761. doi: 10.1038/nrg2164. [DOI] [PubMed] [Google Scholar]
- 53.Wang K, Singh D, Zeng Z, Coleman S, Huang Y, Savich G, He X, Mieczkowski P, Grimm S, Perou C. MapSplice: Accurate mapping of RNA-seq reads for splice junction discovery. Nucleic Acids Res. 2010;38(18):e178. doi: 10.1093/nar/gkq622. [DOI] [PMC free article] [PubMed] [Google Scholar]
- 54.Wu J, Akerman M, Sun S, McCombie W, Krainer A, Zhang M. SpliceTrap: A method to quantify alternative splicing under single cellular conditions. Bioinformatics. 2011;27(21):3010–3016. doi: 10.1093/bioinformatics/btr508. [DOI] [PMC free article] [PubMed] [Google Scholar]
- 55.Xue Y, Zhou Y, Wu T, Zhu T, Ji X, Kwon Y, Zhang C, Yeo G, Black D, Sun H. Genome-wide analysis of PTB-RNA interactions reveals a strategy used by the general splicing repressor to modulate exon inclusion or skipping. Mol Cell. 2009;36(6):996–1006. doi: 10.1016/j.molcel.2009.12.003. [DOI] [PMC free article] [PubMed] [Google Scholar]
- 56.Yeo G, Coufal N, Liang T, Peng G, Fu X, Gage F. An RNA code for the FOX2 splicing regulator revealed by mapping RNA-protein interactions in stem cells. Nat Struct Mol Biol. 2009;16(2):130–137. doi: 10.1038/nsmb.1545. [DOI] [PMC free article] [PubMed] [Google Scholar]
- 57.Zhang C, Frias M, Mele A, Ruggiu M, Eom T, Marney C, Wang H, Licatalosi D, Fak J, Darnell R. Integrative modeling defines the nova splicing-regulatory network and its combinatorial controls. Science. 2010;329(5990):439–443. doi: 10.1126/science.1191150. [DOI] [PMC free article] [PubMed] [Google Scholar]
- 58.Zhao Q, Wang Y, Kong Y, Luo D, Li X, Hao P. Optimizing de novo transcriptome assembly from short-read RNA-seq data: A comparative study. BMC Bioinform. 2011;12(Suppl 14):S2. doi: 10.1186/1471-2105-12-S14-S2. [DOI] [PMC free article] [PubMed] [Google Scholar]
- 59.Zheng S, Chen L. A hierarchical bayesian model for comparing transcriptomes at the individual transcript isoform level. Nucleic Acids Res. 2009;37(10):e75. doi: 10.1093/nar/gkp282. [DOI] [PMC free article] [PubMed] [Google Scholar]
- 60.Zheng W, Chung L, Zhao H. Bias detection and correction in RNA-sequencing data. BMC Bioinform. 2011;12:290. doi: 10.1186/1471-2105-12-290. [DOI] [PMC free article] [PubMed] [Google Scholar]
- 61.Zisoulis D, Lovci M, Wilbert M, Hutt K, Liang T, Pasquinelli A, Yeo G. Comprehensive discovery of endogenous argonaute binding sites in Caenorhabditis elegans. Nat Struct Mol Biol. 2010;17(2):173–179. doi: 10.1038/nsmb.1745. [DOI] [PMC free article] [PubMed] [Google Scholar]