

Abstract
Objective:
This study estimates current and projects future neurologist supply and demand under alternative scenarios nationally and by state from 2012 through 2025.
Methods:
A microsimulation supply model simulates likely career choices of individual neurologists, taking into account the number of new neurologists trained each year and changing demographics of the neurology workforce. A microsimulation demand model simulates utilization of neurology services for each individual in a representative sample of the population in each state and for the United States as a whole. Demand projections reflect increased prevalence of neurologic conditions associated with population growth and aging, and expanded coverage under health care reform.
Results:
The estimated active supply of 16,366 neurologists in 2012 is projected to increase to 18,060 by 2025. Long wait times for patients to see a neurologist, difficulty hiring new neurologists, and large numbers of neurologists who do not accept new Medicaid patients are consistent with a current national shortfall of neurologists. Demand for neurologists is projected to increase from ∼18,180 in 2012 (11% shortfall) to 21,440 by 2025 (19% shortfall). This includes an increased demand of 520 full-time equivalent neurologists starting in 2014 from expanded medical insurance coverage associated with the Patient Protection and Affordable Care Act.
Conclusions:
In the absence of efforts to increase the number of neurology professionals and retain the existing workforce, current national and geographic shortfalls of neurologists are likely to worsen, exacerbating long wait times and reducing access to care for Medicaid beneficiaries. Current geographic differences in adequacy of supply likely will persist into the future.
Neurologists provide care to many of the nation's most vulnerable populations, but indicators point to inadequate patient access to care. The average wait in 2012 for new patients to see a neurologist (34.8 business days) and for follow-up visits (30.0 days) was higher than in 2010 (28.1 days for new and 25.6 for follow-up visits).1,2 Other studies report average wait for new patient visits of 24.1 days for neurosurgery, 20.3 for family practice, 16.8 for orthopedic surgery, and 15.5 for cardiology.3,4 In 2012, 39% of children's hospitals reported vacancies of 12 months or longer for child neurologists, and child neurology ranked as one of the most short-handed specialties, with average wait times of 45 business days.5
While excessive wait times and difficulty recruiting suggest insufficient capacity to provide neurology services, there is substantial uncertainty regarding the future. Rising prevalence of neurologic conditions associated with an aging population, expanded medical coverage under the Patient Protection and Affordable Care Act (PPACA), and the nation's growing reliance on nonphysician clinicians to provide primary care (many of whom have limited training in neurology) will likely increase demand for neurologists.
This study forecasts neurologist supply and demand through 2025 nationally and by state. Key supply and demand trends are taken into account, with scenarios modeled that consider the implications of neurologist work patterns and number of new neurologists trained.
METHODS
The microsimulation approach used to model neurologist supply and demand differs from approaches used historically, including the approach used in a 1998 neurologist workforce study.6 We provide a brief overview of the data and methods; appendix e-1 on the Neurology® Web site at www.neurology.org provides greater detail.
Modeling supply.
The approach simulates career choices of neurologists from training through retirement or mortality. Future year projections start with current supply and simulate retirement probability, new graduates, and patient care hours worked. The cycle repeats to simulate subsequent year's supply.
To develop a representative sample of neurologists in each state, we combined information from the 2012 American Academy of Neurology (AAN) database of neurologists, 2008 AAN Member Census File, and 2012 American Medical Association (AMA) Masterfile. The process produces an estimate of 16,366 child and adult neurologists (including residents and fellows, and physicians active in non–patient care activities such as teaching and research) practicing in 2012. This is a relative overestimation of the number of neurologists in practice as residents and fellows require supervision during patient encounters, and academic neurologists and some fellowship-trained neurologists pursue teaching and research and see patients part time.
The 2012 National Residency Match Program (NRMP) data suggest approximately 729 neurologists enter training annually, including 114 child neurology positions.7 NRMP data report that international students represent roughly 40% of filled resident positions. Our analysis of AMA data for 2010–2011 suggests approximately 14% of neurology residents have a visa status that might require leaving the United States after training. The average training length of residency is assumed to be 4 years, with 2.8% attrition probability assumed for residents during training.8 The age distribution of new residents comes from the AAN's database of neurologists. The computer simulation creates a synthetic population of new graduates each year with each new resident assigned an age, sex (56% male), and child/adult specialty that reflects distributions seen in recent years. The 2011 AAN Resident Survey indicates that 86% of neurology residents plan to enter fellowships following completion of their residency and reports that the majority of fellowships last a year or two.9
Retirement patterns for neurologists were estimated using age at retirement for 168 neurologists (ranging from age 54 to 88 years) whose status recently changed to Senior in the AAN's membership files. These patterns were consistent with retirement rates for general internists who participated in a 2006 survey conducted by the Association of American Medical Colleges.10 Retirement rates are combined with mortality rates from the Centers for Disease Control and Prevention (CDC) to estimate overall attrition, taking into account that mortality rates through age 65 for professional occupations are approximately 25% lower than national rates for men and 15% lower for women.11,12 Overall attrition rates suggest that for every 1,000 neurologists entering the workforce, 787 will remain active past age 60, 285 past age 65, and 16 past age 75.
In 2010, neurologists averaged 57.1 professional hours per week, with 42.3 hours in patient care activities. These numbers changed little over the previous decade.13 To account for changing demographics of the neurologist workforce, we calculated average patient care hours by age and sex using data from the AAN 2010 Practice Profile Survey merged with the 2008 AAN Census. Women tend to work about 14% fewer hours in direct patient care compared to men of similar age.
Future supply is projected under alternative scenarios:
The baseline scenario assumes current patterns of retirement and hours worked remain unchanged, 729 new neurologists enter the workforce annually, and the demographics of newly trained neurologists remain unchanged from the current distribution.
High and low graduate scenarios model the implications of a 10% increase (high scenario) and a 10% decrease (low scenario) in new neurologists trained annually.
Delayed or earlier retirement scenarios reflect retiring 2 years later or earlier (relative to current patterns).
Modeling demand.
Demand projections consider demographic, socioeconomic, and health risk factors for a representative sample of the population in each state for 2010 and projected through 2025. Each person's characteristics are used to forecast his or her use of neurology services by care delivery setting (office, outpatient, emergency, and inpatient). The model then applies neurologist productivity estimates to calculate clinical full-time equivalents (FTEs) required to meet demand for services.
The population database.
Population characteristics come from the United States Census Bureau's 2010 American Community Survey (ACS) and population projections, the CDC's 2009 and 2010 Behavioral Risk Factor Surveillance System (BRFSS), and the CDC's 2004 National Nursing Home Survey (NNHS).14–18 The population database starts with the approximately 3 million individuals in the ACS, for which we have socioeconomic and demographic data. Health data from the approximately 1,029,000 people in the combined 2009 and 2010 BRFSS files (which covers the noninstitutionalized population) are randomly matched to the noninstitutionalized population in the ACS in the same state, age group, sex, race/ethnicity, income level, and insurance status. Health data from the NNHS are matched to the elderly, institutionalized population in the ACS by age group, sex, and race/ethnicity. The resulting database has over 3 million records and contains demographics (age, sex, race, and Hispanic ethnicity); metro/nonmetropolitan resident; household income; medical insurance type (private, public, self-pay); weight status (unknown, normal, overweight, obese); smoker/nonsmoker status; and diagnosed history of 9 general medical conditions (arthritis, asthma, cardiovascular disease, diabetes, hypertension, depression, heart attack, cancer, and stroke).
With data for approximately 169,000 participants in the combined 2005–2009 files of the Medical Expenditure Panel Survey (MEPS), we used logistic regression to estimate the relationship between patient characteristics and presence of select neurologic conditions: Alzheimer disease, attention-deficit/hyperactivity disorder, cerebral degeneration, epilepsy, extrapyramidal disease not elsewhere classified, mental retardation, migraine, mononeuritis of limb, multiple sclerosis, Parkinson disease, and sleep disorders.19 These predictive equations were applied to the population database to estimate the probability that each person has the above conditions. Many patient conditions treated by neurologists (e.g., cerebral palsy) are unavailable in the population database. Health care utilization patterns associated with these omitted conditions are captured in the underlying rates of using neurologist services and vary by patient demographics and the other variables that may be correlated with the presence of these conditions (e.g., Medicaid status).
The predictive equations for health care.
Health care seeking behavior is generated from equations using data from the combined 2005–2009 files of the MEPS. Poisson regression quantifies the relationship between patient characteristics and annual number of office visits and annual outpatient visits to a neurologist. Logistic regression is used to calculate the annual probability of an emergency visit and annual probability of hospitalization for neurology-related conditions. Unlike office and outpatient visits, where MEPS specifically identifies the medical professional seen, emergency visits and hospitalizations have no information on medical professionals who provided services. For these settings, we identify neurology visits based on primary ICD–9 diagnosis codes of 320.xx–359.xx (Diseases of the Nervous System). Separate regressions were estimated for adults and children for each care delivery setting. Explanatory variables include patient demographic and health characteristics described previously.
Neurologist workload and care delivery.
Estimates of provider time per encounter convert estimates of demand for services into demand for clinical FTEs. Productivity data come from multiple sources:
The 2010 AAN Practice Profile Survey (n = 910) reports 72.9% of professional time goes to patient care, 9.7% to administrative responsibilities, 9.1% to research, 5.2% to teaching, and 3% to other activities.20 Average patient encounters per week by neurologists are 17.4 new patient and 34.2 follow-up ambulatory visits; 8.9 new patient and 14.2 follow-up inpatient consults; and 3.8 new patient and 8.5 follow-up inpatient attending encounters.
The AAN's 2011 Survey of Neurohospitalists (n = 189) reports that each week the average neurohospitalist has 12.6 new patient and 27.7 follow-up attending evaluations, and 18.0 new patient and 30.2 follow-up consulting evaluations.21
The Medical Group Management Association's (MGMA) 2010 Physician Compensation and Production Survey reports that adult neurologists in group practices average 2,205 ambulatory encounters annually (n = 383 neurologists in 118 practices).22 MGMA also reports an annual average 515 hospital encounters. Child neurologists average 1,851 ambulatory encounters per year (n = 38 neurologists in 19 practices) and 380 hospital encounters per year (n = 29 neurologists in 16 practices).
Combined with information on the average work relative value unit for new patient and follow-up visits in office/outpatient (2.43 for new patient visit level 4 and 0.93 for established patient visit level 3) and hospital settings (2.61 for initial hospital care level 2 and 1.39 for subsequent care) and after model calibration (to account for fewer patient visits among academic neurologists), we calculate that each 2,860 ambulatory visits equates to approximately one clinical FTE, and each 1,580 hospital consults equates to approximately one clinical FTE, representing about 42.3 hours of patient care activity each week. We assume that the proportion of neurologist time spent in patient care remains constant over time.
Defining and estimating current demand.
Demand for neurologists is derived from patient demand for services, which is determined in part by patients' willingness and ability to pay for services given patient needs and cost of services. Provider demand is influenced by care delivery patterns. For example, to the extent that primary care providers refer patients to a neurologist rather than try to provide the care themselves, there will be an increased demand for neurologists. Likewise, greater use of advanced practice providers in neurology practices allows neurologists to focus on areas of greatest patient need, thus reducing the overall number of neurologists required to provide care to a given population. There are no established criteria for quantifying demand for physician time; therefore, determining whether there are too many, too few, or about the right number of providers is somewhat subjective.
Nevertheless, for this study demand does not equal “need,” where need is based on a clinical definition taking into account patient epidemiologic considerations combined with assessment of how care could best be provided to the patient. Likewise, demand for neurology services does not necessarily equate to use of services, especially in geographic areas with reduced access to neurologists because of supply constraints.
Anecdotal evidence from neurologists we interviewed as part of this study consistently indicated difficulty hiring neurologists or nurse practitioners with training in neurology. While no estimate of the magnitude of a current national shortfall exists, demand appears to exceed supply as indicated by excessive wait times to see a neurologist, difficulty hiring neurologists, and number of practices no longer accepting new Medicaid beneficiaries.1–5 That is, we would require more neurologists to reduce the waiting times to see a neurologist to 1–2 weeks from the present wait of 1 month.
Current national demand for neurologists is difficult to estimate directly, but mathematically demand equals current supply plus (minus) any current shortage (surplus). Current supply can be estimated for 2012. Indicators that a shortfall exists are evident (e.g., abnormally long wait times for appointments) but the magnitude of the shortfall is unknown. If one assumed that national supply and demand were in equilibrium in 2012 (i.e., no shortfall), then comparison of current supply to estimated case-mix adjusted demand in each state would suggest that in 12 states supply exceeds demand, in 3 states (Michigan, Ohio, and Florida) supply and demand are in equilibrium, and in 35 states supply is below demand. Approximately 62% of the nation's population lives in a state where supply is below that required to provide the current national average pattern of care.16 To bring neurologist supply in these 35 states up to a level sufficient to provide the level of care afforded to the population in Michigan, Ohio, and Florida would take an additional 1,634 neurologists (or approximately 10% more neurologists than current supply). However, even among the 12 states where supply exceeds the level needed to provide the current national average level of care, there are indications of challenges hiring new neurologists. Massachusetts has double the ratio of neurologists per population as the national average, and a 2010 Physician Workforce Study sponsored by the Massachusetts Medical Society indicates the state has a severe shortage of neurologists.23 Any such shortage in a state with the highest number of neurologists per capita might be explained by the large number of neurologists at nationally recognized academic medical centers in Massachusetts who draw patients from throughout the region. Still, the findings for Massachusetts reiterate that current national supply is insufficient to meet demand. The above findings suggest the nation could readily use an additional 10% adult neurologists, and based on average wait time the current shortfall of child neurologists is substantially greater. For modeling purposes, we assume a 10% shortfall of adult neurologists and a 20% shortfall of child neurologists.
RESULTS
The forecasting equations for health care use (see appendix e-1) indicate statistically significant increases in use of neurology services associated with higher age, presence of the various neurology conditions, having insurance, and living in a metropolitan area. Non-Hispanic whites and blacks have significantly higher utilization among adults relative to Hispanics and non-Hispanic other races. Smoking is associated with lower rates of ambulatory visits, but higher rates of emergency visits.
Substantial geographic variation exists in adequacy of supply. Our analysis of the 2012 AMA Masterfile suggests that nationally there are an average of 5.2 neurologists per 100,000 population. Rates range from 12.1 (Massachusetts, which has a large number of academic medical centers) to 2.6 (Nevada and Wyoming). Using projected demand for each state after simulating demand for a representative sample of the population in each state, we compare supply and demand in 2012 (figure 1, table).
Figure 1. Estimated supply and demand for neurologists: 2012.

Table.
Estimated supply and demand for neurologists by state: 2012–2025a
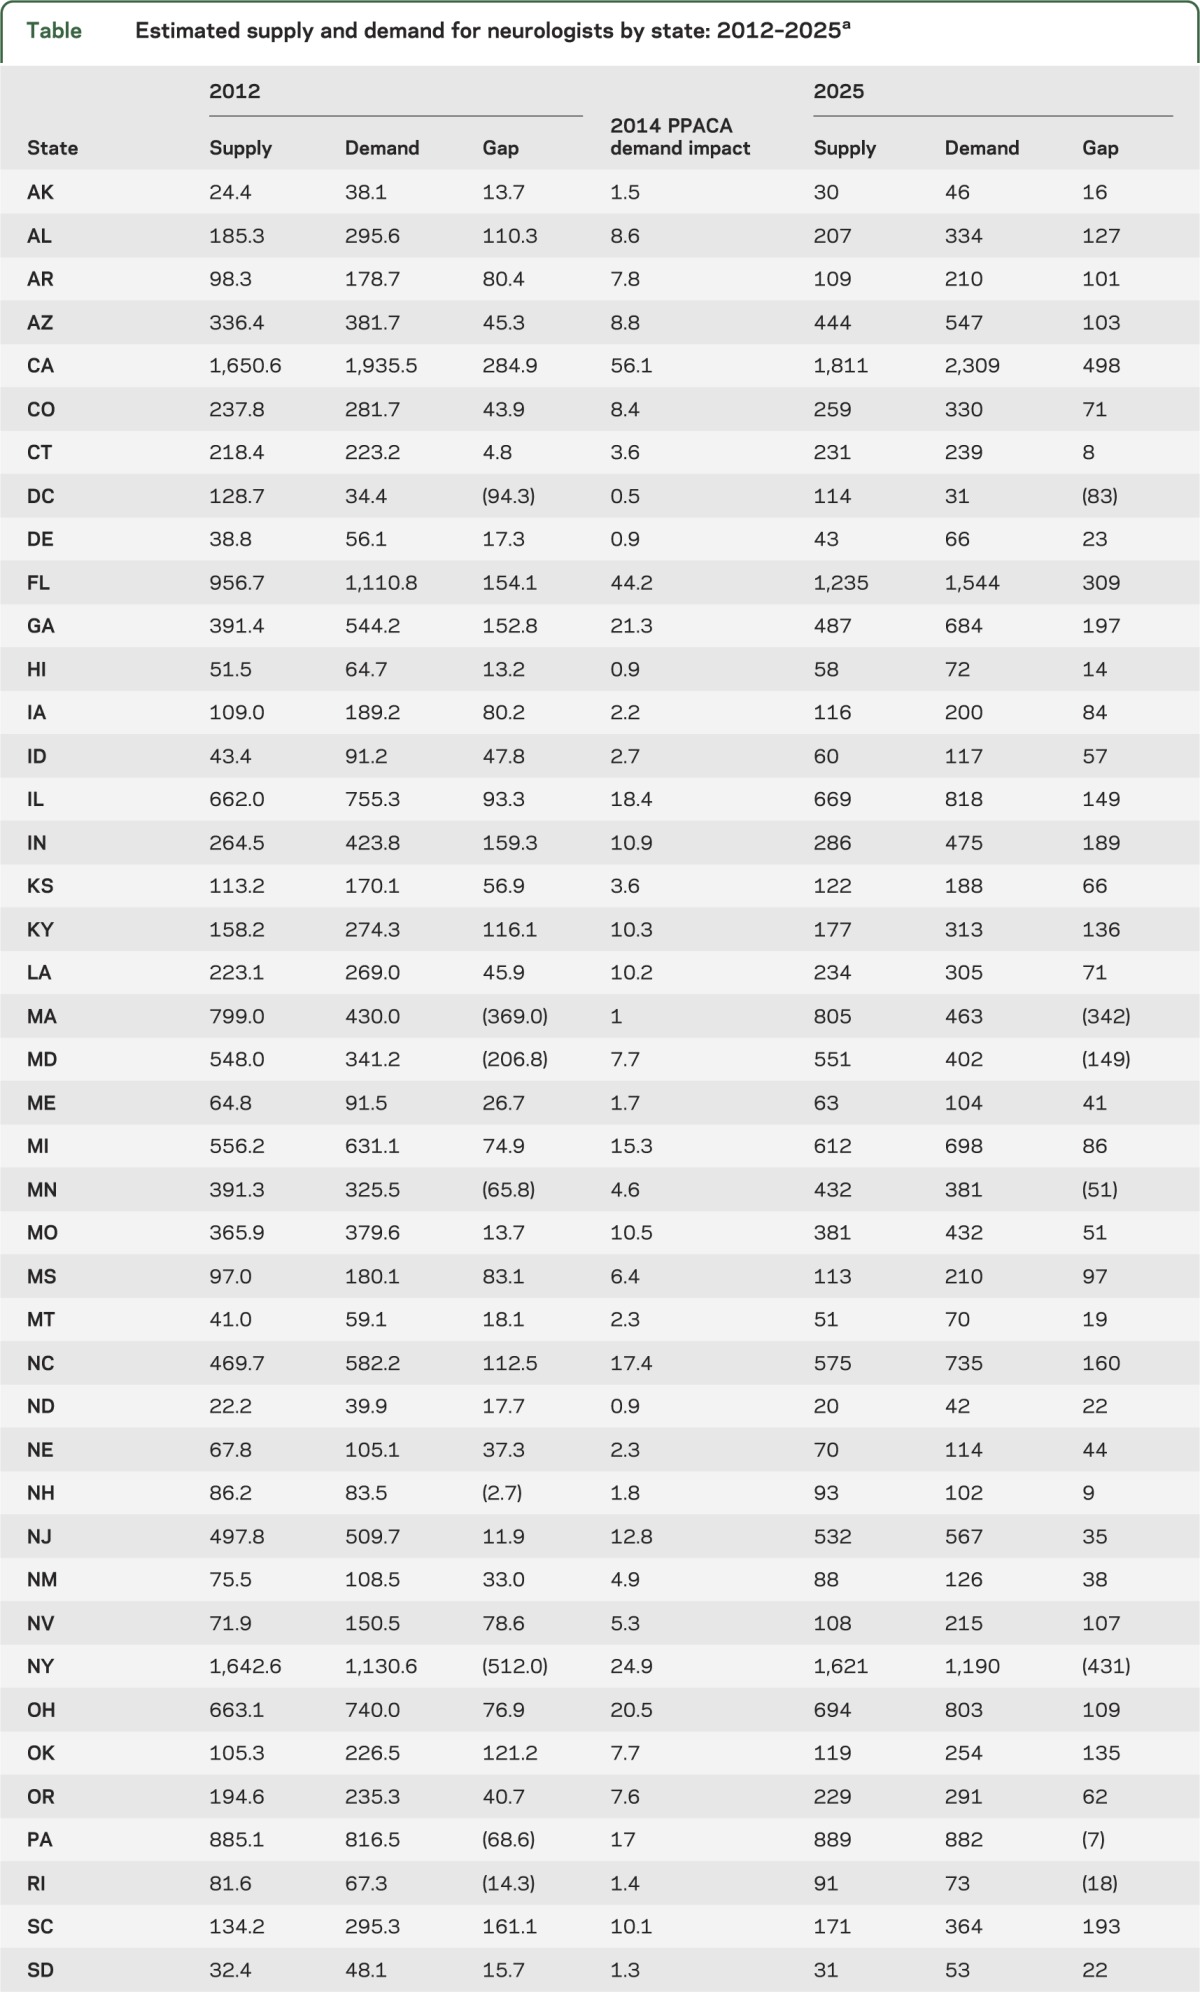
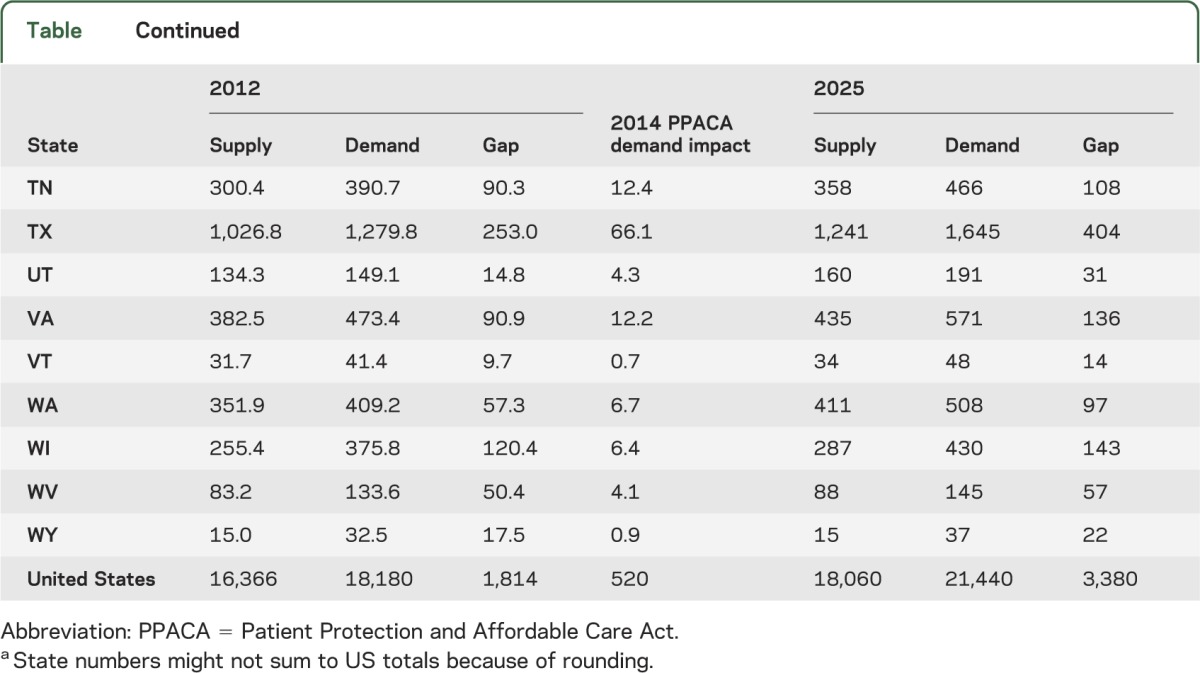
Controlling for demographics and the other health risk factors included in the analysis but assuming that patterns of care use and delivery remain unchanged over time, at the national level, demand grows by approximately 2,740 FTEs, from approximately 18,180 in 2012 to 20,920 by 2025. This includes growth in demand of 220 child and 2,520 adult neurologists.
Under PPACA, an estimated 30 million adults across the United States could gain medical coverage starting in 2014.24 Because individual states have some leeway in how they implement PPACA, the total impact on demand for neurologist services is unknown. However, if the current health care use patterns of adults who would gain medical coverage change to patterns of privately insured adults who have similar health risk characteristics, an additional 520 adult neurologists could be needed starting in 2014 (table).
If care utilization patterns for patients in non-metropolitan areas were similar to patterns for similar patients in metropolitan areas, an additional 460 FTE neurologists would be needed in non-metropolitan areas (but this amount is part of the assumed current national shortfall).
Taking into account changing demographics and associated increase in prevalence of neurologic conditions, the national shortfall rises from 11% (the overall shortfall reflecting 10% for adult and 20% for child neurologists) in 2012 to 16% in 2025. With the impact of PPACA, the shortfall rises to 19% by 2025. Even if one assumed that supply and demand currently were in equilibrium at the national level, demand is projected to grow faster than supply.
A comparison of the various supply and demand scenarios projected suggests that even under the most optimistic supply scenario national provider shortfalls are likely to persist (figure 2). For adult neurology under the baseline scenarios, the national shortfall is projected to grow. While supply of child neurologists is growing at a slightly faster rate than is demand, a shortfall is projected to persist through 2025. State-level shortages are projected to persist and grow more severe over time (figure 3).
Figure 2. Comparison of alternative supply and demand scenarios: 2012–2025.

Figure 3. Estimated supply and demand for neurologists: 2025 (including Patient Protection and Affordable Care Act impact).

DISCUSSION
This study highlights a current substantial national shortfall of neurologists, especially pediatric neurologists, and even greater shortfalls in select states. Reports of difficulty filling neurologist positions, long wait time for scheduling new and follow-up visits, low access to care by Medicaid patients, and our sensitivity analysis all point toward a current national shortfall. Through 2025 demand for neurologists is projected to grow faster than supply, creating a serious limitation of access to care for those patients with neurologic disease. The magnitude of the future shortfall may be even greater than suggested by our findings. As more residents subspecialize (e.g., in sports medicine, as hospitalists, and in neurointensive care), there may be even fewer neurologists to provide care to patients with chronic conditions.
The primary strengths of this study include the following: 1) use of recent data with sufficient sample size to provide reliable estimates of key model parameters; 2) use of state-of-the-art workforce projection models; and 3) ability to forecast state and national supply and demand taking into account geographic variation in prevalence of neurologic conditions. The primary limitations include the following: 1) lack of quantified estimate of the magnitude of the current shortfall, although there is evidence that demand exceeds supply; 2) uncertainty of how care delivery patterns might change over time with emerging care delivery models and greater reliance on nurse practitioners and physician assistants; 3) uncertainty of whether low (and possibly decreasing) Medicare reimbursement rates will affect specialty choice for new physicians, as well as the impact of continued low reimbursement rates on physician retirement patterns; 4) uncertainty of whether changes in technology or medical intervention will change the way that care is used or delivered; and 5) the overestimation of present and future supply of neurologists when one factors in the duties of neurologic house staff, neurologists in administration positions, and academic neurologists whose capability of seeing patients is curtailed by other responsibilities. Another uncertainty is how expanding enrollments at existing allopathic and osteopathic medical schools and the development of new medical schools will affect the neurology workforce supply.25,26 While we model the supply implications of high graduate and low graduate scenarios, potential large reductions in funding for graduate medical education could reduce the number of new graduates by levels even greater than our low graduate scenario.27 This study does not assess neurologist distribution below the state level, and this is an area for future research.
Interviews with neurologists suggest that care delivery patterns likely will change over time, but the net impact on demand for neurologists is unclear. Under an Accountable Care Organization delivery model coupled with the Patient-Centered Medical Home concept, it is possible that neurologists might play more of a consultative role in patient care management. That is, neurologists might have less direct interaction with patients while providing consultation to primary care doctors and nurse practitioners. Such a scenario might decrease the demand for neurologists. However, the nation is not producing sufficient numbers of new primary care physicians to keep up with demand, many primary care physicians receive relatively little training in basic neurologic diagnosis and in caring for patients with chronic neurologic conditions, and the American Board of Internal Medicine no longer requires a rotation in neurology over a 3-year period of training. Consequently, a greater portion of primary care services might be delivered by nurse practitioners and physician assistants whose training in neurologic disease is even more limited, suggesting that a decrease in demand for neurologists associated with emerging care delivery models seems less probable than either the same or more demand.
Another trend affecting demand for neurologists is greater use of advanced practice nurses and physician assistants. Neurologists interviewed as part of this study indicated that many neurology practices are relying increasingly on nurse practitioners to provide follow-up care to patients, but face difficulty finding extenders with sufficient neurology training.
Despite the study limitations, the models and methods used provide supportive evidence that in many states there is an inadequate supply of neurologists, and that over time the shortfall will persist and increase. These findings underscore the importance of some combination of increasing the supply of neurologists, increasing the supply of nurse practitioners or other physician extenders who can assist with caring for patients with neurologic disease, and finding innovative ways to deliver care that improves provider productivity.
An article discussing the clinical implications of the current and future US neurology workforce will appear in an upcoming issue of Neurology®.
Supplementary Material
ACKNOWLEDGMENT
The authors thank members of the AAN Workforce Task Force for their dedication and contributions to the project: William D. Freeman, MD, FAAN (Chair); Timothy A. Pedley, MD, FAAN (Co-Chair); Peter D. Donofrio, MD, FAAN; Robert C. Griggs, MD, FAAN; Victor W. Henderson, MD, FAAN; Henry J. Kaminski, MD, FAAN; Steven P. Ringel, MD, FAAN; Bruce Sigsbee, MD, FAAN; James C. Stevens, MD, FAAN; Kenneth A. Vatz, MD; and Thomas R. Vidic, MD, FAAN.
GLOSSARY
- AAN
American Academy of Neurology
- ACS
American Community Survey
- AMA
American Medical Association
- BRFSS
Behavioral Risk Factor Surveillance System
- CDC
Centers for Disease Control and Prevention
- FTE
full-time equivalent
- ICD-9
International Classification of Diseases, Ninth Revision
- MEPS
Medical Expenditure Panel Survey
- MGMA
Medical Group Management Association
- NNHS
National Nursing Home Survey
- NRMP
National Residency Match Program
- PPACA
Patient Protection and Affordable Care Act
Footnotes
Supplemental data at www.neurology.org
AUTHOR CONTRIBUTIONS
T.M. Dall: drafting/revising the manuscript for content, study concept and design, analysis and interpretation of data, acquisition of data, statistical analysis, study supervision. M.V. Storm: drafting/revising the manuscript for content, study concept and design, analysis and interpretation of data, acquisition of data, statistical analysis. R. Chakrabarti: study concept and design, analysis and interpretation of data, statistical analysis. O. Drogan: drafting/revising the manuscript for content, study concept and design, analysis and interpretation of data, acquisition of data, study supervision and coordination, obtaining funding. C.M. Keran: drafting/revising the manuscript for content, study concept and design, analysis and interpretation of data, acquisition of data. Dr. Donofrio: drafting/revising the manuscript for content, study concept and design, analysis and interpretation of data. Dr. Henderson: drafting/revising the manuscript for content, study concept and design, analysis and interpretation of data. Dr. Kaminski: drafting/revising the manuscript for content, study concept and design, analysis and interpretation of data. Dr. Stevens: drafting/revising the manuscript for content, study concept and design, analysis and interpretation of data. Dr. Vidic: drafting/revising the manuscript for content, study concept and design, analysis and interpretation of data.
STUDY FUNDING
Supported by the American Academy of Neurology and in part by an educational grant from Lilly USA, LLC.
DISCLOSURE
T.M. Dall, M.V. Storm, and R. Chakrabarti are salaried employees of IHS Healthcare & Pharma. O. Drogan and C.M. Keran are salaried employees of the American Academy of Neurology. Dr. Donofrio, Dr. Henderson, Dr. Kaminski, and Dr. Vidic report no disclosures. J. Stevens received research support from Sanofi-Aventis, Biogen-Idec, Teva, and National Institute of Neurological Disorders and Stroke, and is on the Advisory Board for Biogen-Idec and Genzyme and the speakers’ bureau for Genzyme, Biogen-Idec, and Teva. Dr. Vidic reports no disclosures. Go to Neurology.org for full disclosures.
REFERENCES
- 1.American Academy of Neurology 2012 Practice and Payment Trends Survey: Final Report. Minneapolis: American Academy of Neurology; 2012 [Google Scholar]
- 2.American Academy of Neurology 2010 Medical Economics Issues Survey: Final Report. St. Paul: American Academy of Neurology; 2010 [Google Scholar]
- 3.Merritt Hawkins and Associates Survey for Physician Appointment Wait Times. 2009. Available at: www.merritthawkins.com/pdf/mha2009waittimesurvey.pdf. Accessed August 1, 2012 [Google Scholar]
- 4.American Association of Neurological Surgeons Survey on Medicare Participation Among Neurosurgeons. 2010. Available at: www.aans.org/~/media/Files/Legislative%20Activities/MedicareSurveyReport2010Final.ashx. Accessed August 1, 2012 [Google Scholar]
- 5.Children's Hospital Association Pediatric Specialist Physician Shortages Affect Access to Care. 2012. Available at: http://www.childrenshospitals.net/AM/Template.cfm?Section=Surveys&;Template=/CM/ContentDisplay.cfm&ContentID=63293. Accessed December 22, 2012
- 6.Roehrig C, Eisenstein S. Neurology in the Next Two Decades. St. Paul: American Academy of Neurology; 1999 [Google Scholar]
- 7.National Residency Match Program Results and data: 2012 main residency match. Available at: www.nrmp.org/data/resultsanddata2012.pdf. Accessed December 22, 2012
- 8.Rocky PH; American Medical Association Graduate Medical Education: Will Supply Meet Demand? (Presentation citing Pugno PA, AAFP, Annual Rate of Attrition 2005–2009). 2012. Available at: www.uwmedicine.org/education/wwami/regional-gme/documents/rockey-national-picture-of-gme.pdf. Accessed December 22, 2012 [Google Scholar]
- 9.American Academy of Neurology 2011 AAN Resident Survey Final Report. St. Paul: American Academy of Neurology; 2011. Available at http://www.aan.com/globals/axon/assets/9124.pdf. Accessed June 15, 2012 [Google Scholar]
- 10.Association of American Medical Colleges The Complexities of Physician Supply and Demand: Projections Through 2025. Washington, DC: Association of American Medical Colleges; 2008 [Google Scholar]
- 11.Arias E. United States Life Tables, 2008: National Vital Statistics Reports. vol 61 no 3 Hyattsville, MD: National Center for Health Statistics; 2012 [PubMed] [Google Scholar]
- 12.Johnson NJ, Sorlie PD, Backlund E. The impact of specific occupation on mortality in the U.S. National Longitudinal Mortality Study. Demography 1999;36:355–367 [PubMed] [Google Scholar]
- 13.Adornato BT, Drogan O, Thoresen P, et al. The practice of neurology, 2000-2010: report of the AAN Member Research Subcommittee. Neurology 2011;77:1921–1928 [DOI] [PubMed] [Google Scholar]
- 14.Centers for Disease Control and Prevention Behavioral Risk Factor Surveillance System Survey. Atlanta: U.S. Department of Health and Human Services, Centers for Disease Control and Prevention; 2010 [Google Scholar]
- 15.U.S. Census Bureau Interim State Population Projections 2000-2030 based on Census 2000. Washington, DC: U.S. Census Bureau; 2005 [Google Scholar]
- 16.U.S. Census Bureau 2010 American Community Survey. Washington, DC: U.S. Census Bureau; 2011 [Google Scholar]
- 17.U.S. Census Bureau National Population Projections 2012 to 2060 (based on 2010 Census). Washington, DC: U.S. Census Bureau; 2012 [Google Scholar]
- 18.National Center for Health Statistics The National Nursing Home Survey: 2004 Overview. Vital Health Statistics 2009;13 Available at: www.cdc.gov/nchs/data/series/sr_13/sr13_167.pdf. Accessed April 15, 2012 [PubMed] [Google Scholar]
- 19.Agency for Healthcare Research and Quality 2005-2009 Medical Expenditure Panel Survey. Rockville, MD: Agency for Healthcare Research and Quality; 2011 [Google Scholar]
- 20.American Academy of Neurology 2010 Practice Profile Form Final Report. St. Paul: American Academy of Neurology; 2010 [Google Scholar]
- 21.American Academy of Neurology 2011 Neurohospitalist Survey Final Report. 2012. Available at: www.aan.com/globals/axon/assets/9122.pdf. Accessed April 15, 2012 [Google Scholar]
- 22.Medical Group Management Association Physician Compensation and Production Survey. Englewood, CO: Medical Group Management Association;2010 [Google Scholar]
- 23.Massachusetts Medical Society. Physician Workforce Study. 2010. Available at: http://www.massmed.org/AM/Template.cfm?Section=Research_Reports_and_Studies2&;;TEMPLATE=/CM/ContentDisplay.cfm&;CONTENTID=36166. Accessed July 1, 2012 [Google Scholar]
- 24.Buettgens M, Hall MA. Who Will Be Uninsured After Health Insurance Reform? Urban Institute. 2011. Available at: www.urban.org/uploadedpdf/1001520-Uninsured-After-Health-Insurance-Reform.pdf. Accessed September 30, 2012 [Google Scholar]
- 25.Association of American Medical Colleges Results of the 2011 Medical School Enrollment Survey. Washington, DC: Association of American Medical Colleges; 2012 [Google Scholar]
- 26.Whitcomb ME. New and Developing Medical Schools. New York: Josiah Macy Jr Foundation; 2009 [Google Scholar]
- 27.Nasca TJ, Miller RS, Holt KD. The potential impact of reduction in federal GME funding in the United States: a study of the estimates of designated institutional officials. J Graduate Med Educ 2011;3:585–590 [DOI] [PMC free article] [PubMed] [Google Scholar]
Associated Data
This section collects any data citations, data availability statements, or supplementary materials included in this article.