Abstract
Wide band immittance measures can be useful in analyzing acoustic sound flow through the ear and also have diagnostic potential for the identification of conductive hearing loss as well as causes of conductive hearing loss. In order to interpret individual measurements, the variability in test-retest data must be described and quantified. Contributors to variability in ear-canal absorbance-based measurements are described here. These include: assumptions related to methodologies and issues related to the probe fit within the ear and potential acoustic leaks. Evidence suggests that variations in ear-canal cross sectional area or measurement location are small relative to variability within a population. Data are shown to suggest that the determination of the Thévenin equivalent of the ER-10C probe introduces minimal variability and is independent of the foam eartip itself. It is suggested that acoustic leaks in the coupling of the eartip to the ear canal lead to substantial variations and that this issue needs further work in terms of potential criteria to identify an acoustic leak. Additionally, test-retest data from the literature are reviewed.
1. Introduction
Ear-canal based measures of acoustic absorbance are a potential diagnostic tool for the identification of causes of conductive hearing loss and conductive hearing loss itself. In order for absorbance-based measures to be understood and interpreted, it is essential to describe factors that lead to variability within the measurements themselves. Here we address this issue in terms of test-retest variability.
As discussed by Rosowski et al. (this issue), “absorbance” or “reflectance” measures refer to a suite of quantities that can be calculated from acoustic measurements made in the ear canal and that describe sound flow to and from the middle ear. There are multiple methods to make these measurements, and here the focus will be on the method that is currently most commonly reported within the literature, which uses a Thévenin equivalent description of the sound source and microphone assembly. A pressure measurement is made within the ear canal and the Thévenin equivalent is used to calculate the acoustic impedance at the location of the microphone. From the measured impedance, the absorbance or power reflectance and their related quantities are calculated (Rosowski, this issue). This method is fully described in many places (e.g., Allen, 1986; Keefe et al., 1993; Voss and Allen, 1994). Other methods for the measurement of such quantities include the measurement of pressure distributions along the length of the ear canal (e.g., Stinson, 1990; Farmer-Fedor and Rabbitt, 2002).
Several sources of intra-subject variability within absorbance measurements have been identified within the literature and are discussed below. We note that absorbance is related to another commonly reported quantity power reflectance as absorbance equals one minus the power reflectance. Below, we talk about absorbance whenever possible, but when cited articles specifically reported power reflectance, we summarize the results in terms of power reflectance.
2. Assumptions related to calculation of absorbance using the Thévenin equivalent method
The “Thévenin equivalent method” described above to calculate absorbance from an ear-canal pressure measurement assumes both (1) that there are no losses along the ear canal wall and (2) that the cross-sectional area of the ear canal is known at the measurement location and that this area does not change abruptly along the length of the canal. While these assumptions are not perfect, it is assumed that differences from ideal are negligible. These assumptions were tested by Voss et al. (2008) by making measurements in the ear canals of cadaver ears.
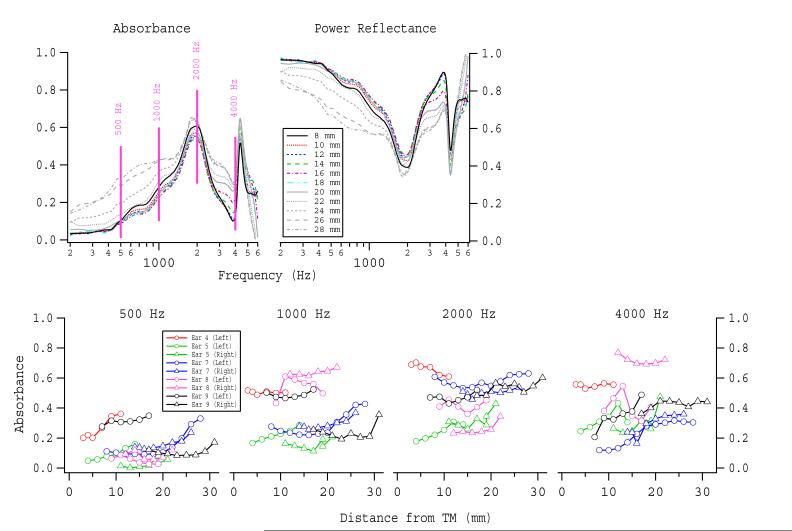
First, the effect of possible losses along the ear canal was tested by making measurements at different locations along the ear canal, ranging from three to 31 mm from the tympanic membrane; if no ear canal losses exist then the absorbance should be independent of measurement location, whereas if losses exist one would expect the absorbance to increase as the distance from the tympanic membrane increases. Voss et al. (2008) found little to no effect of measurement location for some of their ears, and in other ears there was a systematic trend of increasing absorbance (or decreasing power reflectance) as the probe was moved further from the TM, consistent with the absorption of energy along the ear-canal walls. The variability introduced by the measurement location was found to be a relatively small fraction of the variability within the entire population of ears for frequencies up to 5000 Hz; larger changes occurred in the 5000-6000 Hz range. These data are summarized in Fig. 1, where the example ear shown in the upper part of the figure is representative of the data; the absorbance (and power reflectance) is relatively stable and not dependent on measurement location for much of the length of the ear canal close to the tympanic membrane. As the probe is moved to the more outer part of the ear canal, within the cartilaginous portion and not the bony portion, some ears show greater increases in absorbance, consistent with losses along the ear canal.
Figure 1.
Data replotted in terms of absorbance from Voss et al. (2008). UPPER: Example measurements of absorbance and its related quantity power reflectance from one cadaver ear (7 Left), with the parameter being the distance of the measurement location from the tympanic membrane. The pink vertical lines indicate the frequencies at which data were selected to form the lower plot. LOWER: Plots of the absorbance at 500, 1000, 2000, and 4000 Hz for each of nine ears at each measurement location. Note that left and right ears from the same donor are generally more similar to each other than to ears from a different donor.
Second, Voss et al. (2008) also tested the effect of assuming a fixed cross sectional area of the ear canal at the measurement location. They compared calculations of power reflectance that assumed a fixed area based on the average from a population of ears (0.43cm2) with calculations made using a measured area (Fig. 6 Voss et al., 2008); in this case the differences in the power reflectances calculated with the two different areas led to changes in reflectance that were relatively small compared to the population variation. The ranges of measured ear-canal areas are reported by Voss et al. (2008).
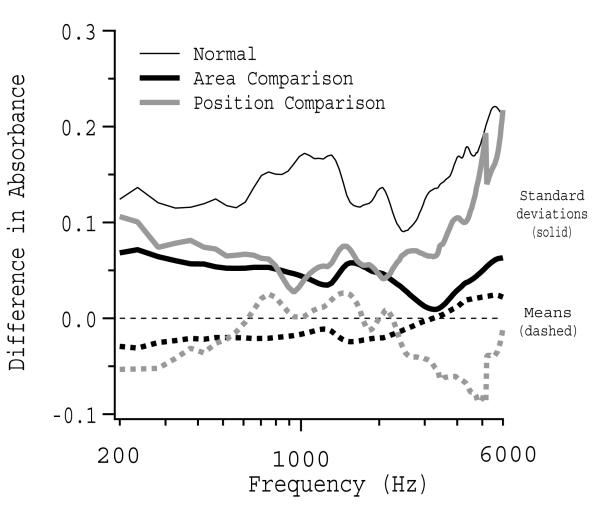
Figure 9 of Voss et al. (2008) summarized their results in terms of percent differences between the baseline condition and the induced change of either measurement position or ear-canal area. Since 2008, others have plotted comparisons in terms of absolute differences in absorbance, and the data from Voss et al. (2008) were reanalyzed here in terms of absolute differences. Fig. 2 plots the mean differences and corresponding standard deviations for three conditions that were measured on all nine ears. (1) “Normal” refers to the absorbance measured at the clinical location in each ear canal minus the mean absorbance of this group of normal measurements. (2) “Area comparison” refers to the difference in the absorbance calculated with the measured area minus the absorbance calculated with the fixed area. (3) “Position comparison” refers to the difference in absorbance calculated from that measured closest to the tympanic membrane minus the absorbance measured closest to 20 mm lateral to the tympanic membrane. The standard deviations for both the area comparison and the position comparison are smaller than for the population comparison.
Figure 2.
Data are from Voss et al. (2008) and have been reanalyzed in terms of differences in absorbance for three conditions. (1) “Normal” refers to the absorbance measured at the clinical location in each ear canal minus the mean absorbance of this group of normal measurements. (2) “Area comparison” refers to the difference in the absorbance calculated with the measured area minus the absorbance calculated with the fixed area. (3) “Position comparison” refers to the difference in absorbance calculated from that measured closest to the tympanic membrane minus the absorbance measured closest to 20 mm lateral to the tympanic membrane. For the three cases, the means and standard deviations are plotted. By definition, the mean for case (1) is zero.
We note that recent work by Rasetshwane and Neely (2011) provides a new method for estimating area from load impedance. Future work might utilize this new method to explore the effect of errors in cross sectional area on absorbance calculations.
3. Determination of the Thévenin Equivalent itself (or “calibration”)
Calculation of absorbance from the Thévenin equivalent of the sound and microphone system requires first measuring the Thévenin equivalent itself. Many articles and researchers refer to this step as “calibration” of the system. One could substitute the phrase “determine the Thévenin equivalent of the system” for the word “calibration” and it would perhaps be more descriptive. To be consistent with the jargon that has developed, we use the term “calibration” to refer to the process of determining the Thévenin equivalent.
The calibration typically involves making acoustic pressure measurements within a set of cylindrical cavities that have a diameter similar to that of the ear canal of interest (Huang et al., 2000). The measurements in the set of cavities is then used, along with knowledge of the theoretical acoustic impedance of the cavities, to minimize an error function in a typically over-specified set of equations, resulting in an optimized estimate for the Thévenin equivalent of the system.
Ongoing measurements within the Voss laboratory at Smith College have investigated some aspects related to the variability in the determination of the Thévenin equivalent. This work involves the use of the Etymotic ER-10C sound-delivery system with the Mimosa Acoustics HearID system for measurement of absorbance. The ER-10C requires coupling a disposable foam tip to the sound source and it provides two independent sound channels that each have their own Thévenin equivalent. Measurements of the Thévenin equivalents for this system were made systematically to test the variability of the Thévenin equivalent itself for both (1) when multiple calibrations were made and (2) when different disposable foam tips were used in the calibrations. Specifically, the Thévenin equivalent was measured (for each of two channels) a total of 20 times, and the tip was changed between each measurement. On each of the odd-numbered measurements, the same yellow disposable foam tip was used (“single tip”). On each of the even numbered measurements, a unique disposable foam tip was used (“alternating tip”). Thus, comparison of the Thévenin equivalents determine the consistency of the calibrations as well as whether or not the specific foam plug plays an important role in the Thévenin equivalent. We also determine how variations in measurement of the Thévenin equivalent affect the calculation of absorbance by calculating the absorbance from a single pressure measurement in an ear with each of the 40 different calibrations.
For a given channel (1 or 2), there were no systematic differences in the means of the magnitudes and angles of the Thévenin equivalents (impedances and pressures) between the group with the single tip and the group with the alternating tip. Thus, it appears that the individual yellow tip has little effect on the measurement of the Thévenin equivalent.
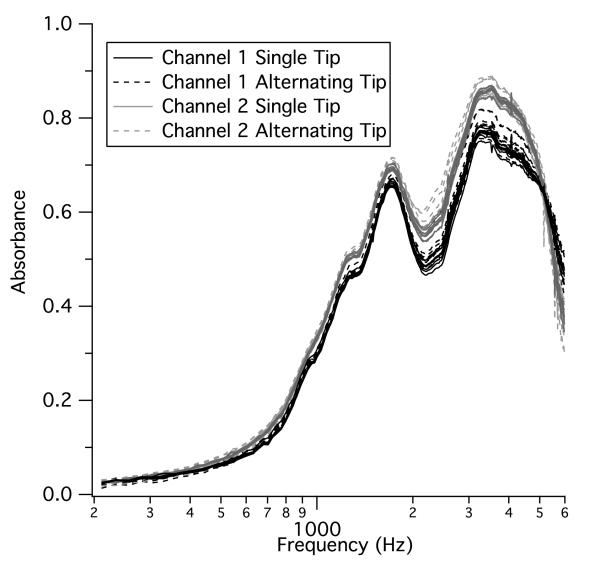
Figure 3 shows how the small variations in the measured Thévenin equivalents affect the calculation of the absorbance of a normal ear. Here, a single ear-canal pressure measurement was used with the 40 Thévenin equivalents described above. In general, the computed absorbance is minimally affected by the Thévenin equivalent used, such that the variability in the Thévenin equivalents would introduce insignificant variability to measurements of absorbance. At the same time, these results do not imply that the calibration procedure is unnecessary or that a manufacturer calibration would be sufficient, as it is possible for the calibration to be altered if debris or moisture is introduced into the source or eartip.
Figure 3.
Absorbance calculated using a single pressure measurement in the ear canal and 40 different measurements of the Thévenin equivalent from a single ER-10c probe system. Twenty measurements from channel 1 are in solid and dashed gray lines and 20 measurements from channel 2 are in solid and dashed black lines.
4. Probe tip fitting within the ear canal
The Thévenin equivalent method used to measure absorbance assumes that the probe tip fits tightly within the ear canal and the calibration loads. It requires no acoustic leaks and it requires that neither the sound-outlet tube nor the microphone are pressed up against the ear canal wall or filled with any type of debris (e.g., wax).
Accurate measurement of absorbance requires a high-quality acoustic seal between the insert earphone’s tip and the ear canal. Small paths that allow the escape of sound energy lead to substantial errors in absorbance, and such errors lead to intra-subject variability among measurements when leaks are not identified. The exact effects of leaks is not easily quantified, as the effects depend on both the size of the leak and the impedance of the ear to which the eartip is attached. Below we offer a brief review of issues that have been discussed and reported in the literature.
Keefe et al. (2000) summarizes how acoustic leaks affect some measures related to power reflectance. In normal-hearing adult ears, Keefe et al. (2000) state that power reflectance should be relatively high at frequencies below about 500 Hz (as compared to other frequencies), and a low power reflectance in this frequency range is a strong indicator of a leak. In young babies or in pathological ears, determination of a leak is more difficult. Figure 1 of Keefe et al. (2000) shows the effects of loosening the probe within a newborn’s ears on the reflectance, resistance, and reactance. The resistance (real part of the impedance) decreases substantially with the leak and the low-frequency reflectance becomes noisy. Perhaps most importantly, the low-frequency reactance goes from being mostly negative (no leak) to all positive (with leak), which is comparable to the angle of the impedance being negative (compliance dominated) at low frequencies with no leak and changing to positive (mass dominated) with a leak. Keefe et al. (2000) suggest calculating an equivalent volume at low frequencies, where a negative volume suggests a leak. Werner et al. (2010) use this same approach to screen their results. One major theme of Keefe et al. (2000) is that a gold standard is needed for identifying the presence of acoustic leaks.
Figure 1 from Vander Wer et al. (2007) plots test-retest differences in power reflectance for infants. Their data show that the test-retest differences are larger for rubber tips than foam tips. They conclude the foam tips reduce the amount of acoustic leaks since they have the ability to expand within the ear canal.
Building upon this need for a gold standard, ongoing work described by Amadei et al.1 and Voss et al.2 aims to develop a set of “data selection criteria” that would identify measurements with both acoustic leaks and probes that are either blocked or pushed up against the edge of the ear canal. While this work is ongoing, a major suggestion is to inspect the acoustic impedance measures within specific groups (including age and pathological condition) to determine features that can be used to identify faulty measurements. Specific examples include the suggestions that the phase angle of the impedance should be relatively flat with frequency and negative in most cases for frequencies below 500 Hz and that the impedance magnitudes should be within specific bounds. Moving forward, such criteria could become part of the gold standard discussed by Keefe et al. (2000).
5. Test-retest measurements
Limited experiments have been presented in the literature to examine test-retest variability within absorbance/reflectance measures. Below, we summarize reports from four publications and make comparisons wherever possible.
Vander Werff et al. (2007) (Mimosa Acoustics system) report measurements of the difference in the power reflectance from test-retest measures with the probe reinserted between measurements during the same measurement session (same day). Adults appear to have more consistent test-retest results than infants; the 90th percentile in adults is within 0.05 of the original test whereas the 90th percentile in the infants is close to 0.1 different from the original.
Hunter et al. (2008) (Mimosa Acoustics system) analyze test-retest measurements of power reflectance where the sequential measurements were made within the same test session and included reinsertion of the foam probe tip. In this case, the intraclass correlation coeffcient was reported at nine frequencies (range 0.68 to 0.97) as evidence of “substantial reliability of repeat measures within the same test session” (Hunter et al., 2008).
Werner et al. (2010) provide an extensive discussion of test-retest measurements of power reflectance from both infants and adult ears. In this case, measurements were made a total of two times, on different days, on a subset of their subjects. Test-retest correlations are reported in 3rd-octave bands for the three quantities of resistance, reactance, and power reflectance. Higher correlations were found in adults than infants, with the lowest reported correlations for power reflectance in infants which ranged from 0.26 to 0.57. Werner et al. (2010) also report mean test-retest absolute differences for power reflectance that are on the order of 0.1 to 0.15, with 90th percentile values that are generally in the 0.2 to 0.3 range (with some exceptions of larger values). Werner et al. (2010) also examined the general shape of the reflectance of the test-retest measures using a cross correlation procedure. In their words, “peculiar features of an individual’s WATF tended to appear on retest” – meaning that they found individual differences in power reflectance to be stable on test-retest measurements. Major conclusions relevant to this article include: (1) the test-retest differences in power reflectance were smaller for adult ears than for infant ears, (2) adult test-retest differences were similar to those reported by Rosowski et al. (2012), (3) Werner et al. (2010) suggests that their test-retest differences in infants are larger than those reported by Vander Werff et al. (2007) (differences of 0.4 at the 90th percentile as compared to 0.1) could be due to the younger babies in the Vander Werff et al. (2007) study or the awake (Werner et al., 2010) versus sleeping (Vander Werff et al., 2007) state of the babies, and (4) individual features of the reflectance measurement appear to be repeatable via test-retest measurements.
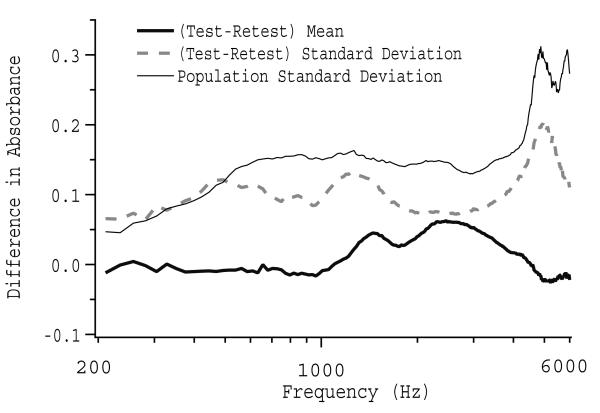
Most recently, Rosowski et al. (2012) made four power reflectance measurements at one week intervals on each of seven subjects. They present the mean difference and corresponding standard deviation between the initial measurement and each of the other three measurements. These results are reproduced here as Fig. 4. Rosowski et al. (2012) argue that the standard deviation for the repeated measurements is not all that different from the population standard deviation. Also noteworthy is that these measurements, with a week of time between each of them, show substantially larger variations than the repeated measurements of Vander Werff et al. (2007), in which the eartip was reinserted between measurements but the measurements were made during the same measurement session. Indeed, measurements from Werner et al. (2010) and Rosowski et al. (2012) show similar intrasubject variability among adult ears.
Figure 4.
Data from Figure 5(b) from Rosowski et al. (2012). Summarizes chances in absorbance (or power reflectance) from each of seven subjects measured four times each at week-long intervals.
There are additional factors that can contribute to intrasubject variability that is measured via test-retest conditions. For example, changes in ear canal static pressure or fluid levels would lead to changes in power reflectance within a given ear. These types of factors must be controlled when comparing intrasubject variabilty. Additionally, the orientation of the probe in the ear canal (e.g., blocked against the canal, bent, or twisted) can lead to variations.
6. implications and proposed directions for future research and clinical practice
The variations in test-retest measurements of power reflectance have yet to be fully described and need further work to understand. Recent work by Rosowski et al. (2012) suggests that test-retest measurements on individuals have standard deviations that are substantial fractions of the population standard deviation. Moving forward, additional test-retest data could be helpful in determining the extent of intrasubject variability in power reflectance measures. The data reviewed here suggest there can be substantial variations but don’t provide specific explanations for it. One possibility would be to employ a consistent set of data selection criteria to ensure that every measurement has a quality acoustic seal and is not a ected by changes in middle ear static pressure or other factors that can influence the power reflectance. As more measurements are made in this area, it would be helpful for researchers to be able to easily compare across studies. We suggest that test-retest data be reported as absolute differences from a baseline measurement, similar to the method of Rosowski et al. (2012) shown here in Fig. 4.
Footnotes
This is a PDF file of an unedited manuscript that has been accepted for publication. As a service to our customers we are providing this early version of the manuscript. The manuscript will undergo copyediting, typesetting, and review of the resulting proof before it is published in its final citable form. Please note that during the production process errors may be discovered which could affect the content, and all legal disclaimers that apply to the journal pertain.
References
- Allen JB. Measurement of eardrum acoustic impedance. In: Allen JB, Hall JL, Hubbard A, Neely ST, Tubis A, editors. Peripheral Auditory Mechanisms. Springer-Verlag; 1986. pp. 44–51. [Google Scholar]
- Farmer-Fedor BL, Rabbitt RD. Acoustic intensity, impedance and reflection coefficient in the human ear canal. J. Acoust. Soc. Am. 2002;112:600–620. doi: 10.1121/1.1494445. [DOI] [PubMed] [Google Scholar]
- Huang GT, Rosowski JJ, Puria S, Peake WT. Tests of some common assumptions of ear-canal acoustics in cats. J. Acoust. Soc. Am. 2000;108:1147–1161. doi: 10.1121/1.1287025. [DOI] [PubMed] [Google Scholar]
- Hunter LL, Tubaugh L, Jackson A, Propes S. Wideband middle ear power measurement in infants and children. J Am Acad Audiol. 2008;19:309–324. doi: 10.3766/jaaa.19.4.4. [DOI] [PubMed] [Google Scholar]
- Keefe DH, Bulen JC, Arehart KH, Burns EM. Ear-canal impedance and reflection coefficient in human infants and adults. J. Acoust. Soc. Am. 1993;94(5):2617–2638. doi: 10.1121/1.407347. [DOI] [PubMed] [Google Scholar]
- Keefe DH, Folsom RC, Gorga MP, Vohr BR, Bulen JC, Norton S. Identification of neonatal hearing impairment: Ear-canal measurements of acoustic admittance and reflectance in neonates. Ear Hear. 2000;21:443–461. doi: 10.1097/00003446-200010000-00009. [DOI] [PubMed] [Google Scholar]
- Rasetshwane DM, Neely ST. Inverse solution of the ear-canal area function from reflectance. J. Acoust. Soc. Am. 2011;130:38733881. doi: 10.1121/1.3654019. [DOI] [PMC free article] [PubMed] [Google Scholar]
- Rosowski JJ, Nakajima HH, Hamade MA, Mahfoud L, Merchant GR, Halpin CF, Merchant SN. Ear-canal reflectance, umbo velocity, and tympanometry in normal-hearing adults. Ear Hear. 2012;33:19–34. doi: 10.1097/AUD.0b013e31822ccb76. [DOI] [PMC free article] [PubMed] [Google Scholar]
- Stinson MR. Revision of estimates of acoustic energy reflectance at the human eardrum. J. Acoust. Soc. Am. 1990;88(4):1773–1778. doi: 10.1121/1.400198. [DOI] [PubMed] [Google Scholar]
- Vander Werff KR, Prieve BA, Georgantas LM. Test-retest reliability of wideband reflectance measures in infants under screening and diagnostic test conditions. Ear Hear. 2007;28:669681. doi: 10.1097/AUD.0b013e31812f71b1. [DOI] [PubMed] [Google Scholar]
- Voss S, Horton N, Woodbury R, Sheffield K. Sources of variability in reflectance measurements on normal cadaver ears. Ear Hear. 2008;29:651–655. doi: 10.1097/AUD.0b013e318174f07c. [DOI] [PubMed] [Google Scholar]
- Voss SE, Allen JB. Measurement of acoustic impedance and reflectance in the human ear canal. J. Acoust. Soc. Am. 1994;95:372–384. doi: 10.1121/1.408329. [DOI] [PubMed] [Google Scholar]
- Werner LA, Levi EC, Keefe DH. Ear-canal wideband acoustic transfer functions of adults and two- to nine-month-old infants. Ear Hear. 2010;31:587–598. doi: 10.1097/AUD.0b013e3181e0381d. [DOI] [PMC free article] [PubMed] [Google Scholar]
Reference Notes
- 1.Amadei EA. Power reflectance measurements on infant ears with normal hearing and transient hearing loss. Smith College Undergraduate Honors Thesis. 2010 [Google Scholar]
- 2.Voss SE, Herrmann BS, Horton NJ, Amadei EA, Parson J, Kujawa SG. Reflectance measurements on normal and fluid-filled newborn ears. Abstracts of the American Auditory Society Annual Meeting.2012. [Google Scholar]


