

Abstract
Using liquid chromatography tandem mass spectrometry, we determined the first nationwide inventories of 13 perfluoroalkyl substances (PFASs) in U.S. biosolids via analysis of samples collected by the U.S. Environmental Protection Agency in the 2001 National Sewage Sludge Survey. Perfluorooctane sulfonate [PFOS; 403 ± 127 ng/g dry weight (dw)] was the most abundant PFAS detected in biosolids composites representing 32 U.S. states and the District of Columbia, followed by perfluorooctanoate [PFOA; 34 ± 22 ng/g dw] and perfluorodecanoate [PFDA; 26 ± 20 ng/g dw]. Mean concentrations in U.S. biosolids of the remaining ten PFASs ranged between 2 and 21 ng/g dw. Interestingly, concentrations of PFOS determined here in biosolids collected prior to the phase-out period (2002) were similar to levels reported in the literature for recent years. The mean load of ΣPFASs in U.S. biosolids was estimated at 2749–3450 kg/year, of which about 1375–2070 kg is applied on agricultural land and 467–587 kg goes to landfills as an alternative disposal route. This study informs the risk assessment of PFASs by furnishing national inventories of PFASs occurrence and environmental release via biosolids application on land.
Keywords: Perfluorochemicals, Biosolids, National Inventory, Land application, Emerging contaminants, Risk assessment
1. Introduction
Perfluoroalkyl substances (PFASs) are anthropogenic chemicals that have been widely used in commercial products since the 1950s [1]. Due to their unique properties of repelling both water and oil, PFASs are extensively used in the manufacture of surfactants, lubricants, polishes, textile coatings, and fire-retarding foams [1]. As a result PFASs are released into the environment at significant quantities and have been detected in surface water, fish, birds, mammals, and humans worldwide [2–6]. Although the production of two major PFASs, perfluorooctane sulfonate (PFOS) and perfluorooctanoic acid (PFOA), has been phased out in several major U.S. companies, continued environmental contamination of PFASs results from the use of precursors such as fluorotelomer alcohols and polyfluoroalkyl phosphates [7]. PFASs are emerging contaminants of increasing interest to the scientific community, due to their widespread occurrence in the environment and evidence of potential or known adverse human health effects. PFASs have been shown to persist in the environment, to bioaccumulate in animals and to occur at significant levels even in remote regions like the Arctic [3,5,8,9]. PFOS is the predominant PFAS detected in all wildlife species worldwide [7]. One study reported bioaccumulation of PFOS in polar bears at concentrations even greater than polychlorinated biphenyls (PCBs) [10]. Results from animal studies have associated PFOS and PFOA with developmental and reproductive toxicity [11,12], as well as cancer [13]. In humans, both PFOS and PFOA are shown to cross the placenta readily [14,15], and epidemiological studies on fetal exposure have associated high levels of PFOS with reduced growth metrics of newborns [16]. Additionally, both PFASs have been associated with elevated total cholesterol levels in humans [17].
PFASs are considered to be highly resistant to biodegradation due to their extremely strong carbon–fluorine bonds [18]. They are not efficiently removed in municipal wastewater treatment plants (WWTPs), and the presence of PFASs in wastewater effluents and biosolids is of increasing concern [19]. Concentrations of PFOS and PFOA have been reported of up to 990 and 241 ng/g of biosolids, respectively [20–22]. Studies have also shown that several PFASs increase in concentration during the WWTP process train, suggesting the presence of precursor compounds that degrade and release persistent perfluorinated carboxylic acids and sulfonates (PFCAs and PFSAs) [20,23]. Land application of biosolids contaminated with PFASs was shown to contaminate soil, groundwater, and surface waters [19,22]. Soil concentrations of PFOS as high as 483 ng/g were reported at a land reclamation site in Illinois after 32 years of consecutive applications of biosolids at the rate of 69 Mg biosolids ha−1 yr−1 [22]. In Decatur, AL, about 22% of samples collected from surface and well water near fields with a history of PFASs contaminated biosolids application exceeded the health advisory level of the U.S. Environmental Protection Agency (U.S. EPA) of 400 ng/L for PFOA [19]. Multiple studies have shown that PFASs of shorter chain length tend to become mobilized from soil readily to contribute to contamination of surface water and groundwater [19,22]. The widespread occurrence of PFASs at significant concentrations in the environment necessitates a better understanding of environmental occurrence and transport processes in order to inform both human health risk assessments and regulatory requirements for these recalcitrant, mobile chemicals.
The U.S. EPA has performed several National Sewage Sludge Surveys (NSSS) to evaluate the need for regulating trace contaminants [24]. The present study was performed to extend this effort to other emerging contaminants that were excluded from past U.S. EPA studies. In a research collaboration, unused samples from EPA’s 2001 survey were acquired and are being archived in the Biodesign Institute at Arizona State University as part of the U.S. National Biosolids Repository maintained there. The approach of analyzing archived composite biosolids had been validated previously in studies of pharmaceuticals and personal care products (PPCPs) and alkylphenol surfactants performed to evaluate their nationwide occurrence in biosolids [25–27]. The present work employed a similar methodology to analyze for PFASs to enable risk assessment and to determine baseline concentrations and national inventory for these chemicals in treated municipal sludge fit for land application.
2. Materials and methods
2.1. Sample description
Biosolids samples, originally collected by the EPA from 94 WWTPs in 32 states and the District of Columbia as part of the 2001 National Sewage Sludge Survey by U.S. EPA, were retrieved from the U.S. National Biosolids Repository at the Biodesign Institute at Arizona State University. Information on sampling locations is available in supplementary material. The facilities were selected by the U.S. EPA to obtain unbiased national estimates of chemical contaminants in U.S. sewage sludges that are disposed of primarily by land application. The samples were collected between February and March 2001 according to an established protocol, only from facilities that included secondary treatment [28,29]. All samples were collected in 500 mL glass or polyethylene jars, and to the best of our knowledge no Teflon containing tools were used during sampling of sludge; thus eliminating possible contamination during sampling of sludge samples by PFASs [29]. Samples were collected from only processed sewage sludges intended for disposal. The biosolids composites analyzed in this study constitute a representative sample (94 facilities) of the more than 16,000 U.S. WWTPs. The purpose of EPA’s survey was to estimate levels of dioxins, dibenzofurans, and coplanar polychlorinated biphenyls in biosolids. After completion of 2001 NSSS, the samples were acquired by our laboratory and stored in amber glass jars (500 mL) at −20 °C for further analysis. Samples were stored initially at Johns Hopkins University, and later transferred to Arizona State University for long-term maintenance. Of the 94 WWTPs, 89 had single system (either aerobic or anaerobic digestion) and five of them had two systems for sludge treatment (both aerobic and anaerobic digestion). Samples were collected from each treatment systems amounting to a total of 113 biosolids samples. Three of these samples were excluded from analysis due to broken containers. The rest of the 110 biosolids samples were randomly grouped into five composite samples, each containing solids from between 21 and 24 individual samples. Sampling procedure and preparation of composites are described in detail elsewhere [27]. A duplicate of composite sample #1 was prepared to serve as a blind duplicate. Composite samples were prepared to establish national baseline levels for these compounds; the validity of the present approach has been demonstrated previously [25–27].
Supplementary material related to this article found, in the online version, at http://dx.doi.org/10.1016/j.jhazmat.2013.03.016.
2.2. Sample analysis
Biosolids composites were analyzed for PFASs by a commercial lab (AXYS Analytical Services Ltd., Sydney, British Columbia, Canada) that developed EPA Method 1694 for pharmaceuticals and personal care products, and that specializes in the analysis of traditional and emerging contaminants. AXYS is a nationally accredited commercial lab in Canada and also is accredited by the National Environmental Laboratory Accreditation Program (NELAC) in Florida and New Jersey for PFAS analysis. The analytical method used had been employed previously in peer-reviewed studies on the level of PFASs in various environmental matrices [30,31]. Analyte concentrations were determined using the isotope dilution technique for all compounds. About 5 g of dried homogenized (<4 mm) biosolids samples were spiked with isotope-labeled surrogates and analytes were extracted once with dilute acetic acid solution and then twice with a mixture of 0.3% ammonium hydroxide and 99% methanol solution, each time by shaking the slurries and collecting the supernatants. Supernatants were combined and treated with ultra pure carbon powder. The resulting solution was diluted with water and cleaned up by solid phase extraction (SPE; Oasis WAX, Waters, Milford, MA, USA). The eluate was then spiked with recovery standards prior to analysis. Sample extracts were separated by high performance liquid chromatography using a reversed-phase column (X terra C18 3.5 μm, 2.1 mm × 100 mm; Waters, Milford, MA) as described previously [30,31]. Analyses were performed using a Micromass Quattro Ultima triple quadrupole tandem mass spectrometer (Waters, Milford, MA) in Selected Reaction Monitoring (SRM) mode (Table 1).
Table 1.
PFASs target analytes and their respective detection and quantification parameters
| Target analyte | Retention time (min) | Precursor ion m/z | Product ion m/z | Quantified against |
|---|---|---|---|---|
| Perfluorobutanoate (PFBA) | 5 | 213 | 169 | 13C4-PFBA |
| Perfluoropentanoate (PFPeA) | 5.8 | 263 | 219 | 13C2-PFHxA |
| Perfluorohexanoate (PFHxA) | 6.2 | 313 | 269 | 13C2-PFHxA |
| Perfluoroheptanoate (PFHpA) | 6.6 | 363 | 319 | 13C2-PFHxA |
| Perfluorooctanoate (PFOA) | 7 | 413 | 369 (169)a | 13C2-PFOA |
| Perfluorononanoate (PFNA) | 7.4 | 463 | 419 | 13C5-PFNA |
| Perfluorodecanoate (PFDA) | 7.9 | 513 | 469 | 13C2-PFDA |
| Perfluoroundecanoate (PFUnDA) | 8.5 | 563 | 519 | 13C2-PFDA |
| Perfluorododecanoate (PFDoDA) | 9 | 613 | 569 | 13C2-PFDoA |
| Perfluorobutane sulfonate (PFBS) | 6.3 | 299 | 80 (99)a | 18O2-PFHxS |
| Perfluorohexane sulfonate (PFHxS) | 7.2 | 399 | 80 (99/119)a | 18O2-PFHxS |
| Perfluorooctane sulfonate (PFOS) | 8.2 | 499 | 80 | 13C4-PFOS |
| Perfluorooctane sulfonamide (PFOSA) | 9.9 | 498 | 78 | 13C4-PFOS |
| Surrogate standard | ||||
| 13C4-PFBA | 5.0 | 217 | 172 | 13C2-PFOUEA |
| 13C2-PFHxA | 6.2 | 315 | 270 | 13C2-PFOUEA |
| 13C2-PFOA | 7.0 | 415 | 370 | 13C4-PFOA |
| 13C5-PFNA | 7.4 | 468 | 423 | 13C2-PFOUEA |
| 13C2-PFDA | 7.9 | 515 | 470 | 13C2-PFOUEA |
| 13C2-PFDoDA | 9.0 | 615 | 570 | 13C2-PFOUEA |
| 18O2-PFHxS | 7.2 | 403 | 84 (103)a | 13C2-PFOUEA |
| 13C4-PFOS | 8.2 | 503 | 80 (99)a | 13C2-PFOUEA |
| Recovery standard | ||||
| 13C2–2H-perfluoro-2-decenoic acid (PFOUEA) | 7.3 | 459 | 394 | – |
| 13C4-perfluorooctanoic acid | 6.9 | 417 | 372 | – |
Alternate transition were used if necessary to avoid interference.
Quality assurance and quality control procedures included method blanks and matrix spikes to evaluate recovery rates in percent. Analysis of duplicate samples was performed by the lab for each batch with greater than six samples. Positive identification of target analytes, surrogate standard and recovery standards required the compound retention time to fall within 0.4 min of the predicted retention times from the mean determined from the initial calibration. Native compounds with labeled surrogate standards had to elute within 0.1 min of the associated labeled surrogates. All concentrations are reported on a dry weight (dw) basis. Precision between samples and duplicates was expressed as relative percent difference (RPD), which was calculated using the following expression:
| (1) |
where Csample and Cduplicate are the concentration detected in the original sample and in its duplicate, respectively.
2.3. Estimation of annual loading of PFASs to agricultural soil
The annual loading of PFASs in biosolids was calculated based on the annual biosolids production of 5.1–6.4 million metric dry tonnes (5.6–7 million dry U.S. tonnes) in the U.S. [32–34].
| (2) |
The estimated percentage of total biosolids use and disposal (50–60% to land application; 17% to landfills; 20% to incineration) were used to calculate the load of PFASs to the various end use components from Eq. (2).
3. Results and discussion
3.1. Method performance
The method detection limits (MDL) for the various PFASs ranged between 0.03 and 0.14 ng/g dry weight (dw) of biosolids. Recoveries from matrix spike experiments for the various analytes ranged between 75 and 110% in biosolids (Table 2). Analysis precision, expressed as relative percent difference (RPD), was within 20% for most of the analytes in blinded duplicates for biosolids analysis except for PFBA (52%), PFPeA (24%), and PFBS (21%). The RPD for non-blinded duplicates of biosolids was within 9% for all analytes. No laboratory contamination was observed in method blanks.
Table 2.
Concentrations and estimated annual loads of perfluoroalkyl substances in biosolids collected in 2001
| Compounds | CAS # | Matrix spike recovery (%) |
Biosolids concentration (ng/g) Avg. (Min, Max) |
RPD (%) |
Frequency detected (%) |
Estimated annual PFCs load (kg/year) (Min–Max)a |
||||
|---|---|---|---|---|---|---|---|---|---|---|
| Blind duplicates |
Non-blinded duplicates |
Biosolids | To land application |
To landfills | To incineration | |||||
| Perfluorobutanoate (PFBA) | 375-22-4 | 99.7 | 2 (1.2, 3.2) | 51.6 | – | 80 | 10–12.5 | 5–7.5 | 1.7–2.1 | 2–2.5 |
| Perfluoropentanoate (PFPeA) | 2706-90-3 | 99.1 | 3.5 (1.8, 6.7) | 23.6 | 2.3 | 100 | 17.7–22.2 | 8.8–13.3 | 3–3.8 | 3.5–4.4 |
| Perfluorohexanoate (PFHxA) | 307-24-4 | 107 | 6.2 (2.5, 11.7) | 4.2 | 16.7 | 100 | 31.8–39.9 | 15.9–23.9 | 5.4–6.8 | 6.4–8 |
| Perfluoroheptanoate (PFHpA) | 375-85-9 | 104 | 3.4 (1.2, 5.4) | 8.3 | – | 80 | 17.4–21.8 | 8.7–13.1 | 3–3.7 | 3.5–4.4 |
| Perfluorooctanoate (PFOA) | 335-67-1 | 103 | 34 (11.8, 70.3) | 13.4 | 12.2 | 100 | 172–215 | 85.8–129 | 29.3–36.6 | 34.3–43.1 |
| Perfluorononanoate (PFNA) | 375-95-1 | 92.4 | 9.2 (3.2, 21.1) | 7.9 | 14.3 | 100 | 47.2–59.1 | 23.5–35.5 | 8–10 | 9.4–11.8 |
| Perfluorodecanoate (PFDA) | 335-76-2 | 98.9 | 26.1 (6.9, 59.1) | 6.6 | 12.6 | 100 | 133–167 | 66.6–100 | 22.7–28.4 | 26.7–33.4 |
| Perfluoroundecanoate (PFUnDA) | 2058-94-8 | 74.6 | 11.7 (2.8, 38.7) | 6.6 | 2.4 | 100 | 59.9–69.7 | 29.9–45.1 | 10.2–12.8 | 12–15 |
| Perfluorododecanoate (PFDoDA) | 307-55-1 | 95.4 | 10.9 (4.5, 26) | 6.7 | 6.4 | 100 | 55.6–69.7 | 27.8–41.8 | 9.4–11.9 | 11.1–13.9 |
| Perfluorobutanesulfonate (PFBS) | 45187-15-3 | 110 | 3.4 (2.5, 4.8) | 20.8 | – | 60 | 17.6–22 | 8.8–13.2 | 3–3.7 | 3.5–4.4 |
| Perfluorohexanesulfonate (PFHxS) | 108427-53-8 | 97.8 | 5.9 (5.3, 6.6) | 7.4 | 5.4 | 100 | 29.9–37.5 | 15–22.5 | 5.1–6.4 | 6–7.5 |
| Perfluorooctanesulfonate (PFOS) | 45298-90-6 | 96.9 | 403 (308, 618) | 11.9 | 15.7 | 100 | 2052–2575 | 1026–1545 | 349–438 | 410–515 |
| Perfluorooctane sulfonamide (PFOSA) | 754-91-6 | 75.3 | 20.7 (2.2, 68.1) | 19.2 | 20.2 | 100 | 105–132 | 52.7–79.3 | 17.9–22.5 | 21.1–26.4 |
3.2. Study limitations
A large number of biosolids samples were combined to form five composites in this study in order to reduce the number of samples to be analyzed and still provide with a defensible mean baseline concentration for the analytes. However, the mixing of samples is not well suited to capture the variation in concentrations of the individual analytes as a function of geographic location, treatment processes, population served etc. It is also possible for minor contaminants to become diluted during mixing. Hence the reported PFASs concentrations and detection frequencies are conservative. While this approach cannot determine the variability of concentrations between the large numbers of WWTPs studied, it is suitable for identifying major PFASs contaminants and determining their average concentrations in U.S. biosolids. Extrapolation of these average concentrations to total sewage sludge production in the U.S. carries potential risks. For example, if the plants selected by the U.S. EPA are not representative of all plants across the nation, estimates for the annual load or each PFAS could be skewed. However, the National Sewage Sludge Survey conducted by U.S. EPA is by far the most comprehensive survey on U.S. sewage sludges, as it contains 94 samples from 32 U.S. States and the District of Columbia. Given the large number of samples analyzed and their selection by the government agency on the basis of providing good representation of the more than 16,000 WWTPs in the U.S. nationwide, the obtained estimates are expected to carry only a small and acceptable level of uncertainty. The fact that a survey of these compounds has never taken place before at this scale in the U.S. or any other country in the world, makes the analytical results and loading estimates reported here a valuable contribution to the current understanding of the occurrence and fate of PFASs in the built environment of the United States.
3.3. Nationwide occurrence of PFASs in U.S. biosolids
Ten out of thirteen PFASs analyzed were consistently detected in all composite biosolids samples except for PFBA, PFHpA, and PFBS (Table 2). The most abundant PFAS in biosolids was PFOS, detected at a concentration of 403 ± 127 ng/g dw, followed by PFOA (34 ± 22 ng/g dw). The remaining eleven PFASs ranged between 2 and 26 ng/g (Table 2) and the mean total concentration of PFASs (ΣPFAS) detected in the five composite samples was 539 ± 224 ng/g dw. The levels detected in U.S. biosolids are more than an order of magnitude higher than levels detected in sewage sludge samples collected from Spain and Germany [35]. For comparison purposes, the national baseline levels of PFASs detected in this study were plotted with levels reported in other studies for sludge samples collected from U.S. WWTPs (Fig. 1). It must be noted that the concentrations reported in the present study represent samples collected at 94 WWTPs from across the U.S., whereas previously reported values were limited to specific study locations and a maximum of 11 WWTPs. The levels of PFASs from other studies plotted in Fig. 1 are for sludge samples collected in the U.S. between 2004 and 2007 (except for one in 1998). Whereas, the biosolids samples analyzed in this study were collected by U.S. EPA between February and March 2001, which was during the phase out period of PFOS and perfluorooctanesulfonyl fluoride (POSF) related products by the 3M Company between 2000 and 2002. PFAS emission during manufacturing process has reduced since then in the U.S. [36] and hence their current concentrations in biosolids are expected to be lower. However, interestingly the mean concentration of PFASs detected in this study were not significantly different (p > 0.05) to concentrations reported in sludge samples collected between 2004 and 2007 (except for one collected in 1998) in U.S., years after 3M discontinued its industrial production of PFOS and related compounds. A similar observation was also reported for PFAS levels in human serum samples during the 2003–2004 NHANES survey [2]. The survey reported the prevalence of PFASs in more than 98% of the people analyzed even after the phase-out in production by 3M. Even though the current producers are committed to reducing emissions of PFASs, it is suggested that there still exist other direct and indirect sources of PFASs in the U.S. [2].
Fig. 1.
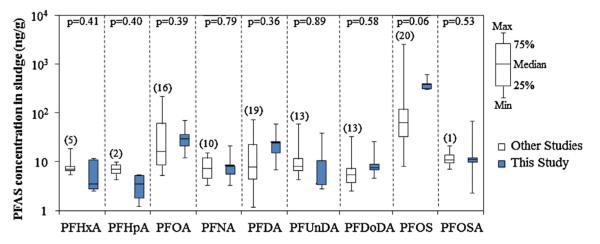
Comparison of PFASs concentrations in U.S. sludge reported in other studies with levels detected in the present work. Values in parentheses represent the total number of wastewater treatment plants sampled for the particular analyte in other studies [20–22,37,38]. The p-values indicate lack of statistically significant differences between the paired datasets evaluated.
3.4. Annual loading of PFASs to U.S. biosolids and agricultural land
Based on the estimated biosolids production of 5.1–6.4 million metric tonnes (5.6–7 million U.S. tonnes) in the year 2001 [32–34], the nationwide annual loading rates to biosolids for various PFASs were calculated (Table 2). The estimated mean loading rate of ΣPFAS was 2749–3450 kg/year, with the most abundant compound being PFOS with a rate of 2052–2575 kg/year, followed by PFOA and PFDA at 172–215 and 133–167 kg/year, respectively. However, these loadings are significantly lower when compared to other major contaminants in biosolids, such as antimicrobials (triclocarban and triclosan) and non-ionic surfactants (nonylphenol and their ethoxylates), whose loading in biosolids had been determined in previous studies [25,27] (Fig. 2). The higher loading for the antimicrobials and surfactants may be explained by their high production volumes of greater than 1 million pounds per year in the U.S. and their disposal, which differs from ΣPFAS in that, they are almost exclusively discharged into wastewater by design.
Fig. 2.
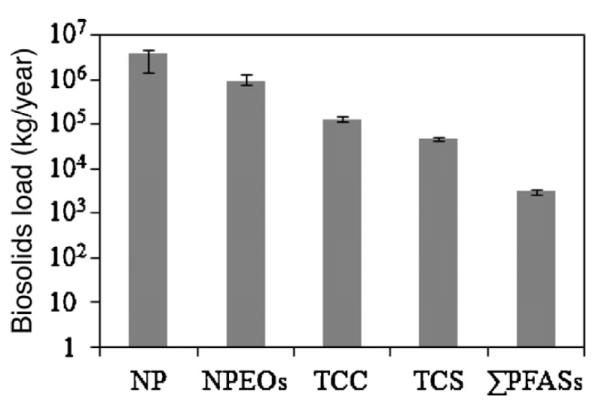
Comparison of 2001 annual loads of emerging contaminants in U.S. biosolids. NP – nonylphenol; NPEOs – nonylphenol mono- and di-ethoxylates; TCC – triclocarban; TCS – triclosan; ΣPFASs – total perfluoroalkyl substances detected in this study. Error bars represent minima and maxima.
Based on the estimated percentage of total biosolids applied on land (50–60%) [32–34], the mean loading rate of ΣPFAS to agricultural soil was found to be 1375–2070kg/year. A significant amount ΣPFAS (467–587 kg/year) was also estimated to go to landfills as an alternative disposal route for unwanted biosolids (Table 2). In many instances the leachate collected from landfills is sent back to the local WWTP and is thus re-incorporated into the sludge/liquid waste stream. As shown in the previous section, there is no significant change in PFASs levels in biosolids samples collected in the year 2001 and years 2004–2007. Hence one can expect a similar annual loading to soils in the following years, resulting in a net accumulation of these compounds in U.S. soils. These numbers should be viewed as conservative estimates, since only a selected number of PFASs were included in this study.
4. Conclusion
The nationwide concentrations of PFASs in U.S. biosolids provided in this study serves to inform both human exposure risk assessments and regulatory requirements for these recalcitrant chemicals. Although there were efforts in phasing out PFOS and related compounds from production beginning in the year 2002, a comparison of concentrations detected in samples collected in 2001 (this study) and in years 2004–2007 showed no noticeable differences. This suggests that the U.S. may have to consider regulations similar to those instituted in European countries, where PFOS and related compounds were banned from several uses. The significant loading to U.S. soils estimated in the present study further increases concern about groundwater and surface water contamination, as reported in previous investigations by others [19,22]. This study further demonstrated the use of mega composite samples for determining national and regional mean concentrations of major contaminants in sewage sludge in a scientifically sounds, yet economically attractive fashion.
Supplementary Material
HIGHLIGHTS.
First study to report nationwide occurrence and concentrations of perfluoroalkyl substances (PFAS) in U.S. biosolids.
Ten out of thirteen PFAS analyzed were consistently detected in all biosolids samples.
PFOS was the most abundant PFAS in biosolids, followed by PFOA.
Mean load of ΣPFASs in U.S. biosolids was estimated at 2749–3450 kg/year.
PFASs in biosolids show no significant difference between pre- and post-phase out period.
Acknowledgements
We thank Rick Stevens, Harry B. McCarty and the U.S. EPA for providing the biosolids samples from the 2001 National Sewage Sludge Survey. We would like to acknowledge the laboratory staff of AXYS Analytical Services Ltd. for performing chemical analyses. This study was supported in part by the Johns Hopkins Center for a Livable Future and by National Institute of Environmental Health Sciences grant 1R01ES015445 and its supplements. The content of this work is solely the responsibility of the authors and does not necessarily represent the official views of the NIEHS or the National Institutes of Health (NIH).
References
- [1].Kannan K. Perfluoroalkyl and polyfluoroalkyl substances: current and future perspectives. Environ. Chem. 2011;8:333–338. [Google Scholar]
- [2].Calafat AM, Wong LY, Kuklenyik Z, Reidy JA, Needham LL. Polyfluoroalkyl chemicals in the US population: data from the National Health and Nutrition Examination Survey (NHANES) 2003–2004 and comparisons with NHANES 1999–2000. Environ. Health Perspect. 2007;115:1596–1602. doi: 10.1289/ehp.10598. [DOI] [PMC free article] [PubMed] [Google Scholar]
- [3].Kannan K, Corsolini S, Falandysz J, Fillmann G, Kumar KS, Loganathan BG, Mohd MA, Olivero O. Jesus, Van Wouwe N, Yang JH. Perfluorooctanesulfonate and related fluorochemicals in human blood from several countries. Environ. Sci. Technol. 2004;38:4489–4495. doi: 10.1021/es0493446. [DOI] [PubMed] [Google Scholar]
- [4].Taniyasu S, Kannan K, Horii Y, Hanari N, Yamashita N. A survey of perfluorooctane sulfonate and related perfluorinated organic compounds in water, fish, birds, and humans from Japan. Environ. Sci. Technol. 2003;37:2634–2639. doi: 10.1021/es0303440. [DOI] [PubMed] [Google Scholar]
- [5].Martin JW, Smithwick MM, Braune BM, Hoekstra PF, Muir DCG, Mabury SA. Identification of long-chain perfluorinated acids in biota from the Canadian Arctic. Environ. Sci. Technol. 2004;38:373–380. doi: 10.1021/es034727+. [DOI] [PubMed] [Google Scholar]
- [6].Gosetti F, Chiuminatto U, Zampieri D, Mazzucco E, Robotti E, Calabrese G, Gennaro MC, Marengo E. Determination of perfluorochemicals in biological, environmental and food samples by an automated on-line solid phase extraction ultra high performance liquid chromatography tandem mass spectrometry method. J. Chromatogr. A. 2010;1217:7864–7872. doi: 10.1016/j.chroma.2010.10.049. [DOI] [PubMed] [Google Scholar]
- [7].Houde M, De Silva AO, Muir DCG, Letcher RJ. Monitoring of perfluorinated compounds in aquatic biota: an updated review. Environ. Sci. Technol. 2011:7962–7973. doi: 10.1021/es104326w. [DOI] [PubMed] [Google Scholar]
- [8].Giesy JP, Kannan K. Global distribution of perfluorooctane sulfonate in wildlife. Environ. Sci. Technol. 2001;35:1339–1342. doi: 10.1021/es001834k. [DOI] [PubMed] [Google Scholar]
- [9].Kannan K, Franson JC, Bowerman WW, Hansen KJ, Jones PD, Giesy JP. Perfluorooctane sulfonate in fish-eating water birds including bald eagles and albatrosses. Environ. Sci. Technol. 2001;35:3065–3070. doi: 10.1021/es001935i. [DOI] [PubMed] [Google Scholar]
- [10].Kannan K, Yun SH, Evans TJ. Chlorinated, brominated, and perfluorinated contaminants in livers of polar bears from Alaska. Environ. Sci. Technol. 2005;39:9057–9063. doi: 10.1021/es051850n. [DOI] [PubMed] [Google Scholar]
- [11].Lau C, Thibodeaux JR, Hanson RG, Rogers JM, Grey BE, Stanton ME, Butenhoff JL, Stevenson LA. Exposure to perfluorooctane sulfonate during pregnancy in rat and mouse. II. Postnatal evaluation. Toxicol. Sci. 2003;74:382–392. doi: 10.1093/toxsci/kfg122. [DOI] [PubMed] [Google Scholar]
- [12].Lau C, Thibodeaux JR, Hanson RG, Narotsky MG, Rogers JM, Lindstrom AB, Strynar MJ. Effects of perfluorooctanoic acid exposure during pregnancy in the mouse. Toxicol. Sci. 2006;90:510–518. doi: 10.1093/toxsci/kfj105. [DOI] [PubMed] [Google Scholar]
- [13].Biegel LB, Hurtt ME, Frame SR, O’Connor JC, Cook JC. Mechanisms of extrahepatic tumor induction by peroxisome proliferators in male CD rats. Toxicol. Sci. 2001;60:44–55. doi: 10.1093/toxsci/60.1.44. [DOI] [PubMed] [Google Scholar]
- [14].Inoue K, Okada F, Ito R, Kato S, Sasaki S, Nakajima S, Uno A, Saijo Y, Sata F, Yoshimura Y. Perfluorooctane sulfonate (PFOS) and related perfluorinated compounds in human maternal and cord blood samples: assessment of PFOS exposure in a susceptible population during pregnancy. Environ. Health Perspect. 2004;112:1204–1207. doi: 10.1289/ehp.6864. [DOI] [PMC free article] [PubMed] [Google Scholar]
- [15].Kim SK, Lee KT, Kang CS, Tao L, Kannan K, Kim KR, Kim CK, Lee JS, Park PS, Yoo YW. Distribution of perfluorochemicals between sera and milk from the same mothers and implications for prenatal and postnatal exposures. Environ. Pollut. 2011;159:169–174. doi: 10.1016/j.envpol.2010.09.008. [DOI] [PubMed] [Google Scholar]
- [16].Apelberg BJ, Witter FR, Herbstman JB, Calafat AM, Halden RU, Needham LL, Goldman LR. Cord serum concentrations of perfluorooctane sulfonate (PFOS) and perfluorooctanoate (PFOA) in relation to weight and size at birth. Environ. Health Perspect. 2007;115:1670–1676. doi: 10.1289/ehp.10334. [DOI] [PMC free article] [PubMed] [Google Scholar]
- [17].Frisbee SJ, Shankar A, Knox SS, Steenland K, Savitz DA, Fletcher T, Ducatman AM. Perfluorooctanoic acid, perfluorooctanesulfonate, and serum lipids in children and adolescents: results from the C8 Health Project. Arch. Pediatr. Adolesc. Med. 2010;164:860–869. doi: 10.1001/archpediatrics.2010.163. [DOI] [PMC free article] [PubMed] [Google Scholar]
- [18].Clarke BO, Smith SR. Review of ‘emerging’ organic contaminants in biosolids and assessment of international research priorities for the agricultural use of biosolids. Environ. Int. 2011;37:226–247. doi: 10.1016/j.envint.2010.06.004. [DOI] [PubMed] [Google Scholar]
- [19].Lindstrom AB, Strynar MJ, Delinsky AD, Nakayama SF, McMillan L, Libelo EL, Neill M, Thomas L. Application of WWTP biosolids and resulting perfluorinated compound contamination of surface and well water in Decatur, Alabama, USA. Environ. Sci. Technol. 2011;45:8015–8021. doi: 10.1021/es1039425. [DOI] [PubMed] [Google Scholar]
- [20].Sinclair E, Kannan K. Mass loading and fate of perfluoroalkyl surfactants in wastewater treatment plants. Environ. Sci. Technol. 2006;40:1408–1414. doi: 10.1021/es051798v. [DOI] [PubMed] [Google Scholar]
- [21].Loganathan BG, Sajwan KS, Sinclair E, Kumar K. Senthil, Kannan K. Perfluoroalkyl sulfonates and perfluorocarboxylates in two wastewater treatment facilities in Kentucky and Georgia. Water Res. 2007;41:4611–4620. doi: 10.1016/j.watres.2007.06.045. [DOI] [PubMed] [Google Scholar]
- [22].Sepulvado JG, Blaine AC, Hundal LS, Higgins CP. Occurrence and fate of perfluorochemicals in soil following the land application of municipal biosolids. Environ. Sci. Technol. 2011;45:7350–7357. doi: 10.1021/es103903d. [DOI] [PubMed] [Google Scholar]
- [23].Schultz MM, Higgins CP, Huset CA, Luthy RG, Barofsky DF, Jennifer A. Fluorochemical mass flows in a municipal wastewater treatment facility. Environ. Sci. Technol. 2006;40:7350–7357. doi: 10.1021/es061025m. [DOI] [PMC free article] [PubMed] [Google Scholar]
- [24].U.S. Environmental Protection Agency Targeted National Sewage Sludge Survey Overview Report. 2009. Jan; EPA-822-R-08-014: http://water.epa.gov/scitech/wastetech/biosolids/tnsss-overview.cfm.
- [25].Venkatesan AK, Halden RU. National inventory of alkylphenol ethoxylate compounds in US sewage sludges and chemical fate in outdoor soil mesocosms. Environ. Pollut. 2013;174:189–193. doi: 10.1016/j.envpol.2012.11.012. [DOI] [PMC free article] [PubMed] [Google Scholar]
- [26].Chari BP, Halden RU. Validation of mega composite sampling and nationwide mass inventories for 26 previously unmonitored contaminants in archived biosolids from the US National Biosolids Repository. Water Res. 2012;46:4814–4824. doi: 10.1016/j.watres.2012.06.017. [DOI] [PMC free article] [PubMed] [Google Scholar]
- [27].McClellan K, Halden RU. Pharmaceuticals and personal care products in archived US biosolids from the 2001 EPA national sewage sludge survey. Water Res. 2010;44:658–668. doi: 10.1016/j.watres.2009.12.032. [DOI] [PMC free article] [PubMed] [Google Scholar]
- [28].U.S. Environmental Protection Agency . Sampling Procedures for the 2001 National Sewage Sludge Survey. Office of Science and Technology; Washington, DC: 2001. [Google Scholar]
- [29].U.S. Environmental Protection Agency . Sampling Procedures and Protocols for the National Sewage Sludge Survey. Office of Water Regulations and Standards, Industrial Technology Division; Washington, DC: Aug, 1988. [Google Scholar]
- [30].Myers AL, Crozier PW, Helm PA, Brimacombe C, Furdui VI, Reiner EJ, Burniston D, Marvin CH. Fate, distribution, and contrasting temporal trends of perfluoroalkyl substances (PFASs) in Lake Ontario, Canada. Environ. Int. 2012;44:92–99. doi: 10.1016/j.envint.2012.02.002. [DOI] [PubMed] [Google Scholar]
- [31].Kelly BC, Ikonomou MG, Blair JD, Surridge B, Hoover D, Grace R, Gobas FAPC. Perfluoroalkyl contaminants in an arctic marine food web: trophic magnification and wildlife exposure. Environ. Sci. Technol. 2009;43:4037–4043. doi: 10.1021/es9003894. [DOI] [PubMed] [Google Scholar]
- [32].North East Biosolids Residuals Association (NEBRA) A National Biosolids Regulation, Quality, End Use & Disposal Survey. 2007 http://www.nebiosolids.org/uploads/pdf/NtlBiosolidsReport-20July07.pdf.
- [33].Jones-Lepp T, Stevens R. Pharmaceuticals and personal care products in biosolids/sewage sludge: the interface between analytical chemistry and regulation. Anal. Bioanal. Chem. 2007;387:1173–1183. doi: 10.1007/s00216-006-0942-z. [DOI] [PubMed] [Google Scholar]
- [34].National Research Council (US) Committee on Toxicants, Pathogens in Biosolids Applied to Land, Biosolids Applied to Land: Advancing Standards and Practices. Natl Academy Pr. 2002 [Google Scholar]
- [35].Gómez-Canela C, Barth JAC, Lacorte S. Occurrence and fate of perfluorinated compounds in sewage sludge from Spain and Germany. Environ. Sci. Pollut. Res. 2012;19:4109–4119. doi: 10.1007/s11356-012-1078-7. [DOI] [PubMed] [Google Scholar]
- [36].Prevedouros K, Cousins IT, Buck RC, Korzeniowski SH. Sources, fate and transport of perfluorocarboxylates. Environ. Sci. Technol. 2006;40:32–44. doi: 10.1021/es0512475. [DOI] [PubMed] [Google Scholar]
- [37].Higgins CP, Jennifer A, Criddle CS, Luthy RG. Quantitative determination of perfluorochemicals in sediments and domestic sludge. Environ. Sci. Technol. 2005;39:3946–3956. doi: 10.1021/es048245p. [DOI] [PubMed] [Google Scholar]
- [38].Yoo H, Washington JW, Jenkins TM, Libelo E. Laurence. Analysis of perfluorinated chemicals in sludge: method development and initial results. J. Chromatogr. A. 2009;1216:7831–7839. doi: 10.1016/j.chroma.2009.09.051. [DOI] [PubMed] [Google Scholar]
Associated Data
This section collects any data citations, data availability statements, or supplementary materials included in this article.