

Abstract
Altered fetal environments, such as a high-fat milieu, induce metabolic abnormalities in offspring. Different postnatal environments reveal the predisposition for adult diseases that occur during the fetal period. This study investigates the ability of a maternal high-fat diet (HFD) to program metabolic responses to HFD reexposure in offspring after consuming normal chow for 23 weeks after weaning. Wild-type CD1 females were fed a HFD (H) or control (C) chow during pregnancy and lactation. At 26 weeks of age, offspring were either reexposed (H-C-H) or newly exposed (C-C-H) to the HFD for 19 weeks. Body weight was measured weekly, and glucose and insulin tolerance were measured after 10 and 18 weeks on the HFD. The metabolic profile of offspring on a HFD or C diet during pregnancy and lactation and weaned onto a low-fat diet was similar at 26 weeks. H-C-H offspring gained more weight and developed larger adipocytes after being reintroduced to the HFD later in life than C-C-H. H-C-H mice were glucose and insulin intolerant and showed reduced gene expression of cox6a2 and atp5i in muscle, indicating mitochondrial dysfunction. In adipocytes, the expression of slc2a4, srebf1, and adipoq genes was decreased in H-C-H mice compared with C-C-C, indicating insulin resistance. H-C-H showed extensive hepatosteatosis, accompanied by increased gene expression for cd36 and serpin1, compared with C-C-H. Perinatal exposure to a HFD programs a more deleterious response to a HFD challenge later in life even after an interval of normal diet in mice.
Many studies have shown that the intrauterine environment has a fundamental impact on fetal development with subsequent consequences on the onset of diseases in adulthood (1–3). Maternal undernutrition during pregnancy (IU) influences glucose metabolism and leads to decreased glucose tolerance in adulthood in humans (4). In addition, animal studies have revealed the impact of maternal caloric (5) and protein restriction (6) as well as the effects of a high-caloric diet (2) on the development of adult diseases. Undernutrition and overnutrition during IU have been shown to alter glucose and lipid homeostasis in offspring later in life.
In industrialized countries, overnutrition likely plays a dominant role in the origin of metabolic diseases. A diet high in calories from excess fat is commonly used to mimic Western societies' eating habits (7). Studies in mice have investigated the impact of a high-fat diet (HFD) on disease development when the diet was applied during IU and lactation (L). In mice, offspring of dams exposed to a HFD during IU and L and weaned onto a standard chow exhibited many features of the metabolic syndrome (3). In these studies, mice developed hypercholesterolemia at the age of 11 weeks (8), adiposity at the age of 3 months, insulin resistance and hypertension at the age of 6 months (9), and hepatosteatosis at the age of 3 months (10).
A study in adult men suggests that “catch-up” growth is associated with an increased risk for developing the metabolic syndrome (11). We recently demonstrated that male mice exposed to HFD IU + L were born small for gestational age and exhibited catch-up growth (12). Subsequently, the HFD IU + L mice weaned onto a standard low-fat chow also exhibited increased adiposity and impaired glucose tolerance and insulin sensitivity compared with offspring of wild-type (WT) dams on a control (C) diet. In this study, CD1 WT dams and glucose transporter 4 heterozygote (GLUT4+/−) males, a genetic model of peripheral insulin resistance (13), were used to generate the WT male offspring.
The postweaning diet also appears to play an important role in determining the phenotypic manifestation of the programming brought about by exposure to HFD during IU and L. Mice continuously exposed to a HFD throughout IU into early adulthood developed increased adiposity, hypercholesterolemia, and hepatosteatosis (14) compared with mice exposed to this diet only during the postweaning period. In a model of protein restriction throughout IU and L, offspring developed hypertension and hepatosteatosis when exposed to a “second hit” HFD postweaning diet for 6 months as compared with those exposed to a standard chow (15).
The “Barker hypothesis,” also known as the “fetal origin of adult disease hypothesis,” postulates that the determination of adult diseases occurs during fetal development due to adverse changes of the intrauterine milieu (16). A more detailed understanding of the hypothesis of the developmental origin of disease encompasses the effect of the intrauterine environment on the offspring's response to different postnatal diets (17, 18). Considering the results of recent animal studies, and the fact that many populations have access to obesogenic diets, we expanded our study of a HFD applied during IU and L and conducted a “2-hit” study. This study evaluated offspring exposed to a maternal HFD during IU and L (“first hit”) that were reexposed to a HFD after an interval of 23 weeks on a regular chow (“second hit”). The 2-hit regime was used to uncover programming effects that remain silent during the phase of consuming a regular postnatal diet but may become evident upon reexposure to a HFD. After reexposure to a HFD, offspring exposed to HFD during IU and L exhibited significant metabolic disturbances compared with offspring exposed to a C diet during IU and L. The results of this study show that in this CD1 mouse model, the intrauterine developmental milieu brought about by a maternal HFD results in a more pronounced deleterious response to a postnatal HFD introduced later in life.
Materials and Methods
Animals and experimental design
Animals were housed in a barrier facility and maintained on a 14-hour light, 10-hour dark cycle with ad libitum access to chow and water. Age- and body weight (BW)-matched WT female mice (CD1 background) were maintained on PicoLab Mouse Control Breeding Diet no. 5058 (CIU: 9% fat as soybean oil and animal fat, 20% protein, and 53% carbohydrate; 3.59 kcal/g) (LabDiet, St Louis, Missouri) or a high-fat Bio-Serv Product no. F3282 (HFIU: 35.5% fat as lard, 20% protein, and 36.3% carbohydrate; 5.29 kcal/g) (BioServ, Frenchtown, New Jersey) 2 weeks before mating, throughout pregnancy and L. Animals were mated to WT CD1 males. Pregnancy was confirmed by detection of a copulatory plug and defined as embryonic day 0.5. Male offspring were weaned onto PicoLab Mouse Diet no. 5053 (C, low-fat diet: 4.5% fat as soybean oil, 20% protein, and 54.8% carbohydrate; 3.4 kcal/g) (LabDiet) at postnatal day 21 and kept on this diet for adolescence and early adulthood until the age of 26 weeks. At the age of 26 weeks, mice were age- and BW-matched and either reexposed to the same HFD as during IU and L (H-C-H) or newly introduced to the HFD (C-C-H) for 19 weeks until the age of 45 weeks. A cohort of mice exposed to Control Breeding Diet during IU and L and kept on regular diet after weaning until killing at 45 weeks of age was kept as a control group (C-C-C). The second hit of the HFD was applied between early adulthood (26 wk old) and the middle age (45 wk of age) phase of mice. The study was terminated before mice reached 12 months of age to avoid aging effects. A schematic of the study design is illustrated in Figure 1. Mice were killed using cervical dislocation, and tissues were harvested. To circumvent the confounding effects of estrogens on adipocytes, only male offspring were selected for this study (19). Additionally, female mice might undergo changes in their hormonal status when their breeding capacity is reduced around the age of 8 months (32 wk) (http://research.jax.org). This could potentially influence metabolism and therefore was another rationale for selecting male offspring, only, because the study was not terminated before mice reached 45 weeks of age. Five mice per group from 2 different litters were used in this study. All experiments were performed sequentially on the same mice. Animal protocols were approved by the Animal Institute at the Albert Einstein College of Medicine.
Figure 1.

Schematic of dietary intervention for the groups investigated from pregnancy to the end of the study at 45 weeks. Experimental procedures are indicated according to the age of the mice. Exposure to either a regular rodent chow (C) or a HFD (H) during IU and L resulted in 3 experimental groups (C-C-C, C-C-H, and H-C-H). The first letter indicates the diet during IU and L, the second letter indicates the diet during the first 23 weeks of life, and the third letter indicates the diet during the last 19 weeks of life.
Serum analysis
Fed-state blood samples were drawn from the orbital sinus between 11 pm and 1 am. Approximately 120 μL of blood were taken at 26, 35, 38, 39, and 43 weeks of age. Blood glucose concentrations were measured using a glucometer (Precision Q.I.D., a gift from Abbott Laboratories, Chicago, Illinois). A second portion of whole blood was centrifuged, and the serum was stored at −80°C. A commercially available kit was used for measuring serum concentrations of insulin (Linco Research, St Charles, Missouri), glycerol and triglycerides (TGs) (Sigma, St Louis, Missouri), nonesterified fatty acids (NEFA) (Wako Chemicals, Neuss, Germany), and lactate (Trinity Biotech, St Louis, Missouri) (12).
Intraperitoneal insulin tolerance test (ITT) and glucose tolerance test (GTT)
For GTTs, overnight fasted mice received an ip injection of D-(+)-glucose (1.5-g/kg BW) after 9 weeks of reexposing with HFD (35 wk of age) (12). For ITTs, the same mice received an ip injection of insulin (0.75-U/kg BW) (Humalog, Lilly, Indianapolis, Indiana) after 6 hours of fasting after 17 weeks of reexposing with HFD (43 wk of age) as previously described (12). Blood was collected from the tail vein, and glucose levels were determined at the indicated times using a glucometer (Precision Q.I.D.). For both, GTT and ITT, glucose concentrations were plotted over time and expressed as a percentage of 0 minutes. Additionally, the total area under the curve (AUC) for 90 minutes (AUC 90 min) for glucose concentrations in milligrams per deciliter was calculated.
BW and body composition
BW was taken weekly for the first 7 weeks of life and at week 17, 21, and 26 of life. After exposing mice to the HFD at week 26, BW was taken weekly until killing. BW was measured at 9 am on the same day of the week. Body composition (% body fat) and lean mass (% lean mass) (n = 3–5 per group) were determined in conscious mice by magnetic resonance spectroscopy using an ECHO magnetic resonance spectroscopy instrument (Echo Medical Systems, Houston, Texas) (20). Body composition was taken before changing the diet (26 wk of age) and at killing (45 wk of age).
Quantitative real-time PCR analysis
mRNA expression analysis was performed using quantitative real-time PCR on epididymal white adipose tissue, gastrocnemius muscle, and liver as previously described (21). Gene expression analysis was performed in adipose tissue for glucose transport (slc2a4), lipid metabolism (srebf1, pln1, pparg, and lpl), adipokines (adipoq, retn, and lep), and inflammatory markers (il6, ccl2, tnf, and emr1); in muscle for glucose transport (slc2a1 and slc2a4), fatty acid transport (cd36), transcription factors (ppard and ppargc1a), insulin resistance (scd1 and dgat1), mitochondrial markers (cox6a2 and atp5i), and inflammatory markers (serpin1 and tnf); and in liver for glucose transport (slc2a2), fatty acid transport (cd36, slc27a2, and slc27a5), transcription factors (ppara, cpt1a, srebf1, and mlxip), fatty acid synthesis (fas), gluconeogenesis (g6pc), and inflammatory markers (serpin1 and il6). Primers were designed using Primer Express software (Applied Biosystems, Foster City, California). Primer sequences are listed in Supplemental Table 1, published on The Endocrine Society's Journals Online web site at http://endo.endojournals.org. Data are expressed relative to the C-C-C group. The constitutively expressed genes ubiquitin or cyclophilin B were used as loading controls.
Histology
White adipose tissue and liver were fixed in 10% buffered formalin, embedded in paraffin, sectioned at 5 μm, and stained with hematoxylin and eosin. Adipocyte size was measured using SPOT Advance and ImageJ software (http://rsbweb.nih.gov/ij/) according to a modified method described previously (22). In epididymal fat, 3 different areas with 75 adipocytes in each area per mouse were analyzed in 3 mice per group. Average adipocyte size per animal was subsequently calculated.
Sections of mouse liver tissue were stained with hematoxylin and eosin, Gomori, and periodic acid-Schiff with diastase digestion (PAS-D) using standard protocols. To address the extent of hepatic steatosis, liver sections were graded based on a modified semiquantitative scoring system (23): 0 = normal (parenchymal involvement of steatosis <5%); 1 = mild (5%–20%); 2 = moderate (>20%–50%); and 3 = severe (>50%). Steatosis grading included macrovesicular steatosis, characterized by large fat vacuoles pushing nuclei of hepatocytes to the periphery, as well as microvesicular steatosis, characterized by small fat vacuoles with hepatocyte nuclei remaining central (23). Localization of steatosis was also examined: zone 3, perivenular zone; and zone 1, periportal zone. Lobular inflammation was scored based on the number of inflammatory foci per 10 high-power fields (HPFs): 0 = 0 per 10 HPF, 1 = 1–2 per 10 HPF, 2 = more than 2 per 10 HPF. Sections were evaluated by a pathologist who was blind to sample identity.
Data analysis
Data represents the mean ± SEM. Statistical analyses were performed using IBM SPSS Statistics 20 software (IBM Corp, Armonk, New York). The combination of the intra uterine diet and the diet applied in adulthood was considered a fixed factor resulting in the 3 experimental groups. BW, serum parameters, ITT and GTT experiments, and real-time PCR results were analyzed by Kruskal-Wallis test with Bonferroni post hoc tests. Experimental results were considered significant when P < .05.
Results
BW and body composition
Observations from our previous studies (12) showed that WT CD1 damns fed a HFD gained more weight and consumed more kilocalories per day during the first half of pregnancy compared with dams on C chow.
Mice exposed to a HFD during IU and L had a slightly smaller BW up to the age of 6 weeks that was significant at 1 and 4 weeks of age (Figure 2A). From 6 weeks on, there was no longer a difference in BW. Along this line, no significant differences were observed in adiposity at the age of 26 weeks (Table 1). After HFD was reintroduced (26 wk of age), H-C-H mice compared with C-C-H mice displayed a significant increase in BW after 12 weeks on the HFD (38 wk of age) (Figure 2B), and this remained significant until the mice were killed after being on the diet for 19 weeks (45 wk of age) (Figure 2B). Increases in BW at 45 weeks of age were reflected of alterations in body composition. At killing, H-C-H mice displayed increased adiposity compared with C-C-H mice (Table 2). H-C-H had the highest ratio of organ weight normalized to lean body mass for epididymal and renal fat depots, liver, and heart compared with C-C-C. Although C-C-H had a trend for an increased ratio for epididymal and renal fat depots and liver compared with C-C-C, this did not achieve significance. There was no significant difference in organ weight normalized to lean body mass for heart between C-C-C and C-C-H and for kidney between all groups. Detailed organ measurements are provided in Supplemental Table 2.
Figure 2.

(A) Growth curve for selected time points of mice exposed to either a C diet (C IU and L, white bars) or a HFD (HF IU and L, black bars) during IU and L. *, P < .05; n = 10 per group. (B) Growth curve of mice exposed to either a C diet (C) or a HFD (H) during IU and L, both weaned onto a standard diet (C) until the age of 26 weeks and then either reexposed to the same HFD (H) or kept on the C diet (C). ‡P < .05 compared with C-C-C; #, P < .05 compared with C-C-H and P < .005 compared with C-C-C; n = 5 per group. White circles, C-C-C; white triangles, C-C-H; black squares, H-C-H.
Table 1.
Adiposity and Metabolites of Offspring Before Reexposure to a HFD
| C diet during IU and L | HFD during IU and L | |
|---|---|---|
| Adiposity (%) | 25.2 ± 2.20 | 23.8 ± 1.37 |
| Glucose (mg/dL) | 140.7 ± 8.43 | 140.3 ± 6.8 |
| Insulin (ng/mL) | 3.95 ± 1.20 | 4.39 ± 0.84 |
| TGs (mg/dL) | 97.33 ± 13.00 | 122.19 ± 13.90 |
| NEFA (μEq/mL) | 1.45 ± 0.09 | 1.62 ± 0.08 |
| Lactate (mg/dL) | 35.40 ± 2.62 | 22.73 ± 2.01a |
| Glycerol (mg/dL) | 33.69 ± 2.62 | 35.77 ± 1.71 |
Adiposity (26 wk of age), fed blood glucose, and serum concentrations of insulin, TGs, NEFA, lactate, and glycerol (21 wk of age) of mice exposed to either a C or HFD during IU and L; n = 10 per group.
P < .005 compared with C diet during IU and L.
Table 2.
Adiposity and Metabolites of Offspring After Exposure/Reexposure to a HFD
| C-C-C | C-C-H | H-C-H | |
|---|---|---|---|
| Adiposity (%) (45 wk of age) | 16.69 ± 4.30 | 29.34 ± 2.79a | 40.44 ± 1.04cd |
| Fasted metabolites (35 wk of age) | |||
| Glucose (mg/dL) | 126 ± 12 | 162 ± 7a | 202 ± 9cd |
| Insulin (ng/mL) | 0.78 ± 0.18 | 1.15 ± 0.44 | 2.28 ± 0.18bd |
| TGs (mg/dL) | 113.32 ± 20.14 | 61.29 ± 6.61a | 65.27 ± 4.29a |
| NEFA (μEq/mL) | 1.86 ± 0.15 | 1.39 ± 0.05 | 1.02 ± 0.08b |
| Lactate (mg/dL) | 19.20 ± 2.04 | 21.98 ± 4.01 | 17.02 ± 1.80 |
| Glycerol (mg/dL) | 35.50 ± 3.15 | 25.32 ± 1.31a | 24.18 ± 1.29a |
| Fed metabolites (39 wk of age) | |||
| Glucose (mg/dL) | 118 ± 8 | 223 ± 43 | 282 ± 54a |
| Insulin (ng/mL) | 7.57 ± 1.88 | 32.16 ± 10.50a | 41.31 ± 6.88a |
| TGs (mg/dL) | 152.31 ± 13.76 | 64.07 ± 7.61 | 79.81 ± 8.03b |
| NEFA (μEq/mL) | 1.21 ± 0.19 | 1.03 ± 0.11 | 1.07 ± 0.13 |
| Lactate (mg/dL) | 42.48 ± 6.01 | 35.04 ± 3.11 | 26.48 ± 1.07a |
| Glycerol (mg/dL) | 30.53 ± 5.10 | 36.34 ± 3.24 | 36.62 ± 2.67 |
Adiposity (at killing, 19 wk on HFD, 45 wk of age), overnight fasted (9 wk on HFD, 35 wk of age), and fed (13 wk on HFD, 39 wk of age) blood glucose levels and serum concentrations of insulin, TG, NEFA, lactate, and glycerol; n = 5 per group.
P < .05 compared with C-C-C.
P < .005 compared with C-C-C.
P < .0005 compared with C-C-C.
P < .05 compared with C-C-H.
Serum parameters
Mice exposed to a HFD during IU and L and control mice did not show a significant difference in fed blood glucose and serum levels of insulin, TGs, NEFA, or glycerol at 21 weeks of age. However, serum lactate levels were significantly reduced in mice exposed to a HFD during IU and L (Table 1). After mice had been reexposed to HFD, mice exposed to a HFD during IU and L (H-C-H) showed a significant elevation in fasted and fed blood glucose and fasted serum insulin levels compared with C-C-C mice after 9 weeks on the diet (35 wk of age) (Table 2). In addition, H-C-H mice showed a significant decrease in fed serum lactate and fasted serum glycerol and NEFA levels compared with C-C-C mice. Both C-C-H and H-C-H mice showed a significant decrease in fasted and fed serum TGs compared with C-C-C mice.
Intraperitoneal GTT and ITT
Peripheral glucose tolerance (Figure 3, A and B) and insulin sensitivity (Figure 3, C and D) were assessed by ip GTT and ITT, respectively. After being reexposed to the HFD for 9 weeks (35 wk of age), H-C-H mice had an increased glucose excursion compared with C-C-C mice, as shown by an increase in the total AUC for glucose (Figure 3A). Interestingly, C-C-H mice showed no significant decrease in glucose disposal compared with C-C-C at this age. However, when normalized to 0 minutes, these differences were no longer apparent, which is likely due to the significantly higher fasting blood glucose of H-C-H and C-C-H compared with C-C-C (Figure 3B). An ITT was performed when mice were reexposed to a HFD for 17 weeks (43 wk of age). Results of this test clearly showed diminished peripheral insulin sensitivity in H-C-H mice compared with C-C-C mice (Figure 3C): H-C-H mice had the highest total AUC for glucose that is significantly different compared with C-C-C but not C-C-H mice. When normalized to 0 minutes, both H-C-H and C-C-H have significantly diminished glucose disposal at the 60-minute time point compared with C-C-C (Figure 3D).
Figure 3.

Intraperitoneal GTT (A and B) and ITT (C and D). A GTT was performed after 9 weeks of reexposing mice to a HFD (35 wk of age), and an ITT was performed after 17 weeks of reexposing mice to a HFD (43 wk of age). Total AUC for glucose in milligrams per deciliter (mg/dL) was calculated for the GTT (A) and the ITT (C). Absolute glucose levels were normalized and expressed as a percentage of 0 minutes for the GTT (B) and the ITT (D). *, P < .05 compared with C-C-C; #, P < .005 compared with C-C-C. White circles, C-C-C; white triangles, C-C-H; black squares, H-C-H.
Quantitative real-time PCR analysis
Quantitative real-time PCR analysis was performed to investigate whether the more severe insulin resistance and glucose intolerance seen in H-C-H mice was accompanied by altered expression of genes associated with lipid metabolism, inflammation, glucose transport, or mitochondrial dysfunction.
In epididymal adipose tissue, glucose transporter 4 (slc2a4), sterol regulatory element-binding protein-1c (srebf1), adiponectin (adipoq), and resistin (retn) gene expression was significantly down-regulated in H-C-H compared with C-C-C adipose tissue with an intermediate level of expression observed in C-C-H adipose tissue (Figure 4A). In C-C-H compared with C-C-C, expression of these genes tended to be down-regulated. Perilipin (plin1) gene expression was significantly down-regulated in H-C-H compared with both C-C-C and C-C-H adipose tissue. In contrast, exposure to HFD in adulthood, independent of IU diet, led to a significant increase in expression of the inflammation markers monocyte chemoattractant protein-1 (ccl2), TNF-α (tnf), and F4/80 (emr1), as well as leptin (lep). No differences in expression of peroxisome proliferator-activated receptor (PPAR)γ2 (pparg), lipoprotein lipase (lpl), and IL-6 (il6) could be measured (data not shown).
Figure 4.

Gene expression levels in epididymal adipose tissue (A), gastrocnemicus muscle (B), and liver (C). Kruskal-Wallis test with Bonferroni post hoc test was used; groups that do not share the same letter are significantly (P < .05) different from each other; n = 5 per group. White bars, C-C-C; striped bars, C-C-H; black bars, H-C-H.
Next, we investigated expression of gene expression in skeletal muscle. H-C-H muscle showed a significant decrease in glucose transporter 1 (slc2a1) gene expression compared with C-C-C and C-C-H, but surprisingly, there was no difference in glucose transporter 4 (slc2a4) expression among the groups (Figure 4B). Expression of plasminogen activator inhibitor-1 (PAI-1) (serpin1) was increased 3.97-fold (P < .05) in H-C-H mice compared with C-C-C mice and showed a trend towards increased expression in C-C-H muscle, although not significant compared with controls. Expression for TNF-α (tnf) was significantly increased in both C-C-H and H-C-H muscle. Only H-C-H muscle showed a significant decrease in expression of the mitochondrial markers (24) cox6a2 and atp5i when compared with C-C-C muscle (2.03- and 2.47-fold reduction, respectively, both P < .05). An intermediate level of expression of these genes, as well as PAI-1 (serpin1), was observed in C-C-H muscle. Both groups that were exposed to a HFD in adulthood showed significant increases in expression of the fatty acid transporter Cluster of Differention 36 (CD36) when compared with C-C-C muscle. Expression of peroxisome proliferator-activated receptor γ coactivator-1α (ppargc1a) was significantly decreased in H-C-H compared with C-C-H muscle and tended to be decreased when compared with C-C-C muscle. There was no difference in expression of stearoyl-Coenzyme A desaturase 1 (scd), PPARδ (ppard), or diacylglycerol O-acyltransferase 1 (dgat1) in muscle in any of the groups studied (data not shown).
In liver, H-C-H mice showed a 4.15-fold increase in CD36 (cd36) and a 4.29-fold increase in PAI-1 (serpin1) expression compared with C-C-C and C-C-H mice (both P < .005) (Figure 4C). Glucose transporter 2 (slc2a2) expression was significantly increased in H-C-H liver compared with C-C-C with an intermediate level of expression observed in C-C-H. Exposure to a HFD in adulthood resulted in increased expression of PPARα (ppara) and carnitine palmitoyltransferase-1α (cpt1a) in C-C-H and H-C-H liver compared with C-C-C. Interestingly, no significant differences in SREBP-1c (srebf1) or fatty acid synthase (fas) were identified in liver among the groups studied. Similarly, no differences in expression of carbohydrate responsive element binding protein (mlxip), glucose-6-phosphatase (g6pc), fatty acid transport protein 2 (slc27a2), FATP5 (slc27a5), or IL-6 (il6) were measured in liver among the groups studied (data not shown).
Adipocyte size
Figure 5 shows the size of adipocytes (Figure 5, A–C) and histograms of the distribution of adipocyte cell sizes (Figure 5, D–F) in epididymal fat depots. Both H-C-H and C-C-H mice showed an increase in the amount of large adipocytes with a small increase in cell size in H-C-H (Figure 5C) compared with C-C-H (Figure 5B). This is represented by H-C-H epididymal adipose tissue showing a more pronounced “right shift” in the bars shown in the histogram for cell size (Figure 5F) compared with C-C-H mice (Figure 5E). The size of adipocytes of C-C-C is shown in Figure 5 A with the corresponding histogram shown in Figure 5D.
Figure 5.
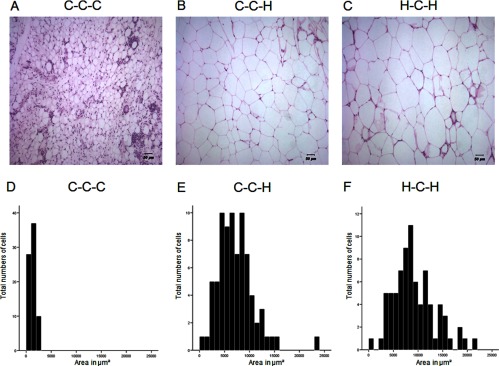
HFD changes the size of adipocytes in epididymal adipose tissue. Hematoxylin and eosin staining (A–C) and distribution of adipocyte size (D–F). Cell size was determined by calculating the mean area of 75 cells in 3 independent areas in the specimen using SPOT Advance and ImageJ software (n = 3 per group). Scale bars represent 50 μm (A–C).
Liver histology
As shown in Figure 6 and Supplemental Table 3, compared with the C-C-C group (median grade, 0) (Figure 6A), the grade of steatosis was significantly higher in C-C-H (median grade, 2; P = .012) (Figure 6B) and H-C-H (median grade, 3; P = .005) (Figure 6C) liver. The change in lipid accumulation in both groups was predominantly localized to the acinar zone 2 and 3 (perivenular) and was largely represented as a microvesicular (small lipid droplets) pattern. However, all H-C-H livers also showed macrovesicular (large lipid droplets) steatosis (arrows in Figure 6D) in the acinar zone 1 (periportal), whereas only 1 out of 5 livers from the C-C-H group displayed macrovesicular steatosis. Although this indicates a difference in the type of steatosis between groups, changes in the steatosis grade did not reach statistical significance (P = .155). However, the HFD-induced steatosis observed in H-C-H livers was associated with more lobular inflammatory foci compared with C-C-H livers (P = .017). Referring to the different types of nonalcoholic fatty liver disease (NAFLD) proposed by Matteoni et al (25), the C-C-H livers showed a type 1 pattern (steatosis), whereas the H-C-H livers exhibited a type 2 pattern (steatosis and inflammation). Although these are still early stages of NAFLD (with no significant fibrosis or hepatocellular ballooning detectable), the findings nevertheless indicate that H-C-H mice are more susceptible to development of nonalcoholic steatohepatitis (nonalcoholic steatohepatitis [NASH], NAFLD type 4).
Figure 6.

Fat accumulation in liver. Hematoxylin and eosin staining (A–D). C-C-C showed normal liver histology (A). HFD induced steatohepatosis in mice fed a C diet during IU and L (C-C-H) (B) and to a greater extent in mice fed a HFD during IU and L (H-C-H) (C) and (D), respectively. H-C-H livers also displayed macrovesicular steatosis (arrows). V, central vein; PF, portal field. Scale bars represent 100 μm (A–C) and 50 μm (D).
Discussion
The main finding of this study is that male offspring after exposure to a maternal HFD during IU and L exhibit a metabolic phenotype characteristic of the metabolic syndrome when reexposed to an obesogenic diet in mature/middle age adulthood. Our results suggest that male offspring are programmed by the hypercaloric HF intrauterine milieu to be more susceptible to the deleterious effects of an adult HFD.
A HFD is commonly used to investigate the impact of overnutrition during the perinatal period, even if mice are less mature at birth compared with humans. The effects on BW gain in HF offspring placed on a C low-fat diet after weaning, however, are controversial and appear to be species, strain, and diet specific. A study conducted in rats showed that a 27% HFD fed to female rats before mating and during IU and L led to a significantly higher BW in male offspring at 12 months of age (26). In contrast, another study in rats found no difference in BW between 3-month-old male offspring of mothers fed either a 59% HFD until birth and C diet (27). However, the ratio between total body fat mass and lean mass was significantly increased. Results obtained in our present study show that male offspring of HFD CD1 mothers do not differ in BW at 26 weeks of age compared with C mice. However, their BW is significantly less than C mice at 4 weeks of age, and they undergo catch-up growth and achieve the same BW as C mice by 6 weeks of age (Figure 2A).
Animal studies revealed that catch-up growth, associated with a mismatch between the perinatal and postweaning diet, is usually seen in cases of poor maternal nutrition that cause low birth weight and induce obesity later in life (28, 29). The reason for a reduced BW during the early postnatal life of rodents exposed to a HFD during IU seen by us and others (30) remains unclear. In our previous mouse study, HFD WT females and GLUT4+/− males, a model of altered peripheral substrate use (13, 31), were mated to produce WT offspring. These offspring, exposed to a HFD during IU and L and a C chow after weaning, exhibit catch-up growth, obesity, and impaired glucose and insulin tolerance despite consuming a normal low-fat chow after weaning (12). In the present study, both the fathers and the mothers were WT CD1 mice. The offspring exposed to a HFD during IU and L showed catch-up growth from 4 to 6 weeks of age similar to the previous study. However, unlike in the previous study that was terminated at 12 weeks of age, no differences in BW were seen among the offspring up to 26 weeks of age (23 wk on the low-fat chow) (Figure 2A). The different offspring outcomes in our 2 studies of WT male offspring, weaned to a C low-fat diet, may be due to the different genetic and metabolic profiles of the WT CD1 fathers used this study and the insulin resistant GLUT4+/− fathers used in the previous study (12). In both studies, the male offspring exposed to a maternal HFD are programmed to develop characteristics of the metabolic syndrome. However, the results of this study show that offspring of WT fathers, with normal insulin sensitivity, require reexposure to a HFD later in life in order to provoke the deleterious effects of their maternal HFD programming. Indeed, recent studies have illustrated the programming effects that paternal nutrition and metabolic status on offspring influences susceptibility to metabolic dysfunction (32, 33).
Even though there was no difference in BW between mice exposed to a HFD during IU and L and control mice at 26 weeks of age, in consideration of our previous study, we hypothesized that offspring exposed to a maternal HFD were “programmed” to respond differently to reexposure to a HFD later in life. Most studies investigate the effects of a HFD during IU and L and during the postweaning period with continuous consumption of HFD throughout the study. However, a time frame where mice are placed on a regular chow is of particular interest in terms of metabolic disease susceptibility because some “programming effects” may become evident only after a stressor (second hit) occurs. As shown in this study, H-C-H mice are programmed to store more of the calories consumed in their adipose tissue when reexposed to a HFD compared with C-C-H mice.
Increased adiposity influences blood glucose and serum insulin levels, which are surrogate markers of impaired glucose metabolism (34). H-C-H mice developed significantly increased fasting glucose and insulin compared with C-C-H and C-C-C mice (Table 2), whereas fed glucose was increased in H-C-H and C-C-H mice compared with C-C-C. This indicates reduced glucose and insulin tolerance in H-C-H mice as also indicated by the GTT and ITT (Figure 3) for total AUC (Figure 3, A and C). However, when blood glucose levels were normalized and expressed as a change from 0 minutes, the differences in GTT were no longer evident, because H-C-H and C-C-H displayed increased fasting blood glucose levels compared with C-C-C mice (Figure 3B and Table 2). Because insulin tolerance decreases with age, we cannot completely rule out partial age effects. In addition, significantly decreased serum lactate levels in H-C-H offspring might also suggest hepatic insulin resistance, because decreased lactate levels have been reported in mice associated with increased gluconeogenesis (35).
H-C-H offspring exhibit increased adiposity and somewhat larger adipocytes compared with C-C-H mice. This could account for the decreased serum TGs seen in H-C-H due to enhanced clearance and storage in enlarged adipocytes (Table 2) (36). The difference in mass and size of the H-C-H adipocytes was also reflected in differences in expression of genes important in adipocyte function. GLUT4, the insulin sensitive glucose transporter, is down-regulated in adipocytes in the state of insulin resistance (31). H-C-H adipocytes exhibited a significant decrease in GLUT4 (slc2a4) mRNA compared with controls (Figure 4A). Adiponectin (adipoq), which is exclusively expressed in adipocytes and is important for insulin signaling in liver (37), and resistin (retn), which paradoxically shows decreased gene expression in obese rodents (38), were significantly down-regulated in H-C-H adipose tissue. Additionally, SREBP-1c (srebf1), an important transcription factor in adipogenesis that is down-regulated in obesity and type 2 diabetes mellitus (39), was down-regulated in H-C-H adipose tissue. Expression of the proinflammatory cytokines monocyte chemoattractant protein-1 (ccl2) and TNF-α and F4/80 (emr1), a marker of macrophage infiltration (40), were significantly up-regulated in C-C-H and H-C-H adipocytes. Overall, these findings suggest adipocytes of H-C-H mice have a gene expression profile programmed by a maternal HFD that results in an altered metabolic response to reexposure to a HFD.
As expected, the livers of mice that consumed HFD accumulated lipids. However, the second hit led to a more severe type of NAFLD in H-C-H compared with C-C-H liver (NAFLD type 2 vs type 1), even though a fully developed NASH was not yet observed. Similar results have been described by Bruce et al (14), whereby offspring exposed to a maternal HFD developed NAFLD. In this study, consumption of a HFD during the first 30 weeks of life was required for the offspring to develop NASH. Combined, these results suggest that offspring exposed to a HFD during IU and L that subsequently consume a HFD at anytime in their lives are more susceptible to develop NASH.
We observed a robust increase in expression of the fatty acid transporter CD36 (cd36) in liver in H-C-H compared with C-C-H mice along with a significant increase in expression of genes of fatty acid oxidation (cpt1a and ppara). However, this compensatory increase in expression of genes of fatty acid oxidation in the H-C-H mice was not able to use the excess fatty acids of the second hit challenge with a HFD at 26 weeks of life, and hepatosteatosis resulted. This development is further supported by the significant increase in expression of PAI-1 (serpin1), an inflammatory marker elevated in hepatic steatosis (41), in H-C-H liver compared with C-C-H and C-C-C. Furthermore, expression of GLUT2 (slc2a2) was significantly increased in H-C-H liver compared with controls. Hepatic GLUT2 expression is up-regulated during conditions of increased gluconeogenesis, insulin resistance, and hepatic steatosis (42). Thus, our data reveal that the H-C-H liver displays an altered programmed metabolic response that is unable to attenuate the deleterious effects of a prolonged HFD challenge later in life.
Expression of the fatty acid transporter CD36 was also significantly increased in C-C-H and H-C-H muscle. This suggests an increase in fatty acids available for oxidation. Fatty acid oxidation occurs in the mitochondria, and cytochrome c oxidase subunits can be used as markers of mitochondrial function (43). We measured the expression of the heart/muscle-specific isoform cox6a2 (43) and ATP synthase isoform atp5i (44) mRNAs, and found that both were significantly decreased in H-C-H compared with C-C-C muscle, suggesting that H-C-H muscle is compromised in its ability to use the excess fat energy contained in the HFD.
In conclusion, we have demonstrated that exposure to a HFD during IU and L programs male offspring to be more vulnerable to the metabolic disturbances brought about by the consumption of a HFD later in life. The H-C-H offspring were unable to offset the deleterious metabolic consequences of a HFD even after an interval of 23 weeks consuming a C low-fat diet. H-C-H offspring gained the most weight, exhibited greater increases in fasting blood glucose and serum insulin and liver TGs, and showed adipocyte and mitochondrial dysfunction. This study uses male mice, because the hormonal status of female mice (estrogens) could potentially interfere with the metabolic profile (19). Because gender differences have been observed in several in utero programming studies (45, 46), future studies should include both male and female offspring in order to define gender-specific responses. The manifestation of adult disease resulting from disturbances in the fetal environment has been linked to underlying changes in the epigenome (47). Our results suggest that in this CD1 mouse model, an altered metabolic program, possibly associated with perinatal epigenetic changes, persists into adulthood and is revealed on resumption of a HFD in adulthood.
Acknowledgments
Present address for M.K.: German Institute of Human Nutrition, Department of Clinical Nutrition, Arthur-Scheunert-Alle 114–116, 14558 Nuthetal, Germany.
Present address for P.M.V.: Cohen's Children Medical Center, Department of Pediatric Endocrinology, 1991 Marcus Avenue, Suite M100, Lake Success, New York 11042.
This work was supported by the National Institutes of Health Grants R21 DK081194 (to M.J.C. and P.M.V.), the Diabetes Research and Training Center Grant P60 DK020541, Epigenomics, Liver, O'Brien Kidney, and Comprehensive Cancer Centers of Albert Einstein College of Medicine, by the Diabetes Action Foundation, and by the American Diabetes Association (M.J.C.).
Disclosure Summary: The authors have nothing to disclose.
Footnotes
- AUC
- area under the curve
- BW
- body weight
- C
- control
- CD36
- Cluster of Differention 36
- GLUT4+/−
- glucose transporter 4 heterozygote
- GTT
- glucose tolerance test
- HFD
- high-fat diet
- HPF
- high-power field
- ITT
- insulin tolerance test
- IU
- pregnancy
- L
- lactation
- NAFLD
- nonalcoholic fatty liver disease
- NASH
- nonalcoholic steatohepatitis
- NEFA
- nonesterified fatty acids
- PPAR
- peroxisome proliferator-activated receptor
- TG
- triglyceride
- WT
- wild type.
References
- 1. Buckley AJ, Jaquiery AL, Harding JE. Nutritional programming of adult disease. Cell Tissue Res. 2005;322:73–79 [DOI] [PubMed] [Google Scholar]
- 2. Armitage JA, Taylor PD, Poston L. Experimental models of developmental programming: consequences of exposure to an energy rich diet during development. J Physiol. 2005;565:3–8 [DOI] [PMC free article] [PubMed] [Google Scholar]
- 3. Seki Y, Williams L, Vuguin PM, Charron MJ. Minireview: epigenetic programming of diabetes and obesity: animal models. Endocrinology. 2012;153:1031–1038 [DOI] [PMC free article] [PubMed] [Google Scholar]
- 4. Ravelli AC, van der Meulen JH, Michels RP, et al. Glucose tolerance in adults after prenatal exposure to famine. Lancet. 1998;351:173–177 [DOI] [PubMed] [Google Scholar]
- 5. Swenne I, Crace CJ, Milner RD. Persistent impairment of insulin secretory response to glucose in adult rats after limited period of protein-calorie malnutrition early in life. Diabetes. 1987;36:454–458 [DOI] [PubMed] [Google Scholar]
- 6. Desai M, Crowther NJ, Ozanne SE, Lucas A, Hales CN. Adult glucose and lipid metabolism may be programmed during fetal life. Biochem Soc Trans. 1995;23:331–335 [DOI] [PubMed] [Google Scholar]
- 7. Steyn NP, Mann J, Bennett PH, et al. Diet, nutrition and the prevention of type 2 diabetes. Public Health Nutr. 2004;7:147–165 [DOI] [PubMed] [Google Scholar]
- 8. Chechi K, Cheema SK. Maternal diet rich in saturated fats has deleterious effects on plasma lipids of mice. Exp Clin Cardiol. 2006;11:129–135 [PMC free article] [PubMed] [Google Scholar]
- 9. Samuelsson AM, Matthews PA, Argenton M, et al. Diet-induced obesity in female mice leads to offspring hyperphagia, adiposity, hypertension, and insulin resistance: a novel murine model of developmental programming. Hypertension. 2008;51:383–392 [DOI] [PubMed] [Google Scholar]
- 10. Oben JA, Mouralidarane A, Samuelsson AM, et al. Maternal obesity during pregnancy and lactation programs the development of offspring non-alcoholic fatty liver disease in mice. J Hepatol. 2010;52:913–920 [DOI] [PubMed] [Google Scholar]
- 11. Parker L, Lamont DW, Unwin N, et al. A lifecourse study of risk for hyperinsulinaemia, dyslipidaemia and obesity (the central metabolic syndrome) at age 49–51 years. Diabet Med. 2003;20:406–415 [DOI] [PubMed] [Google Scholar]
- 12. Hartil K, Vuguin PM, Kruse M, et al. Maternal substrate utilization programs the development of the metabolic syndrome in male mice exposed to high fat in utero. Pediatr Res. 2009;66:368–373 [DOI] [PMC free article] [PubMed] [Google Scholar]
- 13. Stenbit AE, Tsao TS, Li J, et al. GLUT4 heterozygous knockout mice develop muscle insulin resistance and diabetes. Nat Med. 1997;3:1096–1101 [DOI] [PubMed] [Google Scholar]
- 14. Bruce KD, Cagampang FR, Argenton M, et al. Maternal high-fat feeding primes steatohepatitis in adult mice offspring, involving mitochondrial dysfunction and altered lipogenesis gene expression. Hepatology. 2009;50:1796–1808 [DOI] [PubMed] [Google Scholar]
- 15. Souza-Mello V, Mandarim-de-Lacerda CA, Aguila MB. Hepatic structural alteration in adult programmed offspring (severe maternal protein restriction) is aggravated by post-weaning high-fat diet. Br J Nutr. 2007;98:1159–1169 [DOI] [PubMed] [Google Scholar]
- 16. Langley-Evans SC. Developmental programming of health and disease. Proc Nutr Soc. 2006;65:97–105 [DOI] [PMC free article] [PubMed] [Google Scholar]
- 17. Rueda-Clausen CF, Dolinsky VW, Morton JS, Proctor SD, Dyck JR, Davidge ST. Hypoxia-induced intrauterine growth restriction increases the susceptibility of rats to high-fat diet-induced metabolic syndrome. Diabetes 60:507–516 [DOI] [PMC free article] [PubMed] [Google Scholar]
- 18. Vickers MH, Breier BH, Cutfield WS, Hofman PL, Gluckman PD. Fetal origins of hyperphagia, obesity, and hypertension and postnatal amplification by hypercaloric nutrition. Am J Physiol Endocrinol Metab. 2000;279:E83–E87 [DOI] [PubMed] [Google Scholar]
- 19. Stubbins RE, Najjar K, Holcomb VB, Hong J, Núñez NP. Oestrogen alters adipocyte biology and protects female mice from adipocyte inflammation and insulin resistance. Diabetes Obes Metab. 2012;14:58–66 [DOI] [PMC free article] [PubMed] [Google Scholar]
- 20. Taicher GZ, Tinsley FC, Reiderman A, Heiman ML. Quantitative magnetic resonance (QMR) method for bone and whole-body-composition analysis. Anal Bioanal Chem. 2003;377:990–1002 [DOI] [PubMed] [Google Scholar]
- 21. Ranalletta M, Du XQ, Seki Y, et al. Hepatic response to restoration of GLUT4 in skeletal muscle of GLUT4 null mice. Am J Physiol Endocrinol Metab. 2007;293:E1178–E1187 [DOI] [PubMed] [Google Scholar]
- 22. Kubota N, Terauchi Y, Miki H, et al. PPARγ mediates high-fat diet-induced adipocyte hypertrophy and insulin resistance. Mol Cell. 1999;4:597–609 [DOI] [PubMed] [Google Scholar]
- 23. Kleiner DE, Brunt EM, Van Natta M, et al. Design and validation of a histological scoring system for nonalcoholic fatty liver disease. Hepatology. 2005;41:1313–1321 [DOI] [PubMed] [Google Scholar]
- 24. Pastor MM, Proft M, Pascual-Ahuir A. Mitochondrial function is an inducible determinant of osmotic stress adaptation in yeast. J Biol Chem. 2009;284:30307–30317 [DOI] [PMC free article] [PubMed] [Google Scholar]
- 25. Matteoni CA, Younossi ZM, Gramlich T, Boparai N, Liu YC, McCullough AJ. Nonalcoholic fatty liver disease: a spectrum of clinical and pathological severity. Gastroenterology. 1999;116:1413–1419 [DOI] [PubMed] [Google Scholar]
- 26. Nivoit P, Morens C, Van Assche FA, et al. Established diet-induced obesity in female rats leads to offspring hyperphagia, adiposity and insulin resistance. Diabetologia. 2009;52:1133–1142 [DOI] [PubMed] [Google Scholar]
- 27. Buckley AJ, Keserü B, Briody J, Thompson M, Ozanne SE, Thompson CH. Altered body composition and metabolism in the male offspring of high fat-fed rats. Metabolism. 2005;54:500–507 [DOI] [PubMed] [Google Scholar]
- 28. Ozanne SE, Hales CN. Lifespan: catch-up growth and obesity in male mice. Nature. 2004;427:411–412 [DOI] [PubMed] [Google Scholar]
- 29. Bieswal F, Ahn MT, Reusens B, et al. The importance of catch-up growth after early malnutrition for the programming of obesity in male rat. Obesity (Silver Spring). 2006;14:1330–1343 [DOI] [PubMed] [Google Scholar]
- 30. Siemelink M, Verhoef A, Dormans JA, Span PN, Piersma AH. Dietary fatty acid composition during pregnancy and lactation in the rat programs growth and glucose metabolism in the offspring. Diabetologia. 2002;45:1397–1403 [DOI] [PubMed] [Google Scholar]
- 31. Li J, Houseknecht KL, Stenbit AE, Katz EB, Charron MJ. Reduced glucose uptake precedes insulin signaling defects in adipocytes from heterozygous GLUT4 knockout mice. FASEB J. 2000;14:1117–1125 [DOI] [PubMed] [Google Scholar]
- 32. Carone BR, Fauquier L, Habib N, et al. Paternally induced transgenerational environmental reprogramming of metabolic gene expression in mammals. Cell. 2010;143:1084–1096 [DOI] [PMC free article] [PubMed] [Google Scholar]
- 33. Ng SF, Lin RC, Laybutt DR, Barres R, Owens JA, Morris MJ. Chronic high-fat diet in fathers programs β-cell dysfunction in female rat offspring. Nature. 2010;467:963–966 [DOI] [PubMed] [Google Scholar]
- 34. Rett K, Wicklmayr M, Mehnert H. What is the clinical significance of insulin resistance? J Cardiovasc Pharmacol. 1992;20(suppl 11):S22–S26 [DOI] [PubMed] [Google Scholar]
- 35. Rajkumar K, Murphy LJ. Enhanced gluconeogenesis and hepatic insulin resistance in insulin-like growth factor binding protein-1 transgenic mice. Biochim Biophys Acta. 1999;1426:491–497 [DOI] [PubMed] [Google Scholar]
- 36. Jo J, Gavrilova O, Pack S, et al. 2009 Hypertrophy and/or hyperplasia: dynamics of adipose tissue growth. PLoS Comput Biol. 5:e1000324. [DOI] [PMC free article] [PubMed] [Google Scholar]
- 37. Scherer PE. Adipose tissue: from lipid storage compartment to endocrine organ. Diabetes. 2006;55:1537–1545 [DOI] [PubMed] [Google Scholar]
- 38. Lefterova MI, Mullican SE, Tomaru T, Qatanani M, Schupp M, Lazar MA. Endoplasmic reticulum stress regulates adipocyte resistin expression. Diabetes. 2009;58:1879–1886 [DOI] [PMC free article] [PubMed] [Google Scholar]
- 39. Sewter C, Berger D, Considine RV, et al. Human obesity and type 2 diabetes are associated with alterations in SREBP1 isoform expression that are reproduced ex vivo by tumor necrosis factor-α. Diabetes. 2002;51:1035–1041 [DOI] [PubMed] [Google Scholar]
- 40. Goossens GH. The role of adipose tissue dysfunction in the pathogenesis of obesity-related insulin resistance. Physiol Behav. 2008;94:206–218 [DOI] [PubMed] [Google Scholar]
- 41. Hoffler U, Hobbie K, Wilson R, et al. Diet-induced obesity is associated with hyperleptinemia, hyperinsulinemia, hepatic steatosis, and glomerulopathy in C57Bl/6J mice. Endocrine. 2009;36:311–325 [DOI] [PMC free article] [PubMed] [Google Scholar]
- 42. Okamoto Y, Tanaka S, Haga Y. Enhanced GLUT2 gene expression in an oleic acid-induced in vitro fatty liver model. Hepatol Res. 2002;23:138–144 [DOI] [PubMed] [Google Scholar]
- 43. Radford NB, Wan B, Richman A, et al. Cardiac dysfunction in mice lacking cytochrome-c oxidase subunit VIaH. Am J Physiol Heart Circ Physiol. 2002;282:H726–H733 [DOI] [PubMed] [Google Scholar]
- 44. Xia W, Wan Y, Li YY, et al. PFOS prenatal exposure induce mitochondrial injury and gene expression change in hearts of weaned SD rats. Toxicology. 2011;282:23–29 [DOI] [PubMed] [Google Scholar]
- 45. Bayol SA, Simbi BH, Fowkes RC, Stickland NC. A maternal “junk food” diet in pregnancy and lactation promotes nonalcoholic fatty liver disease in rat offspring. Endocrinology. 2010;151:1451–1461 [DOI] [PMC free article] [PubMed] [Google Scholar]
- 46. Desai M, Byrne CD, Meeran K, Martenz ND, Bloom SR, Hales CN. Regulation of hepatic enzymes and insulin levels in offspring of rat dams fed a reduced-protein diet. Am J Physiol. 1997;273:G899–G904 [DOI] [PubMed] [Google Scholar]
- 47. Mathers JC, McKay JA. Epigenetics - potential contribution to fetal programming. Adv Exp Med Biol. 2009;646:119–123 [DOI] [PubMed] [Google Scholar]