

Abstract
White matter development and myelination are critical processes in neurodevelopment. Myelinated white matter facilitates the rapid and coordinated brain messaging required for higher-order cognitive and behavioral processing. Whereas several neurological disorders such as multiple sclerosis are associated with gross white matter damage and demyelination, other disorders such as epilepsy may involve altered myelination in the efferent or afferent white matter pathways adjoining epileptic foci. Current MRI techniques including T1 weighting, T2 weighting, FLAIR, diffusion tensor imaging, and MR spectroscopy permit visualization of gross white matter abnormalities and evaluation of underlying white matter fiber architecture and integrity, but they provide only qualitative information regarding myelin content. Quantification of these myelin changes could provide new insight into disease severity and prognosis, reveal information regarding spatial location of foci or lesions and the associated affected neural systems, and create a metric to evaluate treatment efficacy. Multicomponent analysis of T1 and T2 relaxation data, or multicomponent relaxometry (MCR), is a quantitative imaging technique that is sensitive and specific to myelin content alteration. In the past, MCR has been associated with lengthy imaging times, but a new, faster MCR technique (mcDESPOT) has made quantitative analysis of myelin content more accessible for clinical research applications. The authors briefly summarize traditional white matter imaging techniques, describe MCR and mcDESPOT, and discuss current and future clinical applications of MCR, with a particular focus on pediatric epilepsy.
Keywords: myelin, epilepsy, imaging, multicomponent relaxometry
Myelin, the lipid bilayer that surrounds neuronal axons, plays a critical role in axonal development, dendritic sprouting, and synaptic generation. Combined, these processes establish integrated communication pathways across neural systems and ensure efficient brain messaging and function.13 Disorders such as autism, attention deficit and hyperactivity disorder, and schizophrenia are increasingly viewed within the context of brain “disconnectivity,” with particular emphasis placed on early white matter development. Specifically, the process of myelination, or the formation of the myelin sheath, and its relationship to evolving (mis) behavior and (dys)function have become topics of interest.
Beyond neuropsychiatric conditions, neurological disorders such as multiple sclerosis, congenital leukodystrophies, and toxic-metabolic disorders (such as central pontine myelinolysis) have been shown to be disorders of “disconnectivity,” resulting from acute and recurrent demyelination and damage to the myelin sheath.1 Epilepsy has also been shown to be a disorder of white matter, but its exact relationship with the formation and maintenance of the myelin sheath has not yet been elucidated.21 By providing an objective biomarker to gauge disease severity, quantitative evaluation of myelin content could have widespread clinical application. In particular, this valuable metric could provide unique details regarding the spatial location of abnormalities (and the associated impacted neural systems) and be used to evaluate treatment efficacy.
Imaging of Developing White Matter
Aberrant myelination, or alterations in the structure, integrity, and composition of the myelin sheath, can result in a wide variety of neurological and neuropsychiatric disorders. These disorders range from the more anatomically evident lesions observed in multiple sclerosis, cortical dysplasias, tumors, and toxic-metabolic disorders, to diseases not as clearly associated with structural malformations or abnormalities such as schizophrenia, autism, and some forms of epilepsy. Neuroimaging of these latter disorders has traditionally been accomplished with qualitative imaging approaches, which exploit differences in white and gray matter relaxation properties (the longitudinal and transverse relaxation times of T1 and T2, respectively) to generate sufficient contrast to identify gross structural alterations. For example, FLAIR imaging is a T2-weighted sequence that highlights abnormal tissue by suppressing signal from CSF, thereby providing better tissue contrast and improved identification of subtle white matter lesions.1
Both T1- and T2-weighted imaging demonstrate tissue signal as a complex function of relaxation properties, imaging sequences, and acquisition parameters. These qualitative measures, in combination with extrinsic scanner hardware effects, make direct comparison of signal changes between examinations difficult. Weighted techniques can also mask subtle tissue alteration and hinder direct temporal or population comparisons. To help alleviate these inherent problems, quantitative metrics such as brain volume, cortical thickness, or surface area may be derived through the segmentation of qualitative images. Such quantitative metrics can be compared longitudinally (across population groups) and have demonstrated utility in the study of personality traits, where volumetric differences can be observed between patients with anxiety, depression, and extroversion.4 However, direct comparison of specific tissue changes that give rise to measurable volumetric differences remains challenging.
Beyond conventional imaging approaches, DTI can provide improved sensitivity to tissue microstructure and microarchitecture.2 Diffusion tensor imaging examines the directional preference of water diffusion at the subvoxel level, making it an indispensable tool for interrogating underlying white matter fiber architecture. The derived measures of fractional anisotropy and diffusivity (mean diffusivity, axial diffusivity, and radial diffusivity) provide information about local fiber coherence and structure. These metrics have been used to investigate white matter alterations in nearly every neurological and neuropsychiatric illness, and results from these studies have universally suggested a white matter contribution to the respective pathologies. In the neurology literature, for example, DTI has shown that white matter microstructure is significantly impaired in epilepsy.11,21 However, interpretation of fractional anisotropy, mean diffusivity, axial diffusivity, and radial diffusivity is challenging.19 Furthermore, by reflecting fiber coherence, these measures are influenced by inflammation, gliosis, and axon loss, as well as by the underlying architectural milieu; that is, each derived measure assumes a tensor diffusion model that does not accurately apply to the majority of brain voxels, but is instead specific to its surrounding environment.3,17 Therefore, although DTI is useful in studying white matter, it does not provide specific or easily interpretable measures of myelin content.
Improved sensitivity to myelin content can be obtained through multiple component analysis of relaxation data, also called MCR. In MCR, the MR signal is decomposed into contributions from discrete microanatomical water pools on the basis of their respective signal characteristics. In brain tissue, water is broadly divided into 2 compartments: “free” water in the intraaxonal and extraaxonal space, and “trapped” water between the bilayers of the myelin sheath (Fig. 1A). Each compartment provides a unique MR signal “signature” (Fig. 1B), and the combination of these signatures yields the overall measured signal. From multiple MR images, MCR reconstructs these signal signatures and calculates the relative myelin signal fraction, the myelin water fraction (MWF). Performing voxel-wise analysis allows calculation of a whole-brain MWF map (Fig. 1C). Myelin water fraction has been shown to correlate strongly with the gold standard of histological assessments of myelin content.16,18 Additionally, unlike DTI, MWF is not influenced by pathological changes such as inflammation. 12 The quantitative nature of MCR lends itself to longitudinal- and population-based comparisons,10 and its demonstrated specificity to myelin affords improved interpretation of the observed changes. Furthermore, MCR has been shown to be superior to DTI-derived diffusion anisotropy in reflecting changes in myelin content.6,9 To this end, MCR provides clinically relevant information in demyelinating disorders,14–16 and more recently, it has shown promise in the study of myelination development in normal infants and young children.7,8,20
Fig. 1.

Illustration of MWF calculation using multicomponent relaxation time analysis. A: Photomicrograph showing water compartments in a cell: “free” water (intra- and extraaxonal space) and “trapped” water (within the myelin sheath). Reprinted with permission from A. N. Davison and Alan Peters: Myelination. Charles C. Thomas Publishers, Springfield, 1970. B: Graph showing that each water compartment has a unique MR “signature,” and summation of these signatures is the observed cumulative signal. C: Myelin water fraction is calculated from MCR reconstruction of these signatures from multiple MR images. The MWF whole-brain map (shown) is calculated by performing voxel-wise analysis.
In addition to longitudinal studies of demyelination (and even possible subsequent recovery), MWF imaging also permits investigation of myelin changes in single individuals relative to similar populations. For example, the MWF data from individual patients with multiple sclerosis can be statistically compared with age- and sex-matched healthy control populations using Z statistics.14 This straightforward statistical analysis allows direct appreciation of areas of increased or decreased myelin and can be applied to any suspected patient, provided a suitably matched population exists.
Improved Quantitative Analysis of Myelin Using mcDESPOT
The primary limitation of established MCR techniques, which derive MWF information from a series of T2-weighted images, is the prolonged scan time required to obtain high-resolution whole brain information. Through recent advancements, 8–12 contiguous slices (5-mm-thick) can be acquired in approximately 12 minutes with a voxel resolution of 1 × 2 × 5 mm3. A novel imaging technique, multicomponent driven equilibrium single-pulse observation of T1 and T2 (mcDESPOT) uses T1 and T2 information obtained from rapid 3D steady-state imaging techniques to derive MWF estimates even faster. Using mcDESPOT, whole-brain (1.7 × 1.7 × 1.7 mm3) isotropically resolved MWF data can be acquired in less than 12 minutes, presenting a new, clinically viable approach to MWF imaging. Thus far, the technique has been used to investigate healthy myelin maturation in children.7,8,16
Applications of mcDESPOT Imaging: A Pilot Pediatric Epilepsy Study
Traditionally, imaging in epilepsy has focused on MRI and PET scans to identify epileptogenic foci. Magnetic resonance imaging examinations for epilepsy include T1- and T2-weighted and FLAIR sequences that are acquired in at least 2 orthogonal planes using a slice thickness of 1.5 mm or less. Diffusion-weighted imaging shows edema from status epilepticus. By identifying decreased N-acetylaspartate, MR spectroscopy can also be useful for differentiating tumors from cortical dysplasia or locating epileptogenic foci. Although DTI shows white matter structures, it is not currently used for diagnosis in epilepsy. Structural imaging uses segmentation and significant postprocessing analysis to quantify the volume of various parts of the brain, examining cortical thickness and blurring gray-white junctions. Functional MRI has also been used to determine language dominance to help with planning for resection of epileptic foci.5
Myelin-specific imaging using mcDESPOT may provide an adjunct to the above techniques, detailing myelin and its relationship to epilepsy. Prior DTI studies have shown disrupted white matter in epilepsy,21 but as mentioned above, derived DTI metrics are challenging to interpret and, being more reflective of the architectural milieu of fiber density and coherence, DTI is not specific to myelin. Although it is not anticipated that quantitative myelin-specific imaging will provide direct visualization of seizure foci, given that myelination occurs in response to neural activation, the identification of small changes in myelin content may delineate pathways adjoining epileptic foci. Knowledge of impacted neural circuits may subsequently aid in the elucidation of epileptogenic foci, thereby harboring the potential for mcDESPOT to significantly influence epilepsy treatment.
To examine this hypothesis and provide preliminary insight into the clinical utility of mcDESPOT, a pilot study was undertaken to characterize white matter MWF changes associated with known epileptic foci. This study was approved by the Institutional Review Board of Rhode Island Hospital and Hasbro Children’s Hospital.
This study focused on 3 pediatric patients from 3 to 6 years of age (Table 1) with diverse clinical presentations. These patients also demonstrated a variety of anatomical abnormalities: cortical dysplasia, agenesis of the corpus callosum, and hippocampal dysplasia. In addition to traditional clinical diagnostic MRI (standard T1- and T2-weighted sequences), all participants were also scanned using the mcDESPOT protocol outlined in Table 2. Case 1 was scanned without sedation, but due to age, Cases 2 and 3 were scanned using the pediatric sedation policy of Hasbro Children’s Hospital. Per protocol, the child who underwent scanning while awake was imaged using an acoustically muffled sequence (reduced scanner gradient slew rate and maximum gradient amplitudes), reducing the noise of the scanner to less than 60 dB.7 This resulted in longer scan times for this participant, but the quantitative nature of mcDESPOT permitted direct comparison between all participants.10
TABLE 1.
Demographic information for each patient and matched control group*
| Variable | Case 1 | Control Group 1 (n = 12) | Case 2 | Control Group 2 (n = 15) | Case 3 | Control Group 3 (n = 13) |
|---|---|---|---|---|---|---|
| clinical presentation | cortical dysplasia | NA | partial agenesis of corpus callosum | NA | lt hippocampal dysplasia | NA |
| sex | female | female | male | male | male | male |
| mean age ± SD | 69 mos (2055 days) | 2056 ± 49 days | 38 mos (1131 days) | 1174 ± 82 days | 44 mos (1322 days) | 1303 ± 36 days |
| age range (days) | NA | 1988–2118 | NA | 1074–1294 | NA | 1262–1368 |
NA = not applicable.
TABLE 2.
Details of the mcDESPOT imaging protocol*
| Variable | Sedation | No Sedation |
|---|---|---|
| SPGR | ||
|
| ||
| no. of slices | 88 | 88 |
| TE (msec)/TR (msec) | 2.5/5.5 | 4.3/9.8 |
| flip angles (°) | 2, 3, 4, 5, 6, 7, 10, & 14 | 3, 4, 5, 6, 7, 9, 13, & 18 |
|
| ||
| IR-SPGR | ||
|
| ||
| no. of slices | 44 | 44 |
| TE (msec)/TR (msec)/TI (msec) | 2.5/5.5/500 | 4.3/9.9/500 |
| flip angles (°) | 5 | 5 |
|
| ||
| SSFP | ||
|
| ||
| no. of slices | 88 | 88 |
| TE (msec)/TR (msec) | 2.5/5.1 | 4.1/8.2 |
| flip angles (°) | 9, 12, 15, 18, 21, 27, 40, & 55 | 12, 15, 19, 23, 35, 50, & 70 |
| radiofrequency phase cycles (°) | 0 & 180 | 0 & 180 |
In all SPGR, IR-SPGR, and SSFP groups, sagittal orientation was used, as well as a 22 × 22 × 16–cm FOV, 128 × 128 imaging matrix, and 350-Hz/pixel receiver bandwidth. Abbreviations: IR-SPGR = inversion recovery spoiled gradient echo; SPGR = spoiled gradient echo; SSFP = steady-state free precession.
To investigate affected regions in individual patients, a Z-statistic approach was taken in which the individual patients were compared with age- (± 60 days of the corresponding patient) and sex-matched controls. The Z-statistic was evaluated for each imaging voxel as:
in which xi is intravoxel MWF in an individual patient, μi is the mean intravoxel MWF obtained from a matched population, and si is the population-based standard deviation of MWF.
The Z-statistic provides a quantitative measure of individual deviation from normal myelination. As such, Z-statistic maps readily demonstrate areas of abnormally low or high MWF, which correlate with decreased and increased myelination, respectively. For moderate sample sizes of 12–15 following a normal distribution, voxels with Z < − 4 or Z > + 4 are considered statistically different, with a corresponding p value < 0.001.
As Z-statistic analysis requires a priori knowledge of population means and standard deviations; therefore, age- and sex-matched control subjects were also imaged using mcDESPOT. Demographic information for each control group is given in Table 1. Control individuals had a gestational period of at least 38 weeks and had no history of neurological injury (antenatal or postnatal), no familial history of psychiatric illness, no abnormalities on fetal ultrasonography, and no in utero exposure to alcohol or illicit drugs. All control patients were scanned without sedation, either asleep (those 4 years of age and younger) or while watching a movie (those 5 years of age or older).
Following MRI acquisition, standard mcDESPOT processing was applied to derive voxel-wise MWF maps for each individual. This postprocessing included removal of nonbrain parenchyma signal, correction for receiver and transmitter magnetic field (B0 and B1) inhomogeneities, and fitting to a 3-pool tissue model. Calculated MWF maps were then nonlinearly aligned to a standard template using a previously described approach.7 The MWF mean and standard deviation for each patient’s control group were then calculated at each voxel, and voxel-wise Z-statistic maps were calculated for each patient. The Z-statistic map thresholds were Z < − 4 and Z > + 4 to identify areas of statistically significant decreased or increased MWF, respectively.
Results of Clinical Case Reports
Case 1: Cortical Dysplasia
The patient in Case 1 was an otherwise healthy 6-year-old girl with abrupt onset of focal motor seizures of her right arm and leg. The seizures first started at night but progressed into the daytime. A standard MRI of the brain was read as normal. The patient was placed on 3 antiepileptic drugs, without any significant improvement, and seizure frequency continued to increase to almost 20 seizures per day. Electroencephalography showed seizures originating in the left posterior frontal region. With the newly available EEG data, the original MRI was re-interpreted as showing a possible cortical dysplasia in the left frontal lobe (Fig. 2 upper row).
Fig. 2.
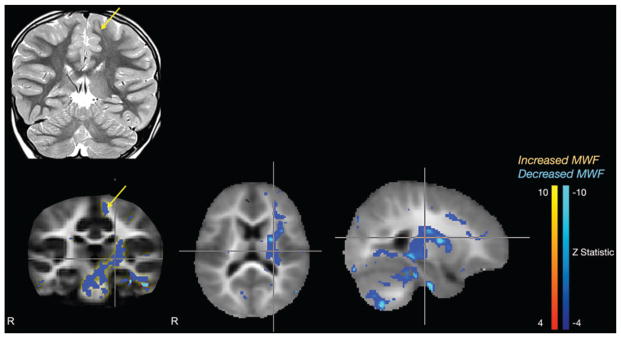
Case 1. Standard coronal T2-weighted MR image (upper row) demonstrating cortical dysplasia in the left frontal lobe (arrow), and mcDESPOT Z-statistic results (lower row) showing decreased myelin in the left supplemental motor cortex and left internal capsule, extending into the midbrain.
Subsequently, the patient was sent for mcDESPOT imaging. This myelin-of decreased myelination in the left supplementary motor area, as well as significantly decreased myelination in the posterior limb of the left internal capsule. The internal capsule finding was noted to continue into the midbrain (Fig. 2 lower row).
With the anatomical details at hand, the patient proceeded to the operating room. A left frontal craniotomy was performed, and a 4-channel strip and a 6-contact depth electrode were placed over the area of presumed seizure activity. Maximal activity was observed on the strip in the region of the described transmantle cortical dysplasia. Depth electrodes were inserted into the superior frontal gyrus and showed marked interictal epileptiform activity from these areas. Once the seizure focus was confirmed, a cortical incision was made in the superior frontal gyrus, and a 3 × 2.5–cm portion of the superior frontal gyrus was resected. The resection margin was taken back to the motor cortex posteriorly, to the falx medially, and to the cingulate sulcus inferiorly. After resection, intraoperative EEG was confirmed as normal.
The patient has been seizure free for 8 months since surgery. She will undergo repeat mcDESPOT imaging in a year to assess for change in the decreased myelination noted in the internal capsule and midbrain.
Case 2: Agenesis of Corpus Callosum
The patient in Case 2 was a 2-year-old boy with Fragile X syndrome who presented with multiple febrile seizures consisting of left eye deviation, left-sided twitching, and progression to tonic-clonic seizures. His EEG results were inconclusive: 1 electroencephalogram was negative and another showed right temporal discharges and bihemispheric dysfunction. Standard MRI of the brain showed gross abnormalities, including partial agenesis of the corpus callosum splenium and posterior body, bilateral hippocampal dysplasia, bilateral periventricular leukomalacia, and a left temporal arachnoid cyst (Fig. 3 upper row). The mcDESPOT showed decreased myelination in the rostral as well as caudal corpus callosum and the left internal capsule. Unlike in Case 1, in this patient mcDESPOT did not reveal a discrete seizure focus. Nonetheless, this patient’s mcDESPOT sequence remains instructive in that it clearly delineated a known myelin defect, the partial agenesis of the corpus callosum, thereby demonstrating the sensitivity of mcDESPOT to decreased myelination. Additionally, mcDESPOT may be more sensitive to overall myelin content, identifying decreased myelination in the genu of the corpus callosum when only the splenium was noted to be abnormal by traditional MRI. In the setting of this patient’s multiple other anatomical brain abnormalities, the other changes observed on the mcDESPOT sequence are not easily interpreted (Fig. 3 lower row).
Fig. 3.
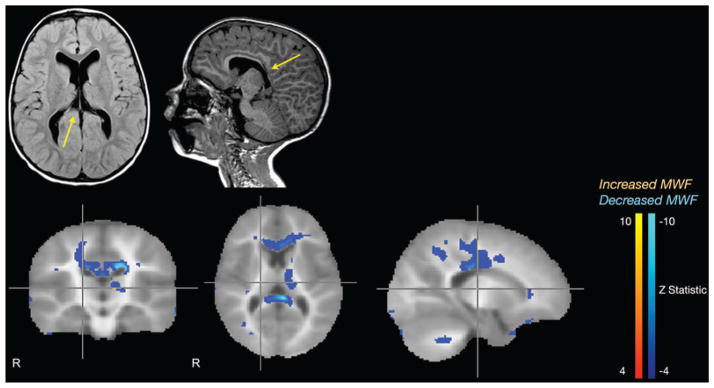
Case 2. Standard axial T2-weighted FLAIR and sagittal T1-weighted MR images (upper row) demonstrating partial agenesis of the corpus callosum (arrows), and mcDESPOT Z-statistic results (lower row) corroborating the caudal callosal agenesis but also demonstrating hypomyelination in the more morphologically normal rostral portions of the corpus callosum.
Case 3: Left Hippocampal Dysplasia
The patient in Case 3 was a 3-year-old boy who presented with 3 episodes of febrile seizures associated with otitis media. The patient had no significant medical or family history. The EEG was concerning for generalized epilepsy but no seizures were captured. Specifically, frequent bursts of 2- to 3-Hz generalized spike and slow wave complexes were observed with no lateralization. Standard MRI of the brain showed left hippocampal dysplasia (Fig. 4 upper row). The mcDESPOT sequence revealed decreased myelination in bilateral internal capsules, with demyelination in the left internal capsule extending to the left motor cortex, bilateral thalami, the genu of the corpus callosum, and the cerebellum (Fig. 4 lower row). In contrast to the patient in Case 1, mcDESPOT in this patient did not show a solitary epileptic focus. However, the bilaterality of the abnormal myelination may be correspondingly suggestive of a more diffuse underlying pathology in this patient. In particular, this case demonstrates bilateral abnormalities of myelination in a patient with febrile seizures. It is possible that the mcDESPOT sequence could be helpful in the setting of generalized seizure by differentiating patients with febrile seizures into those with diffuse abnormalities from those who may have more benign disease.
Fig. 4.
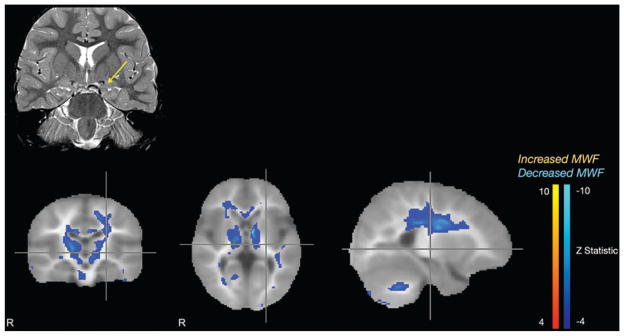
Case 3. Standard coronal T2-weighted MR image (upper row) demonstrating left hippocampal dysplasia (arrow), and mcDESPOT Z-statistic results (lower row) showing bilateral decreased myelination of the internal capsules.
Although it is not possible to draw conclusions about the clinical potential of mcDESPOT from only 3 patients, the imaging data do show that epilepsy is associated with significant changes in myelination, and the laterality of these changes may correlate with seizure focus. Case 1 demonstrates that in the case of a focal cortical dysplasia, mcDESPOT not only shows the dysplasia well, it also reflects significant myelin abnormalities within pathways apparently related to the seizure focus, and in such, provides an excellent adjunct to preoperative planning. Case 2 demonstrates that mcDESPOT is very sensitive to decreased myelination, clearly identifying partial agenesis of the corpus callosum but also raising questions about the myelination status of the more morphologically normal portions of this patient’s corpus callosum. Last, Case 3 demonstrates that in the case of generalized seizure, there are likely significant and widespread myelin abnormalities that merit further investigation.
Conclusions
We have shown that the mcDESPOT sequence works well to identify myelin abnormalities in 3 pediatric epilepsy patients with different clinical presentations and anatomical abnormalities. Moving forward, mcDES-POT will be used to study patients with focal seizures. Our broader aims include using mcDESPOT to aid in the identification of epileptic foci, to study the effects of epilepsy on the neural networks associated with epileptic foci, and to use the sequence as a metric to determine treatment efficacy.
By providing a more quantitative approach to examining white matter and specifically detailing myelin content, mcDESPOT has the potential to change the nature of white matter imaging. The clinical applications of this sequence are promising, but larger trials will be needed to elucidate how mcDESPOT can effectively aid clinicians in the diagnosis and treatment of white matter–related diseases.
Acknowledgments
The authors would like to thank Sue Foley, Elizabeth Morrell, Diane Romano, and Wendy Smith for their help with patient recruitment.
Abbreviations used in this paper
- DTI
diffusion tensor imaging
- EEG
electroencephalography
- mcDESPOT
multicomponent driven equilibrium single-pulse observation of T1 and T2
- MCR
multicomponent relaxometry
- MWF
myelin water fraction
Footnotes
Disclosure
Dr. Deoni receives research funding and salary support from the Medical Research Council UK (grant no. G0800298) and the National Institutes of Mental Health (grant no. R01MH087510). Dr. O’Muircheartaigh is supported by a Sir Henry Wellcome Postdoctoral Fellowship awarded by the Wellcome Trust (no. 096195).
Author contributions to the study and manuscript preparation include the following. Conception and design: Spader, O’Muircheartaigh, Dean, Boxerman, Cosgrove, Deoni. Acquisition of data: Spader, O’Muircheartaigh, Dean, Dirks, Boxerman, Cosgrove, Deoni. Analysis and interpretation of data: Spader, Ellermeier, O’Muircheartaigh, Dean, Boxerman, Cosgrove, Deoni. Drafting the article: Spader, Ellermeier, O’Muircheartaigh, Cosgrove, Deoni. Critically revising the article: Spader, Ellermeier, O’Muircheartaigh, Boxerman, Cosgrove, Deoni. Reviewed submitted version of manuscript: Spader, Ellermeier, Deoni. Approved the final version of the manuscript on behalf of all authors: Spader. Statistical analysis: O’Muircheartaigh, Deoni. Administrative/technical/material support: Dirks, Deoni. Study supervision: Boxerman, Cosgrove, Deoni.
References
- 1.Barkovich AJ, editor. Pediatric Neuroimaging. 3. Philadelphia: Lippincott Williams & Wilkins; 2000. Normal development of the neonatal and infant brain, skull, and spine; pp. 30–69. [Google Scholar]
- 2.Basser PJ, Jones DK. Diffusion-tensor MRI: theory, experimental design and data analysis—a technical review. NMR Biomed. 2002;15:456–467. doi: 10.1002/nbm.783. [DOI] [PubMed] [Google Scholar]
- 3.Beaulieu C. The basis of anisotropic water diffusion in the nervous system—a technical review. NMR Biomed. 2002;15:435–455. doi: 10.1002/nbm.782. [DOI] [PubMed] [Google Scholar]
- 4.Bjørnebekk A, Fjell AM, Walhovd KB, Grydeland H, Torgersen S, Westlye LT. Neuronal correlates of the five factor model (FFM) of human personality: multimodal imaging in a large healthy sample. Neuroimage. 2013;65:194–208. doi: 10.1016/j.neuroimage.2012.10.009. [DOI] [PubMed] [Google Scholar]
- 5.Çataltepe O, Jallo GI, editors. Pediatric Epilepsy Surgery: Pre-operative Assessment and Surgical Treatment. New York: Thieme Medical; 2010. [Google Scholar]
- 6.Deoni SCL. Correction of main and transmit magnetic field (B0 and B1) inhomogeneity effects in multicomponent-driven equilibrium single-pulse observation of T1 and T2. Magn Reson Med. 2011;65:1021–1035. doi: 10.1002/mrm.22685. [DOI] [PMC free article] [PubMed] [Google Scholar]
- 7.Deoni SCL, Dean DC, III, O’Muircheartaigh J, Dirks H, Jerskey BA. Investigating white matter development in infancy and early childhood using myelin water faction and relaxation time mapping. Neuroimage. 2012;63:1038–1053. doi: 10.1016/j.neuroimage.2012.07.037. [DOI] [PMC free article] [PubMed] [Google Scholar]
- 8.Deoni SCL, Mercure E, Blasi A, Gasston D, Thomson A, Johnson M, et al. Mapping infant brain myelination with magnetic resonance imaging. J Neurosci. 2011;31:784–791. doi: 10.1523/JNEUROSCI.2106-10.2011. [DOI] [PMC free article] [PubMed] [Google Scholar]
- 9.Deoni SCL, Rutt BK, Arun T, Pierpaoli C, Jones DK. Gleaning multicomponent T1 and T2 information from steady-state imaging data. Magn Reson Med. 2008;60:1372–1387. doi: 10.1002/mrm.21704. [DOI] [PubMed] [Google Scholar]
- 10.Deoni SCL, Williams SCR, Jezzard P, Suckling J, Murphy DGM, Jones DK. Standardized structural magnetic resonance imaging in multicentre studies using quantitative T1 and T2 imaging at 1.5 T. Neuroimage. 2008;40:662–671. doi: 10.1016/j.neuroimage.2007.11.052. [DOI] [PubMed] [Google Scholar]
- 11.Gao Y, Zhang Y, Wong CS, Wu PM, Zhang Z, Gao J, et al. Diffusion abnormalities in temporal lobes of children with temporal lobe epilepsy: a preliminary diffusional kurtosis imaging study and comparison with diffusion tensor imaging. NMR Biomed. 2012;25:1369–1377. doi: 10.1002/nbm.2809. [DOI] [PubMed] [Google Scholar]
- 12.Gareau PJ, Rutt BK, Karlik SJ, Mitchell JR. Magnetization transfer and multicomponent T2 relaxation measurements with histopathologic correlation in an experimental model of MS. J Magn Reson Imaging. 2000;11:586–595. doi: 10.1002/1522-2586(200006)11:6<586::aid-jmri3>3.0.co;2-v. [DOI] [PubMed] [Google Scholar]
- 13.Johnson MH, Munakata Y. Processes of change in brain andcognitive development. Trends Cogn Sci. 2005;9:152–158. doi: 10.1016/j.tics.2005.01.009. [DOI] [PubMed] [Google Scholar]
- 14.Kitzler HH, Su J, Zeineh M, Harper-Little C, Leung A, Kremenchutzky M, et al. Deficient MWF mapping in multiple sclerosis using 3D whole-brain multi-component relaxation MRI. Neuroimage. 2012;59:2670–2677. doi: 10.1016/j.neuroimage.2011.08.052. [DOI] [PMC free article] [PubMed] [Google Scholar]
- 15.Kolind S, Matthews L, Johansen-Berg H, Leite MI, Williams SCR, Deoni S, et al. Myelin water imaging reflects clinical variability in multiple sclerosis. Neuroimage. 2012;60:263–270. doi: 10.1016/j.neuroimage.2011.11.070. [DOI] [PMC free article] [PubMed] [Google Scholar]
- 16.Laule C, Leung E, Lis DKB, Traboulsee AL, Paty DW, MacKay AL, et al. Myelin water imaging in multiple sclerosis: quantitative correlations with histopathology. Mult Scler. 2006;12:747–753. doi: 10.1177/1352458506070928. [DOI] [PubMed] [Google Scholar]
- 17.Oouchi H, Yamada K, Sakai K, Kizu O, Kubota T, Ito H, et al. Diffusion anisotropy measurement of brain white matter is affected by voxel size: underestimation occurs in areas with crossing fibers. AJNR Am J Neuroradiol. 2007;28:1102–1106. doi: 10.3174/ajnr.A0488. [DOI] [PMC free article] [PubMed] [Google Scholar]
- 18.Webb S, Munro CA, Midha R, Stanisz GJ. Is multicomponent T2 a good measure of myelin content in peripheral nerve? Magn Reson Med. 2003;49:638–645. doi: 10.1002/mrm.10411. [DOI] [PubMed] [Google Scholar]
- 19.Wheeler-Kingshott CAM, Cercignani M. About “axial” and “radial” diffusivities. MagnResonMed. 2009;61:1255–1260. doi: 10.1002/mrm.21965. [DOI] [PubMed] [Google Scholar]
- 20.Whitaker KJ, Kolind SH, MacKay AL, Clark CM. Quantifying development: investigating highly myelinated voxels in preadolescent corpus callosum. Neuroimage. 2008;43:731–735. doi: 10.1016/j.neuroimage.2008.07.038. [DOI] [PubMed] [Google Scholar]
- 21.Widjaja E, Kis A, Go C, Raybaud C, Snead OC, Smith ML. Abnormal white matter on diffusion tensor imaging in children with new-onset seizures. Epilepsy Res. 2012 doi: 10.1016/j.eplepsyres.2012.10.007. epub ahead of print. [DOI] [PubMed] [Google Scholar]