

Abstract
Neuroimaging studies of healthy aging often reveal differences in neural activation patterns between young and elderly groups for episodic memory tasks, even though there are no differences in behavioral performance. One explanation typically offered is that the elderly compensate for their memory deficiencies through the recruitment of additional prefrontal regions. The present study of healthy aging compared magnetoencephalographic (MEG) time-courses localized to specific cortical regions in two groups of subjects (20–29 years and ≥65 years) during a visual delayed-match-to-sample (DMS) task. MR morphometrics and neuropsychological test results were also examined with the hope of providing insight into the nature of the age-related differences. The behavioral results indicated no differences in performance between young and elderly groups. Although there was a main effect of age on the latency of the initial peak in primary/secondary visual cortex, these longer latencies were not correlated with the performance of elderly on the DMS task. The lateral occipital gyrus (LOG) revealed qualitatively different patterns of activity for the two age groups corroborated by neuropsychological test results. Morphometric results for the young versus elderly groups revealed less white (WM) and gray matter (GM) volumes in the frontal lobes of the elderly. When a group of middle-aged subjects (33–43 years) was included in the morphometric analyses, the middle-aged subjects revealed statistically greater WM volumes in frontal and parietal cortex suggesting immature WM tracts in the young. Perhaps our elderly utilized a different strategy compared to the young due to the different brain maturation levels of these groups.
Keywords: MEG, Working memory, Aging, Delayed-match-to-sample, Brain mapping, Gray and white matter volumes, Recognition memory, Morphometrics
Introduction
The study of age-related changes in cognition is challenging since normal aging reflects a delicate balance between basic biological–genetic factors and social–cultural factors (Shimamura et al., 1995; Hedden and Gabrieli, 2004). Physiological viewpoints describe aging as an inevitable loss of tissues and functional reserves (Bellamy, 1997). But these views cannot explain how elder professors, for example, can perform equally well or better than young on the recall of prose passages (Shimamura et al., 1995) or how task instruction itself can abolish differences in memory performance between young and elderly (Rahhal et al., 2001). The preservation of performance in some elderly is often attributed to the use of strategies which compensate for memory decline (Cabeza et al., 2002; Grady et al., 2006). Cabeza et al. (2002), for example, suggest that older adults who perform as well or better than young adults reveal less asymmetric prefrontal cortex activity which may help compensate for age-related neurocognitive decline. This view emphasizes that effective strategies evolve to counteract the “series of deleterious changes” that occur during aging. But, recent anatomical evidence shows that brain maturation (e.g., myelination) also continues throughout adulthood. For example, postmortem studies reveal that myelination in the hippocampus increases into the 5th and 6th decades of life (Benes et al., 1994). Currently, there is no clear description of the underlying mechanisms of strategies which seem to change as a function of aging. The present study attempts to characterize the strategies used by young and elderly groups during a nonverbal working memory task by correlating physiological measures with performance, neuropsychological, and anatomical data and then relates these results to developmental trends in anatomy and cognition.
One critical issue for studies of development and aging is the extent to which the functional neuroanatomy underlying task performance differs between various age groups. Poldrack (2000) and Schlaggar et al. (2002) note that many functional neuroimaging studies do not take into consideration the plastic nature of the nervous system that is altered on the basis of development and experience throughout the life span. For instance, while total brain volume does not change much during adulthood due to the fixed volume of the cranium, dynamic processes associated with maturation and decline of white matter (WM), gray matter (GM), myelination, and synaptogenesis continue throughout the life span. Each of these processes has different rates of maturation and degeneration in different regions of the brain. The gradual maturation of fiber tracts (e.g., increase in diameter and myelination of axons in the fronto-temporal pathway) during late childhood and adolescence, for example, supports the concurrent maturation of motor and speech functions (Paus et al., 1999). Similarly, WM fractional anisotropy (FA), a measure of fiber direction, correlated significantly with reading within a left temporo-parietal region, a region well-associated with the development of fluent reading skill (Beaulieu et al., 2005). These studies suggest that more efficient neural processing, due to more myelination, could be critical for learning and memory (Beaulieu et al., 2005). In general, recent anatomical evidence emphasizes that the timecourse of human brain development is a long process of specialization shaped by postnatal experience. Bartzokis (2002) suggests that the temporal extent of brain development/maturation extends into middle age when maximal WM volume and myelination are reached in frontal lobes and association areas, regions necessary for higher cognitive functions. Therefore, it is important that studies of aging take into consideration healthy maturational changes that occur during adulthood as well as the degenerative changes.
Since effective brain function requires integration of information from segregated brain regions and thus depends on the structural properties of the connecting pathways, including axon diameter and thickness of the insulating myelin sheet, the ability for localized regions to work together as large-scale neural networks is likely to change during learning and development as well (Poldrack, 2000; Ben Bashat et al., 2005). Therefore, differing rates of maturation of brain regions and their connections affect the development of specific skills and consequent strategies adopted. For example, Schlaggar et al. (2002) discuss their visual word processing data by noting that left extrastriate regions become specialized in children as they become literate while maturation of left frontal cortex, believed to be related to the development of control processes, occurs later. In the absence of a mature left frontal region, a child’s brain adopts a strategy for processing visual verbal stimuli that includes greater use of left extrastriate cortex while adults utilize both regions. Although the left frontal lobe of children may appear mature in a general sense (i.e., GM volume, it is accessible), the experience of incorporating the processing resources of this region into a strategy for performing visual verbal tasks may be lacking at this age. In essence, the functional neuroanatomy underlying controlled lexical task performance is still developing during early school years, and possibly continues to develop or change as a function of experience into adulthood.
A second critical issue for studies examining age-related changes concerns differences in performance measures (Poldrack, 2000). Most investigators agree that it is good to have similar performance between age groups in order to be certain that differences seen in the functional imaging data are attributable to age differences per se rather than other factors such as increased effort. One remedy offered by Poldrack for performance confounds is to constrain performance to remain roughly constant or equate difficulty between conditions. One approach employs the simplest possible version of the task so both groups can perform at a high level while engaged in the cognitive processes of interest. Indeed, most of the neuroimaging studies of normal aging show differences in neural activation patterns between young and elderly groups (e.g., under-activation, over-activation), when there are no differences in behavioral performance (McIntosh et al., 1999; Grady et al., 2003; Morcom et al., 2003), and the results are interpreted within a compensatory framework (Grady and Craik, 2000; Cabeza et al., 2002; Reuter-Lorenz, 2002). But, as Nielson et al. (2002) point out, what needs to be determined for any compensation view is whether there is direct benefit to the additional activity (i.e., increase in amplitude or recruitment of additional structures). Because a brain region is active during the performance of a task does not demonstrate that the region is necessary for performance of the task (Poldrack, 2000). Therefore, neuroimaging methods should be combined with other techniques in order to shed light on whether a compensation-based strategy best explains the results and/or a maturation-based strategy underlies the development of an effective cognitive strategy. The finding that WM maturation continues until ~45 years, beyond the typical age of subjects labeled as young (e.g., 20–29 years), implies that additional changes may have occurred between the age groups being compared that are not due solely to brain deterioration (and hence compensation).
Finally, the methods utilized to characterize age-related changes in anatomy and physiology have inherent strengths and limitations. Most neuroimaging studies of aging have been conducted using either fMRI or PET. Issues concerning the use of subtraction techniques and associated concerns surrounding resting baselines (Poldrack, 2000); selection of regions of interest (Aizenstein et al., 2004); and confounds associated with effects of aging on neurovascular coupling have been raised previously (Rosen et al., 2002; D’Esposito et al., 2003; Grady et al., 2003). The present study uses magnetoencephalography (MEG) with anatomical MRI (including morphometry). There are two primary advantages in using MEG methods for studies of aging. First, MEG methods are not dependent upon subtraction techniques to examine age-related changes. Within-subject analyses are conducted first to localize the activity and derive the timecourse information, and then timecourse information can be averaged together across subjects from similar cortical locations in order to make group comparisons for each experimental condition. This permits within-group correlations to be conducted between MEG and performance measures. Second, because MEG methods can isolate events in time, it is easier to individually examine encoding, retention during the delay interval, and recognition memory. In addition, MEG, unlike fMRI and PET methods which integrate activity across seconds of time, can capture the nature of changing activity patterns within specific cortical locations, across time. For example, Cabeza et al. (2004) and Grady et al. (2006) found reduced occipital activity with age during visual attention and memory tasks and concluded that reduced sensory processing might be a common cause of age differences in cognition. MEG can separate out activity which is primarily sensory-related versus activity in sensory or other regions that are modulated by attention or become sustained due to working memory task demands (Aine et al., 2003). According to our MEG studies, initial sensory-related activity in auditory and somatosensory cortices (~40 ms and ~20 ms, respectively) are enhanced in amplitude for the elderly, not decreased (Aine et al., 2005; Kovacevic et al., 2005; Stephen et al., 2006).
The present study was designed to demonstrate age-related neural changes during an explicit episodic nonverbal working memory task while keeping performance at equally high levels for both age groups by using a simple delayed-match-to-sample (DMS) task. Correlational analyses between behavioral performance measures (percent correct and reaction times) and MEG measures will be conducted to determine whether age-related changes in neural activity are related to performance on the task. If age-related MEG activity is related to task performance, then MR-based morphometric and neuropsychological measures should be helpful in understanding the age-related physiological differences obtained. For example, correlating MEG measures from specific brain regions with neuropsychological and morphometric results will allow us to determine if (1) strategy differences (e.g., a cluster of neuropsychological test results correlate with the MEG measures for one group that is different from a cluster of test results for another group) and/or (2) anatomical differences (e.g., increased WM volumes evident for one group) best characterize the age-related neural changes. If age-related anatomical differences exist that suggest positive maturational changes still occur throughout the life span, then we will conclude that an account of aging based solely on characterizing degenerative changes is inadequate. In anticipation of our results, along with the knowledge that the anatomical literature does reveal continued brain maturation through middle age, we examined the developmental literature to determine the types of strategies that tend to evolve naturally as a consequence of development and attempted to account for our presumed strategy differences via these normal maturational processes.
Materials and methods
Twenty-four healthy normal volunteers from two age groups (20–29, ≥65 years) underwent a screening evaluation including a quantitative neurological examination, the Mini Mental State Exam (MMSE), the Physical Self-Maintenance Scale for activities of daily living, the modified Hachinski Ischemic Scale (HIS), and the Geriatric Depression Scale (GDS), in addition to a battery of neuropsychological tests. Subjects were further tested using the Satz–Mogel version of the Wechsler Adult Intelligence Scale-Revised, Beck Depression Inventory II, and the Aphasia Screening test. Testing of subjects took place across 2–3 days in order to avoid fatigue.
All subjects received an MRI scan, read by a neuroradiologist, to assure that there were no anatomical abnormalities. Potential subjects were excluded from consideration if they showed evidence of significant chronic neurological disease (e.g., Parkinson’s disease, seizure disorder, head trauma complicated by persistent neurologic deficits, or structural brain abnormalities) or severe medical illness (e.g., oxygen-dependent COPD, severe congestive heart failure). Subjects were excluded if they met criteria for major depression or any other major DSM-IV axis I disorder, including alcohol/substance abuse.
Prior to participation, all subjects were informed about the nature of the studies and signed consent forms approved by the Human Research Review Committee at the University of New Mexico, Health Sciences Center, and by the Research and Development Committee at the New Mexico VA Health Care System. These studies have been conducted in accordance with the ethical standards laid down in the 1964 Declaration of Helsinki.
Subject characteristics for our 13 young (5 males, 8 females) and 11 elderly (6 males, 5 females) are summarized in Table 1. Although we attempted to match our young and elderly by education level (young = 15.0 years, elderly = 15.9 years), our elderly group performed better (P < 0.001) on the Wechsler Adult Intelligence Scales. The elderly had significantly higher scores for both the Verbal (P < 0.005) and Performance Scales (P < 0.008). Since the DMS task used in the current neuroimaging study is a visual memory test, the Rey–Osterrieth Figure was also administered. There were no significant differences in the raw scores between age groups for immediate and delayed recall of the Rey Figure. Significant differences were evident for the age-corrected percentile scores showing the elderly as performing significantly better for immediate and delayed recall (F = 14.22, P < 0.001; F = 12.79, P < 0.002). This result suggests that the age correction may have been too great for our group of healthy elderly. The COWA test, the total score on verbal fluency, did not reveal age-related differences, but our elderly did perform significantly worse on the Digit Symbol scale of the WAIS-R (P < 0.0003), consistent with other studies revealing general slowing in the elderly.
Table 1.
Subject characteristics
| Age | Edu | VIQ | PIQ | FSIQ | MMSE | IR Rey | DR Rey | COWA | Digit Symbol |
|---|---|---|---|---|---|---|---|---|---|
| 24.3 (13) | 15.0 (0.36) | 99.6 (3.09) | 103.4 (5.2) | 101.1 (3.64) | 28.3 (0.41) | 21.3 (1.64) | 20.6 (1.68) | 47.4 (3.44) | 11.6 (0.73) |
| 71.85 (11) | 15.9 (1.11) | 115.8 (4.01) | 121.0 (2.55) | 120.1 (3.74) | 28.5 (0.37) | 20.1 (2.16) | 18.6 (1.95) | 48.3 (4.11) | 6.8 (0.65) |
| P < 0.005 | P < 0.008 | P < 0.001 | P < 0.0003 |
Means and standard error of means, in parentheses. Edu = years of education; VIQ = Verbal IQ, PIQ = Performance IQ; FSIQ = Full Scale IQ; MSE = Mini Mental State Exam; IR Rey = immediate recall of the Rey– Osterrieth Figure raw scores; DR Rey = delayed recall of the Rey– Osterrieth Figure raw scores; COWA = controlled oral word association (verbal fluency); Digit Symbol from the WAIS-R.
Walsh Function stimuli (Richmond and Optican, 1987), composed of 8 × 8 matrices of black and white squares, subtended a visual angle of <3° (see Fig. 1). Each member of Walsh Function stimuli has an equal amount of black and white, allowing for equal luminance across the stimulus set. Although the spatial frequency varies across the 64 stimulus set, DMS choice pairs were chosen to be within a small and medium range of spatial frequencies to create different levels of difficulty. A Sample stimulus was presented in the central visual field for 1 s. A second stimulus (Match/Non-match) was presented 2.4 s after the offset of the first stimulus for 1 s. Subjects were asked to press a mouse button with the right index finger in response to the Match stimuli. The delay between trials was 2 s. The stimuli were presented in three fifteen-minute blocks to provide rest breaks. In the active task, the probability of a match was 0.33 and the probability of a Non-match was 0.67. Two-hundred and fifty sample stimuli were presented. We only examined responses to the Non-match stimuli (168 trials), stimuli to which no behavioral response was required. The unequal probability of Match and Non-match stimuli provided a shorter overall duration of the study while still providing sufficient number of trials for good signal-to-noise ratio (SNR). The same stimuli were presented in a passive viewing task as a control condition. Subjects were instructed to maintain fixation on cross-hairs on the screen while the visual patterns were presented. The passive condition was always presented before the active task since it was difficult to ignore the Walsh patterns after having been tested on the active task. Note that there was a delay in the LCD projector of 30 ms between the arrival of the visual stimulus information and presentation on the screen. This delay has been accounted for in the waveform and timecourse data (that is, the trigger time has been shifted by 30 ms).
Fig. 1.
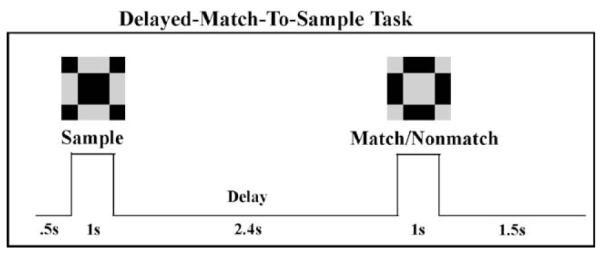
Experimental design. Subjects were asked to press a button with the right thumb in response to the Match stimuli. The same stimuli were presented in a passive viewing task as a control condition.
Neuromagnetic fields were recorded with a Neuromag 122-channel whole-head system at the New Mexico VA Healthcare System in Albuquerque. Subjects were seated comfortably in a chair inside a magnetically shielded room (IMEDCO, Switzerland) while engaged in the DMS task. The MEG responses were digitized at 300 Hz with a passband of 0.03–100 Hz. Continuous data were acquired which was also averaged across 3-second epochs to Sample, Match, and Non-match stimuli. Behavioral responses were not made to Sample or correct Non-match conditions; therefore, premotor and motor responses did not contaminate the data evoked by either of these conditions. EOG electrodes were attached below the right eye and above the left eye in order to monitor blinks and vertical eye movements. Trials with excessive shifts in eye position were eliminated from analysis.
Anatomical MRIs were acquired on a Picker Edge 1.5-T Scanner at the Neuroimaging Center, VAMC, Albuquerque. A head coil was used with head position supported with foam head supports. The head position in the scanner was oriented using laser sources. The MRI and MEG coordinate systems were reconciled by identifying the same anatomical reference features for both MEG measures and MRI scans using a software provided by Neuromag. A 3-D digitizer (Polhemus) registered the subject’s nasion and left and right preauricular points for purposes of establishing a 3-D coordinate head frame, as well as additional points along the surface of the face and head for registering the 3-D coordinate system with the MRIs. The MEG sensors recorded the low amplitude current passed through small coils glued to the scalp in order to establish the location of the head relative to the MEG sensors embedded in the helmet.
Data preprocessing
All of the data were preprocessed using MEGAN (MEG ANalysis), an MEG data visualization and analysis tool developed by E. Best in the Biophysics Group, Los Alamos National Laboratory. Channels with flux jumps or large amplitude responses found in only one channel (e.g., drift) were removed since a large response in a single channel, given the close proximity of channels in the 122-channel array, is unlikely to originate from the brain. A notch filter (58–62 Hz) was applied to the data to eliminate 60 Hz emanating from the projector and other electrical equipment located outside the shielded room. We note that studies which do not use similar high-pass-filter settings (e.g., 0.03) may not witness the “slow-wave” activity.
Source localization and statistical methods
Sources were modeled as equivalent current dipoles using a multi-dipole, spatio-temporal analysis approach. The time interval of 20–870 ms poststimulus was analyzed for all task conditions. We developed and used the automated Multistart Downhill Simplex Method for determining source locations, strengths, and magnitudes (Huang et al., 1998; Aine et al., 2000). Nelder and Mead’s (1965) downhill simplex search was utilized along with the Sarvas (1987) formula for forward calculations. There are two primary reasons for using automated algorithms. First, the user does not need to provide the software with initial starting parameters (guesses). Second, Multistart analyzes thousands of fits to the data, as opposed to a single fit, enhancing the probability of obtaining adequate solutions. The adequacy of the solution derived from a single least-squares fit is dependent upon how close the starting parameters or guesses are to the actual locations; therefore, it is beneficial to have many different starting locations. Other details of the analysis procedure discussed below concern the model and number of sensors utilized in the least squares algorithm, along with the cost function. Data from all or most sensor locations (excluding channels with flux jumps or artifact) were used in the fully unconstrained spatio-temporal fits (for example, candidate solutions were not fixed in location nor constrained by realistic head geometries determined via MRI), using a rotating dipole model. In order to reduce the number of parameters in each search, the estimation of time invariant parameters (locations) was conducted first, using nonlinear least squares minimization, followed by linear estimation of the associated time varying parameters (source magnitudes) (Mosher et al., 1992). The cost function we adopted in the minimization procedure (i.e., minimizing the difference between the measured magnetic field distribution and the magnetic field calculated for an assumed model) is the χ2 where the noise estimated for each sensor location is taken into consideration. Specifically, we used the reduced chi-square value which is χ2 divided by the number of degrees of freedom (Bevington, 1969; Supek and Aine, 1993; Huang et al., 1998).
A singular value decomposition was performed on the data for the time interval of interest (20–870 ms) to aid the investigator in determining the number of active sources likely to be present in the data (Press et al., 1992). The value obtained from the SVD curve represents a minimum number of independent source topographies since SVD cannot resolve the existence of synchronous activity (that is, the only difference between the two timecourses is a scaling factor) (De Munck, 1990; Berg and Scherg, 1994). Consequently, a number of different source models (e.g., models with 5–8 dipoles), centered on the break in the SVD curve (i.e., visual inspection of the separation between signal and noise values), were evaluated. For example, if the SVD curve suggests 6 independent topographies for the time interval of interest, we would instruct the algorithm to search for 5–7 sources of activity from within the head volume. Ten thousand starting values for the dipole parameters (i.e., source location in x, y, and z coordinates, dipole moment, and orientation) were randomly selected from a predefined head volume for each dipole fit attempted (e.g., for each 5-, 6-, and 7-dipole models). A chi-squared minimization was performed for each of the 10,000 starting parameters. These methods have been tested previously using computer simulations and in numerous empirical studies (Huang et al., 1998; Aine et al., 2000, 2005; Stephen et al., 2003).
Multivariate and univariate ANOVAs and Pearson correlations were utilized for assessing the statistical significance of the results. Details of the analysis procedures can be found in Aine et al. (2003) and (2005). All amplitude measures, relative to the prestimulus baseline, and latency measures were taken at the three identifiable peaks in the response profiles (e.g., ~70 ms, ~130 ms, and ~360 ms of timecourses of the sources localized to medial occipital cortex). The maximum peak latencies were successively longer across higher-order cortical regions (e.g., maximum peak latencies were 88 ms, 185 ms, and 495 ms in dorsolateral prefrontal cortex). The factors submitted to the ANOVA tests consisted of Task (Encoding, Recognition Memory, control); Age (Young and Elderly); and Gender (Male and Female). Sources were ordered by frequency of occurrence, and those that occurred less than 50% of the time were eliminated as not providing enough data for analysis.
Anatomical MRI and morphometric procedures
Two T1-weighted sequences were acquired for examining anatomic detail: (1) RF-FAST (Picker) 3-D sagittals (TR = 15 ms, TE = 4 ms, Flip Angle = 25, FOV = 25.6, Matrix Size = 256 × 128); and (2) T1 sagittals (TR = 450 ms, TE = 8 ms, Flip Angle = 90, FOV = 24, Matrix Size = 256 × 128). We classified tissue (GM, WM, and CSF) within each lobe from the MRI scans of our young and elderly subjects using BRAINS2 (Magnotta et al., 1999). T1 images were realigned in a standard orientation which requires lining up the central fissure. This sets the alignment in the coronal and axial planes. In addition, the anterior commissure (AC) and posterior commissure (PC) were used for the horizontal orientation in the sagittal plane. This alignment defines an affine transformation matrix consisting of rotations and translations to reorient the brain. The image was re-sampled to this new orientation and re-sliced to an isotropic resolution of 1.0 mm. Automated Talairach-region-based structure identification for definition of major brain regions, including frontal, temporal, parietal, occipital, subcortical, ventricles, and cerebellum, was conducted (Andreasen et al., 1996). This method relies on a piecewise linear transformation of the Talairach grid onto the area of interest. The Talairach atlas is manually defined by selecting landmarks for right-most extent of the brain, left-most extent of the brain, anterior-most extent of the brain, posterior-most extent of the brain, superior-most extent of the brain, inferior-most extent of the temporal lobe, and AC and PC locations. Because this protocol only scanned subjects with a T1 sequence, we utilized a FMRIB Software Library (FSL) bias field correction to remove image intensity inhomogeneities (http://www.fmrib.ox.ac.uk/fsl). Next, on the bias field corrected images, we employed a discriminant analysis method that uses an automated approach to the identification of training classes (Harris et al., 1999). This method identifies the training classes automatically by selecting a large number of samples of brain tissue with sufficiently low variance and randomly placed throughout the brain (i.e., “plugs”). These plugs were then used in the discriminant analysis in order to classify tissue throughout the brain into GM, WM, and CSF. An Artificial Neural Network (ANN) trained to define whole brain was applied on the resulting tissue classified image (Magnotta et al., 1999). The whole brain ANN was manually trimmed by a reliable human for validity. Finally, Talairach-based lobar tissue classified volumes (GM, WM, and CSF) were summarized within the boundary of the trimmed whole brain for both hemispheres within each of the major regions automatically defined by the applied Talairach atlas.
Results
There was no significant effect of Age or Gender in the percentage of correct responses [young females = 87.8% (SEM = 3.0), elderly females = 88.1% (SEM = 3.8), young males = 87.8% (SEM = 4.3), and elderly males = 85.5% (SEM = 5.1)]. The performance levels indicate that this task was not easy for any group of subjects. Reaction times (RTs) revealed a main effect of Gender (F = 4.74, P = 0.04). Females responded more slowly in this task [young females = 742 ms (SEM = 41.5), elderly females = 753 ms (SEM = 73.1), young males = 662 ms (SEM = 38.6), and elderly males = 627 ms (SEM = 38.1)]. Although the Digit Symbol subtest was notably poorer for the elderly compared to the young, suggesting slower responses, elderly males and females did not respond slower than the young (i.e., no significant difference).
Representative MEG waveforms for one subject are shown in response to Sample stimuli for the active versus passive tasks (see black and red tracings in Fig. 2, respectively). The overlaid tracings at each of the 122 sensor locations reveal differences in amplitude between active and passive tasks at some sensor locations, particularly over occipito-temporal and parietal regions.
Fig. 2.

MEG waveforms. This polar plot, viewed from the top down, contrasts averaged waveforms (250 individual responses) evoked by the “Sample” stimuli during the active DMS task (black tracings) and for the passive or control task (red tracings). The frontal sensors are located toward the top of plot, and the left hemisphere is depicted on the left side of the plot. The scale at the upper left portion of the figure denotes the x and y scales of the individual channel waveform plots. The time scale shown is from −100 to 1500 ms. The y axis is in fT. The numbers printed to the left of the waveforms represent sensor numbers.
Timecourse information for six cortical regions was calculated and evaluated for Encoding, Delayed Recognition, and Control conditions. Fig. 3 shows averaged timecourse information, across age groups, for 6 cortical areas evaluated; three of these regions revealed significant differences as a function of task instruction (see asterisks). Three identifiable peaks in the response profiles, from which all amplitude and latency measures were taken, are shown for the medial occipital response (MO) in the upper right panel (P1, P2, and P3). We were able to localize activity to medial occipital regions in all subjects for all stimuli. Note the gradual increase in latency for P2 from sensory cortical regions (MO) to association regions (lateral occipital gyrus or LOG; medial parietal or MP; and supramarginal gyrus or SMG) on up to prefrontal regions (dorsolateral prefrontal cortex or DLPF and anterior cingulate or AC). The MRIs at the right reveal the different cortical locations (MO, LOG, MP, SMG, DLPF, and AC) from which the timecourses were derived. DLPF, SMG, and LOG regions are shown for 2 different subjects. In general, response profiles localized to LOG and DLPF cortex were highly influenced by task instruction. Note also that each condition activated the same 6 cortical areas as shown by the superposition of colored symbols. Grady et al. (2006) discussed a similar finding using fMRI methods.
Fig. 3.

MEG source timecourses. The 6 brain regions evaluated (MO, LOG, MP, SMG, DLPF, and AC) are displayed in the MRIs at the right of the figure. Timecourses within each region were averaged across young and elderly subjects for each of 3 task conditions. The left column shows timecourses evoked by the Control stimuli (red tracings) superimposed on averaged timecourses evoked by Sample stimuli (Encoding = blue tracings). The right column shows timecourses evoked by the Control stimuli (red tracings) superimposed on averaged timecourses evoked by Non-match stimuli (Delayed Recognition Memory = blue tracings). Asterisks located by the region label on the y axis indicate brain regions that were significantly affected by task instruction. For each subject, 250 individual neuromagnetic responses were averaged together in response to Sample stimuli and 168 individual responses were averaged together in response to Non-match stimuli. A range of significance probabilities for the main effect of Task and Task × Region interactions are shown above.
Table 2 shows the amplitude and latency measures for each cortical region examined and for each task. The amplitude of Peak 2 localized to LOG, for example, was approximately 3 times greater when subjects were engaged in the memory tasks, compared to the Control condition. In contrast, AC was fairly constant throughout the different tasks (i.e., the amplitude measures for each Peak did not differ significantly across stimulus conditions). The initial latency values nicely show a gradual lengthening of peak latency from lower visual levels through parietal and prefrontal cortex (e.g., Peak 1 latencies in response to Sample stimuli during encoding reveal a linear increase from MO through AC regions).
Table 2.
Mean amplitudes and latencies across cortical regions and standard errors of the mean (SEM)
| Region | Peak 1 |
Peak 2 |
Peak 3 |
||||||
|---|---|---|---|---|---|---|---|---|---|
| Control | Encoding | Recognition Memory | Control | Encoding | Recognition Memory | Control | Encoding | Recognition Memory | |
| Amplitude (nA-m) | |||||||||
| MO (SEM ±) | 9*(1.2) | 20 (3.3) | 18 (2.3) | 19* (2.4) | 40 (5.2) | 40 (3.8) | 20 (3.2) | 26 (3.4) | 31 (5.1) |
| LOG | 5a(1.1) | 19a (4.1) | 12a (4.0) | 13* (2.6) | 47 (6.5) | 37 (5.0) | 12* (1.8) | 27 (4.1) | 22 (4.0) |
| SMG | 15 (2.7) | 19 (4.1) | 17 (3.7) | 35 (4.0) | 26 (7.1) | 46 (8.9) | 44 (6.1) | 36 (9.8) | 37 (6.9) |
| MP | 36 (6.8) | 32 (6.3) | 33 (11.7) | 66 (13.4) | 82 (16.9) | 90 (26.1) | 64 (8.9) | 76 (11.3) | 68 (15.6) |
| DLPF | 7 (1.2) | 12 (2.0) | 13 (2.9) | 13* (1.9) | 34 (7.5) | 28 (5.2) | 18 (3.2) | 28 (4.8) | 24 (3.8) |
| AC | 14 (4.9) | 10 (1.8) | 13 (3.2) | 16 (3.7) | 24 (6.6) | 27 (7.3) | 31 (7.0) | 32 (6.3) | 33 (12.9) |
| Latency (ms) | |||||||||
| MO | 71 (3.8) | 74 (2.4) | 73 (3.1) | 138 (5.8) | 128 (3.6) | 129 (4.3) | 377 (33.1) | 364 (30.3) | 270* (16.7) |
| LOG | 67 (5.5) | 75 (3.8) | 73 (4.1) | 143 (7.8) | 149 (6.3) | 156 (8.0) | 403 (47.1) | 360 (26.1) | 337 (19.1) |
| SMG | 77 (5.3) | 78 (5.0) | 81 (6.1) | 190 (10.8) | 180 (9.4) | 191 (11.2) | 385 (28.6) | 412 (25.8) | 377 (30.4) |
| MP | 89 (8.6) | 82 (4.1) | 97 (6.8) | 191 (10.5) | 173 (12.8) | 187 (14.4) | 413 (43.9) | 397 (31.6) | 400 (42.7) |
| DLPF | 93 (5.1) | 88 (7.3) | 84 (6.6) | 177 (9.8) | 179 (10.4) | 203 (10.0) | 546 (42.2) | 455 (49.5) | 483 (44.9) |
| AC | 91 (7.3) | 89 (6.0) | 88 (7.0) | 163 (10.7) | 198 (13.6) | 197 (8.9) | 634 (64.2) | 489 (46.1) | 445 (48.9) |
MO = medial occipital, LOG = lateral occipital gyrus, SMG = supramarginal gyrus, MP = medial parietal, DLPF = dorsolateral prefrontal, AC = anterior cingulate.
Indicates all means are significantly different as a function of Task.
Indicates significant difference (at least at P < 0.05) between this mean and the other two means associated with the different stimulus conditions.
Correlations between the neuropsychological measures and physiological measures were computed in hope of shedding some light on the nature of the activity in these different cortical areas. Correlations for the amplitude measures during Encoding and Delayed Recognition are highlighted in Table 3. Area MO correlated most with visual perceptual processes and Performance IQ. For example, the MEG activity around 129 ms during Delayed Recognition correlated with visual memory related to recall of the Rey–Osterrieth Complex Figure (i.e., immediate and delayed recall—P = 0.03 and P = 0.04, respectively). During this same period of time, Performance IQ correlated with amplitude as well (P = 0.02). Correlations for the next level in the visual system, LOG, were quite inconsistent due to complex interactions between age and gender (denoted by an asterisk); consequently, this area was examined more carefully as discussed below. For Delayed Recognition, higher-order areas (MP, SMG, and DLPF) were correlated primarily with measures of Verbal and Full Scale IQ. Of special interest is that DLPF and SMG regions revealed the earliest correlations with Verbal and Full Scale IQ (82–84 ms) followed by MP (97–400 ms), whereas late activity in MO was correlated with Performance IQ (129 ms). Behavioral performance measures such as percent correct were negatively correlated with DLPF activity (i.e., lower amplitudes in DLPF correlate with higher percent correct on the task) during encoding while RTs were correlated with AC latency measures for the Recognition task (i.e., the shorter the peak latency around P2, the longer the RTs).
Table 3.
Pearson correlations between neuropsychological test results and MEG measures
| Region | Encoding (amplitude measures) | Recognition Memory (amplitude measures) |
|---|---|---|
| MO | 74–364 ms IR Raw Score
Rey r = 0.44 to r = 0.46, P = 0.04 to P = 0.03 DR %Correct Rey r = 0.42 P = 0.05 |
129 ms Performance
IQ r = 0.48, P = 0.02 IR and DR %Correct Rey r = 0.47 P = 0.03, r = 0.43 P = 0.04 |
| LOG | * | * |
| MP | 82–173 ms REY Copy
Time r = −0.71 to r = −0.91, P = 0.02 to P < 0.0001 |
97–400 ms Verbal and Full Scale
IQ r = 0.64 to r = 0.76, P = 0.05 to P = 0.01 |
| SMG | 78–412 ms
Similarities r = −0.54 to r = −0.74, P = 0.05 to P = 0.002 |
82–377 ms Verbal, Performance, and Full
Scale IQ r = 0.55 to r = 0.75, P = 0.05 to P = 0.003 |
| DLPF | 88 ms Percent Correct on
Task r = −0.77, P = 0.004 |
84–483 ms Verbal and Full Scale
IQ r = 0.63 to r = 0.84, P = 0.05 to P = 0.002 |
| AC | 89–489 ms Verbal
IQ r = −0.61 to r = −0.67, P = 0.04 to P = 0.03 |
[Latency measure at 197 ms—RTs on
Task r = −0.70, P = 0.02] |
IR Raw Score Rey = immediate recall of the Rey– Osterrieth Complex Figure Test; Rey Copy Time = time taken to reproduce the Rey– Osterrieth Figure; IR/DR %Correct Rey = percent correct on immediate and delayed recall of Rey–Osterrieth Complex Figure Test; Similarities = Similarities Scale on WAIS-R; Verbal, Performance, and Full Scale IQ are from the WAIS-R.
These results were inconsistent due to age and gender effects (see below).
Multivariate age-related effects evoked by the Sample and Non-match stimuli (during the Match task) are shown in Fig. 4. In general, the same progressive shift in latency can be seen across brain areas. However, consistent with the Digit Symbol task of the WAIS-R, the latency of the initial peak (P1) in MO and LOG was delayed relative to the young (see single asterisk—main effect of age). This result reveals general slowing in the responses of the elderly. In addition, the elderly revealed greater amplitudes than the young during some of the tasks (F = 4.66, P < 0.01: see “+” in upper left panel of Fig. 4), with the most notable differences in SMG, DLPFC, and AC during the Delayed Recognition Memory condition. This result is consistent with other studies reporting a posterior-to-anterior shift (or ventral-to-dorsal) in young relative to elderly (Grady et al., 2003; Meulenbroek et al., 2004) which is interpreted as reflecting the additional recruitment of dorsolateral prefrontal regions to facilitate memory (compensation). However, as pointed out previously, our elderly did not perform worse than the young, similar to many other studies. MO and LOG regions, however, did not reveal reduced amplitudes for elderly compared to the young as suggested by Cabeza et al. (2004) and Grady et al. (2006).
Fig. 4.

Age-related differences across tasks. Timecourses averaged across the young subjects (red tracings) are shown superimposed on timecourses averaged across elderly subjects (blue tracings) for Encoding (left column) and Recognition tasks (right column). Asterisks noted in the upper left and right panels indicate points in time where significant age-related differences were found across tasks and brain regions. The double asterisks noted for location LOG indicate a significant latency difference for Peak 3 (compare red double asterisks versus blue double asterisks). The “+” indicates a significant Peak 2 amplitude difference between young and elderly, depending upon the task. The key below indicates the significance of these age-related effects.
To our surprise, the LOG region revealed highly significant age-related effects. First, the elderly revealed greater initial amplitudes for Peak 2 (Peak 2 is denoted by a “+” shown on the MO plot) during the Recognition task (see second row and column of Fig. 4: F = 4.66, P < 0.01), similar to our auditory study (Aine et al., 2005). Second, the maximum peak latency of the 3rd peak is quite late for the elderly, relative to the young (compare double red asterisks vs. double blue asterisks). In general, the timecourses for this region appear qualitatively different for the young and the elderly.
When we examined the correlations between neuropsychological, behavioral, and neuromagnetic activity in this region, again, qualitative differences in the patterns of correlations were noted between the two age groups. Correlations for the young, according to Table 4, cluster around visual memory (immediate and delayed recall on the Rey Figure) and Performance IQ, particularly for early activity in LOG (P2). Correlations with Full Scale IQ (during Recognition) were evident later in time (P3). Comparisons between MEG measures and behavioral performance indicated that low amplitude early activity during Encoding correlated with better accuracy for the young. In addition, lower amplitudes at P3 for the young correlated with shorter RTs. In contrast, during Encoding for elderly group, high amplitude responses at P3 correlated positively with accuracy in the Recognition task. We note a similar dissociation between patterns of activity for young versus elderly groups presented by Rypma and D’Esposito (2000), although their results referred to activity in DLPF and AC.
Table 4.
Correlations between neuropsychological test results and LOG response profiles
| Young | Encoding |
|---|---|
| P1 Amp × Correct on Task
r = −0.64, P =
0.03—Elderly r = 0.63, P =
0.09 P2 Amp × Correct immediate recall (Rey) r = 0.71, P = 0.02—Elderly r = 0.45, P = 0.26 P2 Amp × Correct delayed recall (Rey) r = 0.79, P = 0.006—Elderly r = 0.39, P = 0.34 P2 Latency × delayed recall (Rey) Time r = −0.81, P = 0.005—Elderly r = 0.82, P = 0.01 P3 Amp × RTs r = 0.68, P = 0.01—elderly r = −0.48, P = 0.23 P3 Amp × Age r = 0.60, P = 0.04—elderly r = 0.74, P = 0.04 |
|
| Elderly | Encoding |
| P2 Latency × Vocabulary (WAIS-R)
r = 0.88, P = 0.001—Young
r = −0.19 P =
0.60 P3 Latency × Vocabulary (WAIS-R) r = 0.92, P = 0.001—Young r = −0.61, P = 0.06 P3 Latency × Verbal IQ r = 0.75, P = 0.03—Young r = −0.30, P = 0.41 P3 Latency × Full Scale IQ r = 0.75, P = 0.03—Young r = −0.13, P = 0.71 P3 Amp × %Correct on Task r = 0.69, P = 0.05—Young r = −0.20, P = 0.53 P3 Amp × Age r = 0.74, P = 0.04—Young r = 0.60, P = 0.04 |
|
| Young | Delayed Recognition Memory |
| P2 Amp × Performance IQ
r = 0.75, P = 0.04—Elderly
r = −0.29, P =
0.44 P2 Amp × Correct immediate recall (Rey) r = 0.86, P = 0.01—Elderly r = 0.03, P = 0.93 P2 Amp × Correct delayed recall (Rey) r = 0.77, P = 0.04—Elderly r = 0.12, P = 0.75 P3 Amp × Correct immediate recall (Rey) r = 0.96, P = 0.0005—Elderly r = 0.41, P = 0.27 P3 Amp × Correct delayed recall (Rey) r = 0.85, P = 0.01—Elderly r = 0.30, P = 0.43 P3 Amp × Full Scale IQ r = 0.80, P = 0.03—Elderly r = −0.62, P = 0.08 P3 Amp × RTs r = 0.70, P = 0.04—Elderly r = −0.51, P = 0.16 P3 Latency × Performance IQ r = −0.82, P = 0.02—Elderly r = −0.18, P = 0.64 P3 Latency × Full Scale IQ r = −0.77, P = 0.04—Elderly r = −0.10, P = 0.80 |
|
| Elderly | Delayed Recognition Memory |
| P1 Latency × Vocabulary (WAIS-R)
r = 0.81, P = 0.008—Young
r = 0.36, P = 0.42 P2 Latency × Vocabulary (WAIS-R) r = 0.73, P = 0.02—Young r = −0.01, P = 0.97 P2 Latency × Verbal IQ, r = 0.66, P = 0.05—Young r = −0.36, P = 0.42 P3 Amp × Verbal IQ r = −0.71, P = 0.03—Young r = 0.38, P = 0.39 P3 Amp × Age r = 0.82, P = 0.006—Young r = −0.38, P = 0.31 |
Qualitatively different patterns of correlations can be seen between Young and Elderly Age groups in LOG.
In our study, the types of neuropsychological tests that correlated with the MEG measures for our elders were verbal in nature, suggesting that our elders may have been attaching verbal labels to the stimuli rather than using a “posterior” visual strategy of retaining the images in mind. Supporting this interpretation is the fact that elders reveal higher amplitude responses in the frontal regions which correlate more with Verbal IQ measures (Table 3). This probably explains why the latency of P3 in LOG was late for both Encoding and Recognition tasks in the elderly, relative to the young (Fig. 4).
In an attempt to better understand the neural underpinnings of these qualitatively different patterns of activity and neuropsychological test results, we classified tissue types from the MRIs (GM, WM, and CSF) for our young and elderly. We also classified tissue on 9 adults in an intermediate age range (31–43 years) in order to characterize the shape of the functions. These 9 adults had MRIs from other MEG studies. First, our elderly had significantly lower normalized GM and WM volumes in frontal regions than our young (P < 0.004 for GM and P < 0.0002 for WM). Second, GM volumes revealed a decline across age groups, except for left temporal cortex where the elderly revealed greater GM volume (young vs. elderly P < 0.02; elderly vs. middle-aged P < 0.007). But, we found an inverted U-shaped function for frontal WM (see Fig. 5—young and elderly were at the two extremes, P < 0.0001, with our 31–43 year old subjects showing maximal WM volume, P < 0.00005 for middle-aged vs. elderly and P < 0.02 for middle-aged vs. young), similar to the total WM volume results shown recently by Sowell et al. (2003) and by the prefrontal WM changes shown in a longitudinal study by Raz et al. (2005). This result, along with more comprehensive results presented by Raz and Sowell, suggests that WM maturation continues well into middle age.
Fig. 5.
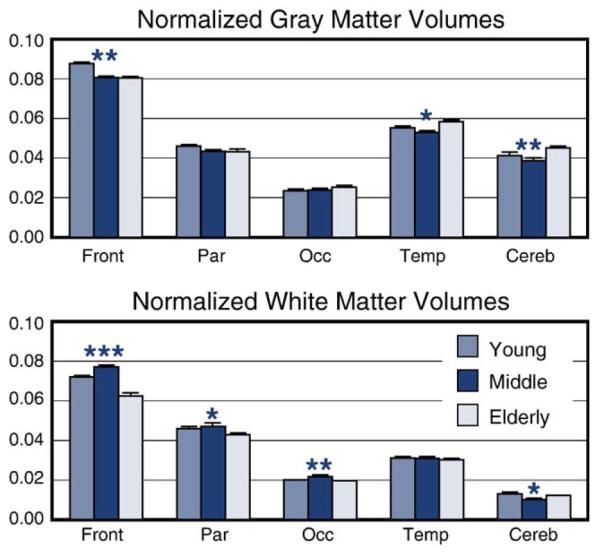
GM and WM tissue classification of 5 brain regions. Tissue was classified for 11 young and 9 elderly involved in the visual DMS study (blue and yellow bars, respectively). We also classified tissue from 9 additional subjects in a middle-age range (31–43 years) in order to characterize the shape of the functions (red bars). In these graphs, left and right hemisphere results were averaged together before correlations were conducted. The values shown in this figure are normalized to the whole brain.
Other interesting age-related differences were evident which converged with MEG and neuropsychological results. For example, the MEG data showed large differences in Peak 3 latencies, with young subjects revealing shorter Peak 3 latencies (see LOG Fig. 3, double asterisks). The morphometric results indicate that young subjects with shorter peak 3 latencies in MO cortex and LOG had higher GM volumes in the occipital lobe (r = −0.57, P < 0.05; r = −0.77, P < 0.02). Elder adults with shorter Peak 1 latencies in MO cortex (see lower left panel of Fig. 4) and Peak 3 latencies in the LOG had less WM volume in the occipital lobe (r = 0.72, P < 0.02; r = 0.75, P < 0.05). As mentioned previously, the MEG results also showed a main effect of age on Peak 1 latency in MO and LOG (i.e., slower latencies for elderly, F = 4.35, P < 0.04, Fig. 4 single asterisk). It appears that greater WM volume in occipital regions is associated with a delay in neural activity in this region for the elderly during the DMS task. On the other hand, Fig. 6 (top) shows that greater WM volumes in the temporal lobes of the elderly correlated with Verbal IQ (r = 0.76, P < 0.02) and years of education (bottom; r = 0.68, P < 0.05) while GM volume in this region correlated with performance IQ (r = 0.73, P < 0.05).
Fig. 6.

Correlations between subject characteristics of the elderly and WM volumes. WM volumes in the temporal lobes correlated with IQ (top) and years of education in the elderly group only (bottom).
Discussion
Our results indicate: (1) no differences in behavioral performance measures between the young and elderly, but significant differences in the MEG and morphometric measures and their correlations with neuropsychological test results and behavioral performance measures; (2) although there was a main effect of age on the latency of the initial peak in primary/secondary cortex and LOG (Fig. 4, see * for medial occipital, MO, responses), consistent with an interpretation of age-related slowing, these longer latencies were not correlated with the performance (accuracy and speed) of the elderly on the DMS task; (3) age-related effects were noted in higher-order brain regions (e.g., LOG, SMG, DLPFC, and AC) showing higher amplitudes in general for the elderly, particularly for the Recognition Memory task in regions typically associated with linguistic processing (including sub-vocal processing); (4) the patterns of correlations between MEG responses and neuropsychological tests (Table 4) suggest that young and elderly were using two different strategies to perform this task (that is, the young relied on posterior brain regions, while the elderly relied on DLPFC and SMG regions, reminiscent of the phonological store; Henson et al., 2000); and (5) the morphometric results revealed an inverted U-shaped function for WM volume in frontal cortex (Fig. 5) similar to recent results presented by Raz et al. (2005). In the latter case, we also note a similarity in inverted U-shaped functions for performance on an assortment of verbal cognitive tasks (verbal memory, verbal ability, etc.) examined in the Seattle Longitudinal Study (Schaie, 1994).
Two aspects of the developmental literature suggest that the qualitative differences seen in the MEG data are most likely due to strategy differences learned as a function of brain maturation. First, as children age, they switch from relying on visuospatial strategies to using the phonological loop to recode visual inputs into phonological form via rehearsal (Gathercole et al., 2004). Postle (2006) proposed that humans automatically recode information about features of visually perceived stimuli into a verbal code and that this verbal code is retained as part of the short-term memory representation of the stimulus. This is similar to Paivio’s dualcoding theory where a visual stimulus activates linguistic and visual codes in parallel (Paivio, 1986) and Wickens’ (1973) multiple encoding theory. Baddeley et al. (2001) noted that when subjects are engaged in working memory tasks they spontaneously cue themselves by silently repeating cues (inner speech). Inner speech, as viewed by Luria (1959), is a way of regulating one’s own behavior (i.e., verbal control of executive processes). Indeed, several investigators have noted upon debriefing of subjects that verbal coding of stimuli is a natural strategy often employed during working memory tasks (Nystrom et al., 2000; Walter et al., 2003). Rehearsal or inner speech becomes well-automatized during adulthood and is conceptualized as a useful strategy to activate/retrieve currently relevant task-set representations (Emerson and Miyake, 2003; Kray et al., 2004). Tun et al. (1998) further suggest that older adults conserve their attentional resources by using gist-based strategies (i.e., linguistic abstraction). When young subjects were encouraged to use gist-based retrieval strategies, they were just as quick to make false recognitions regarding the details of items as did the elders. Therefore, it is possible that these significantly different anatomical and neural activation patterns may be due to the continuation of maturational processes in the young group, in addition to senescent processes in the elderly group. Physiological correlations with neuropsychological and behavioral results, showing opposite correlations between the young and elderly, have been reported previously (Grady et al., 2003). For example, Rypma and D’Esposito (2000) showed that fast young subjects had less DLPF and AC activation during retrieval than slow younger subjects, whereas older adults showed the opposite pattern. Therefore, differing patterns seen in the elderly need not only be viewed as reflecting deleterious effects of aging but rather may be considered as a learned and effective strategy, associated with normal maturational processes.
Second, although much emphasis has been placed on the linear decrease of GM volume with age, there is a concurrent increase in WM volume with age that should be taken into consideration as well. A review of the maturation/atrophy rates of GM volumes using stereological and magnetic resonance methods uniformly shows a gradual linear decrease in cortical GM volume with age beginning after the ages of 12 and 16 years, when GM volume peaks in the frontal and temporal lobes, respectively (Giedd et al., 1999; Bartzokis et al., 2001). This fact most likely led many to believe that brain function steadily declines after adolescence. In contrast, much less attention has been paid to WM volumes and myelination, which directly affects neural transmission speed. WM volumes progressively increase from 19 years of age and are not maximal until ~45 years of age in temporal and prefrontal regions, brain regions reportedly involved in higher cognitive functions (Bartzokis et al., 2001; Sowell et al., 2003). After ~45 years of age, WM volume slowly declines.
Nagy et al. (2004) recently showed that maturation of relatively restricted regions of WM is correlated with the development of specific cognitive functions. They found a double dissociation between the development of working memory capacity which correlated with FA in two left frontal lobe regions and parietal cortex and reading ability which correlated with FA in the left temporal lobe. Deutsch et al. (2005) found that FA in a left temporo-parietal region correlated significantly with behavioral measurements of reading, spelling, and rapid naming performance. That is, lower FA values were associated with lower performance scores. These results, along with results from Beaulieu et al. (2005) and Niogi and McCandliss (2006), further support the hypothesis that the left temporo-parietal neural pathway is necessary for the development of fluent reading and extend the findings of Klingberg et al. (2000) in showing decreased diffusion anisotropy in a left temporo-parietal region for adults with poor reading scores. Taken together, these studies suggest that the gradual maturation of specific fiber tracts correlates with measures of specific cognitive functions. Morphometry and DTI studies have repeatedly revealed left hemisphere asymmetry in WM volumes and tracts in temporo-parietal regions, typically associated with language functions, and in the arcuate fasciculus itself, a fiber bundle connecting Broca’s and Wernicke’s areas (Nucifora et al., 2005).
Two points from our current study are relevant here. First, MEG measures from DLPF cortex and SMG regions, associated with the phonological loop, correlated with a cluster of verbal measures on the neuropsychological tests. Second, WM volumes in the temporal lobe correlated with Verbal IQ scores for the elderly group only. We can conclude from these results that verbal ability is intact in the elderly. Although WM volumes in the frontal lobes were significantly lower for the elderly compared to the young group, our morphometric data for the middle-aged group suggest that WM maturation in the young group was incomplete since the young and elderly groups represented the two ends of the inverted U-shaped function. This fact suggests that accounts of aging that focus on degenerative processes only are incomplete since the dynamic interplay between degenerative and maturational neural changes, along with the consequent effect these changes have on strategies, has been ignored. Future studies need to examine both processes and include DTI since it can provide a better measure of WM integrity for the young and elderly groups in this case.
Olesen et al. (2003) combined data from DTI and fMRI from children (8–18 years) and showed positive correlations between WM maturation (FA measures) and neural activity (BOLD responses) in a number of regions important for spatial working memory and the development of working memory capacity (e.g., fronto-parietal neural system). They hypothesized that neural activity in GM regions would correlate with FA values derived from the WM tracts that connect the GM regions in a neural system. In their study, the maturation of WM tracts (e.g., FA values in the fronto-parietal tract) correlated with an increase in the BOLD response in the superior frontal sulcus and intraparietal sulcus (i.e., GM regions to which WM projects). This same logic for directly relating function to structure could be applied to future MEG studies with the goal of characterizing development of neural systems.
Given that dynamic processes associated with maturation and decline of WM, GM, synaptogenesis, and neurogenesis continue throughout the life span, with different rates of maturation occurring in different regions of the brain, leads one to question the adequacy of comparisons between young and elderly groups for determining age-related effects. Clearly, brain maturation continues beyond the ages of the young subjects (20–29 years) in our study as corroborated by our morphometry results. Unfortunately, we do not have MEG data from an intermediate age group (e.g., 35–45 years) nor do most other studies to definitively determine whether the qualitatively different pattern seen in the elderly data during encoding/recognition tasks reflects “compensatory” mechanisms as suggested in the literature, or maturation, or some combination of the two. We suggest that results from our young reflect a maturational trend where they initially rely on posterior regions and visual strategies in general. Gagnon et al. (2003), for example, indicate that young individuals, relative to the elderly, obtained higher scores on the recall of Rey and Taylor Complex figures, tests of visual memory. Similarly, a posterior-to-anterior shift in neuroimaging data in young relative to elderly has been reported in other studies of aging as well (Grady et al., 2003; Meulenbroek et al., 2004). When we asked our young about the strategy they used, young females in particular seem to focus on the details of the Walsh patterns (e.g., “I looked for patterns within each figure and tried to match them”). We believe that our elderly were more likely to use linguistic labels in order to perform this task since high amplitude activity in DLPF and SMG, regions typically associated with the phonological loop, correlated strongly with Verbal IQ measures (e.g., Vocabulary). In addition, WM volume in the temporal lobes of our elderly correlated with Verbal IQ scores (Fig. 6), unlike our young group, while GM volume of the elderly correlated with Performance IQ.
In summary, we propose that the qualitatively different pattern of brain activity witnessed in the elderly in many studies may reflect the role of inner speech in regulating memory processes in various memory tasks. Raz et al. (2005) also note that the U-shaped trajectory of WM volume suggests different biological phenomena underlying these changes in young and in elderly. These results are consistent with results and interpretations offered by Grady et al. (2003) in showing similar behavioral performance but different networks of activity mediating the DMS task. Our elderly subjects revealed enhanced activity in prefrontal cortex and supramarginal gyrus, brain regions associated with linguistic processing (Grady et al., 1998; Henson et al., 2000). But, our morphometric data suggest that the young have not fully matured since our middle-aged subjects reveal higher WM volumes than either the young or elderly, similar to results by Raz and colleagues. Therefore, the qualitatively different anatomical and physiological brain patterns seen in the elderly need not be viewed as reflecting a compensatory mechanism but may be viewed as a learned effective strategy, associated with normal maturational processes. More direct tests of verbal and nonverbal memory functions in young, middle-aged, and elderly, along with the acquisition of neuropsychological, morphometric, and DTI data for these groups, will enable more conclusive interpretations for age-related effects in episodic memory processes.
Acknowledgments
This work was supported by NIH R01 AG020302-02, VA MERIT Review, the Department of Energy under Award Number DE-FG02-99ER62764 to The MIND Institute, the Research Service at the New Mexico VA Health Care System, the Radiology Department at UNM SOM, and NIH P20 RR15636-03 (Okada, PI). We wish to express our gratitude to Sam Harris, Maria Ashna, and Rebecca Montaño for their image analysis processing work on the project. We are also grateful for the comments provided by the anonymous reviewers.
Footnotes
Available online on ScienceDirect (www.sciencedirect.com).
References
- Aine C, Huang M, Stephen J, Christner R. Multistart algorithms for MEG empirical data analysis reliably characterize locations and time courses of multiple sources. NeuroImage. 2000;12:159–172. doi: 10.1006/nimg.2000.0616. [DOI] [PubMed] [Google Scholar]
- Aine CJ, Stephen JM, Christner R, Hudson D, Best E. Task relevance enhances early transient and late slow-wave activity of distributed cortical sources. J. Comput. Neurosci. 2003;15:203–221. doi: 10.1023/a:1025864825200. [DOI] [PubMed] [Google Scholar]
- Aine C, Adair J, Knoefel J, Hudson D, Qualls C, Kovacevic S, Woodruff C, Cobb W, Padilla D, Lee R, Stephen J. Temporal dynamics of age-related differences in auditory incidental verbal learning. Cogn. Brain Res. 2005;24:1–18. doi: 10.1016/j.cogbrainres.2004.10.024. [DOI] [PubMed] [Google Scholar]
- Aizenstein HJ, Clark KA, Butters MA, Cochran J, Stenger VA, Meltzer CC, Reynolds CF, Carter CS. The BOLD hemodynamic response in healthy aging. J. Cogn. Neurosci. 2004;16:786–793. doi: 10.1162/089892904970681. [DOI] [PubMed] [Google Scholar]
- Andreasen NC, Rajarethinam R, Cizadlo T, Arndt S, Swayze VW, II, Flashman LA, O’Leary DS, Ehrhardt JC, Yuh WT. Automatic atlas-based volume estimation of human brain regions from MR images. J. Comput. Assist. Tomogr. 1996;20:98–106. doi: 10.1097/00004728-199601000-00018. [DOI] [PubMed] [Google Scholar]
- Baddeley A, Chincotta D, Adlam A. Working memory and the control of action: evidence from task switching. J. Exp. Psychol. Gen. 2001;130:641–657. [PubMed] [Google Scholar]
- Bartzokis G. Schizophrenia: breakdown in the well-regulated lifelong process of brain development and maturation. Neuropsychopharmacology. 2002;27:672–683. doi: 10.1016/S0893-133X(02)00364-0. [DOI] [PubMed] [Google Scholar]
- Bartzokis G, Beckson M, Lu PH, Nuechterlein KH, Edwards N, Mintz J. Age-related changes in frontal and temporal lobe volumes in men: a magnetic resonance imaging study. Arch. Gen. Psychiatry. 2001;58:461–465. doi: 10.1001/archpsyc.58.5.461. [DOI] [PubMed] [Google Scholar]
- Beaulieu C, Plewes C, Paulson LA, Roy D, Snook L, Concha L, Phillips L. Imaging brain connectivity in children with diverse reading ability. NeuroImage. 2005;25:1266–1271. doi: 10.1016/j.neuroimage.2004.12.053. [DOI] [PubMed] [Google Scholar]
- Bellamy D, editor. Principles and Practice of Geriatric Medicine. John Wiley and Sons; New York: Mechanism of Ageing. (Pages) [Google Scholar]
- Ben Bashat D, Ben Sira L, Graif M, Pianka P, Hendler T, Cohen Y, Assaf Y. Normal white matter development from infancy to adulthood: comparing diffusion tensor and high b value diffusion weighted MR images. J. Magn. Reson. Imaging. 2005;21:503–511. doi: 10.1002/jmri.20281. [DOI] [PubMed] [Google Scholar]
- Benes FM, Turtle M, Khan Y, Farol P. Myelination of a key relay zone in the hippocampal formation occurs in the human brain during childhood, adolescence, and adulthood. Arch. Gen. Psychiatry. 1994;51:477–484. doi: 10.1001/archpsyc.1994.03950060041004. [DOI] [PubMed] [Google Scholar]
- Berg P, Scherg M. Handbook of BESA: Brain Electric Source Analysis. Version 2.0 MEGIS; Munich: 1994. [Google Scholar]
- Bevington P. Data Reduction and Error Analysis for the Physical Sciences. McGraw-Hill; New York: 1969. [Google Scholar]
- Cabeza R, Anderson ND, Locantore JK, McIntosh AR. Aging gracefully: compensatory brain activity in high-performing older adults. NeuroImage. 2002;17:1394–1402. doi: 10.1006/nimg.2002.1280. [DOI] [PubMed] [Google Scholar]
- Cabeza R, Daselaar SM, Dolcos F, Prince SE, Budde M, Nyberg L. Task-independent and task-specific age effects on brain activity during working memory, visual attention and episodic retrieval. Cereb. Cortex. 2004;14:364–375. doi: 10.1093/cercor/bhg133. [DOI] [PubMed] [Google Scholar]
- De Munck J. The estimation time varying on the basis of evoked potentials. Electroencephalogr. Clin. Neurophysiol. 1990;77:156–160. doi: 10.1016/0168-5597(90)90032-9. [DOI] [PubMed] [Google Scholar]
- D’Esposito M, Deouell LY, Gazzaley A. Alterations in the BOLD fMRI signal with ageing and disease: a challenge for neuroimaging. Nat. Rev., Neurosci. 2003;4:863–872. doi: 10.1038/nrn1246. [DOI] [PubMed] [Google Scholar]
- Deutsch GK, Dougherty RF, Bammer R, Siok WT, Gabrieli JD, Wandell B. Children’s reading performance is correlated with white matter structure measured by diffusion tensor imaging. Cortex. 2005;41:354–363. doi: 10.1016/s0010-9452(08)70272-7. [DOI] [PubMed] [Google Scholar]
- Emerson M, Miyake A. The role of inner speech in task switching: a dual-task investigation. J. Mem. Lang. 2003;48:148–168. [Google Scholar]
- Gagnon M, Awad N, Mertens VB, Messier C. Comparing the Rey and Taylor complex figures: a test–retest study in young and older adults. J. Clin. Exp. Neuropsychol. 2003;25:878–890. doi: 10.1076/jcen.25.6.878.16480. [DOI] [PubMed] [Google Scholar]
- Gathercole SE, Pickering SJ, Ambridge B, Wearing H. The structure of working memory from 4 to 15 years of age. Dev. Psychol. 2004;40:177–190. doi: 10.1037/0012-1649.40.2.177. [DOI] [PubMed] [Google Scholar]
- Giedd JN, Blumenthal J, Jeffries NO, Castellanos FX, Liu H, Zijdenbos A, Paus T, Evans AC, Rapoport JL. Brain development during childhood and adolescence: a longitudinal MRI study. Nat. Neurosci. 1999;2:861–863. doi: 10.1038/13158. [DOI] [PubMed] [Google Scholar]
- Grady CL, Craik FI. Changes in memory processing with age. Curr. Opin. Neurobiol. 2000;10:224–231. doi: 10.1016/s0959-4388(00)00073-8. [DOI] [PubMed] [Google Scholar]
- Grady CL, McIntosh AR, Rajah MN, Craik FI. Neural correlates of the episodic encoding of pictures and words. Proc. Natl. Acad. Sci U. S. A. 1998;95:2703–2708. doi: 10.1073/pnas.95.5.2703. [DOI] [PMC free article] [PubMed] [Google Scholar]
- Grady C, McIntosh A, Craik F. Age-related differences in the functional connectivity of the hippocampus during memory encoding. Hippocampus. 2003;13:572–586. doi: 10.1002/hipo.10114. [DOI] [PubMed] [Google Scholar]
- Grady CL, Springer MV, Hongwanishkul D, McIntosh AR, Winocur G. Age-related changes in brain activity across the adult lifespan. J. Cogn. Neurosci. 2006;18:227–241. doi: 10.1162/089892906775783705. [DOI] [PubMed] [Google Scholar]
- Harris G, Andreasen NC, Cizadlo T, Bailey JM, Bockholt HJ, Magnotta VA, Arndt S. Improving tissue classification in MRI: a three-dimensional multispectral discriminant analysis method with automated training class selection. J. Comput. Assist. Tomogr. 1999;23:144–154. doi: 10.1097/00004728-199901000-00030. [DOI] [PubMed] [Google Scholar]
- Hedden T, Gabrieli JD. Insights into the ageing mind: a view from cognitive neuroscience. Nat. Rev., Neurosci. 2004;5:87–96. doi: 10.1038/nrn1323. [DOI] [PubMed] [Google Scholar]
- Henson RN, Burgess N, Frith CD. Recoding, storage, rehearsal and grouping in verbal short-term memory: an fMRI study. Neuropsychologia. 2000;38:426–440. doi: 10.1016/s0028-3932(99)00098-6. [DOI] [PubMed] [Google Scholar]
- Huang M, Aine CJ, Supek S, Best E, Ranken D, Flynn ER. Multi-start downhill simplex method for spatio-temporal source localization in magnetoencephalography. Electroencephalogr. Clin. Neurophysiol. 1998;108:32–44. doi: 10.1016/s0168-5597(97)00091-9. [DOI] [PubMed] [Google Scholar]
- Klingberg T, Hedehus M, Temple E, Salz T, Gabrieli JD, Moseley ME, Poldrack RA. Microstructure of temporo-parietal white matter as a basis for reading ability: evidence from diffusion tensor magnetic resonance imaging. Neuron. 2000;25:493–500. doi: 10.1016/s0896-6273(00)80911-3. [DOI] [PubMed] [Google Scholar]
- Kovacevic S, Qualls C, Adair J, Hudson D, Woodruff C, Knoefel J, Lee R, Stephen J, Aine C. Age-related effects on superior temporal gyrus activity during an oddball task. NeuroReport. 2005;16:1075–1079. doi: 10.1097/00001756-200507130-00009. [DOI] [PubMed] [Google Scholar]
- Kray J, Eber J, Lindenberger U. Age differences in executive functioning across the lifespan: the role of verbalization in task preparation. Acta Psychol. (Amst.) 2004;115:143–165. doi: 10.1016/j.actpsy.2003.12.001. [DOI] [PubMed] [Google Scholar]
- Luria AR. The directive function of speech in development and dissolution Part 1. Word. 1959;15:341–352. [Google Scholar]
- Magnotta VA, Heckel D, Andreasen NC, Cizadlo T, Corson PW, Ehrhardt JC, Yuh WT. Measurement of brain structures with artificial neural networks: two- and three-dimensional applications. Radiology. 1999;211:781–790. doi: 10.1148/radiology.211.3.r99ma07781. [DOI] [PubMed] [Google Scholar]
- McIntosh AR, Sekuler AB, Penpeci C, Rajah MN, Grady CL, Sekuler R, Bennett PJ. Recruitment of unique neural systems to support visual memory in normal aging. Curr. Biol. 1999;9:1275–1278. doi: 10.1016/s0960-9822(99)80512-0. [DOI] [PubMed] [Google Scholar]
- Meulenbroek O, Petersson KM, Voermans N, Weber B, Fernandez G. Age differences in neural correlates of route encoding and route recognition. NeuroImage. 2004;22:1503–1514. doi: 10.1016/j.neuroimage.2004.04.007. [DOI] [PubMed] [Google Scholar]
- Morcom AM, Good CD, Frackowiak RS, Rugg MD. Age effects on the neural correlates of successful memory encoding. Brain. 2003;126:213–229. doi: 10.1093/brain/awg020. [DOI] [PubMed] [Google Scholar]
- Mosher JC, Lewis PS, Leahy RM. Multiple dipole modeling and localization from spatiotemporal MEG data. IEEE Trans. Biomed. Eng. 1992;39:541–557. doi: 10.1109/10.141192. [DOI] [PubMed] [Google Scholar]
- Nagy Z, Westerberg H, Klingberg T. Maturation of white matter is associated with the development of cognitive functions during childhood. J. Cogn. Neurosci. 2004;16:1227–1233. doi: 10.1162/0898929041920441. [DOI] [PubMed] [Google Scholar]
- Nelder J, Mead R. A simplex method for function minimization. Comput. J. 1965;7:308–313. [Google Scholar]
- Nielson KA, Langenecker SA, Garavan H. Differences in the functional neuroanatomy of inhibitory control across the adult life span. Psychol. Aging. 2002;17:56–71. doi: 10.1037//0882-7974.17.1.56. [DOI] [PubMed] [Google Scholar]
- Niogi SN, McCandliss BD. Left lateralized white matter microstructure accounts for individual differences in reading ability and disability. Neuropsychologia. 2006 doi: 10.1016/j.neuropsychologia.2006.01.011. [DOI] [PubMed] [Google Scholar]
- Nucifora PG, Verma R, Melhem ER, Gur RE, Gur RC. Leftward asymmetry in relative fiber density of the arcuate fasciculus. NeuroReport. 2005;16:791–794. doi: 10.1097/00001756-200505310-00002. [DOI] [PubMed] [Google Scholar]
- Nystrom LE, Braver TS, Sabb FW, Delgado MR, Noll DC, Cohen JD. Working memory for letters, shapes, and locations: fMRI evidence against stimulus-based regional organization in human prefrontal cortex. NeuroImage. 2000;11:424–446. doi: 10.1006/nimg.2000.0572. [DOI] [PubMed] [Google Scholar]
- Olesen PJ, Nagy Z, Westerberg H, Klingberg T. Combined analysis of DTI and fMRI data reveals a joint maturation of white and grey matter in a frontoparietal network. Brain Res. Cogn. Brain Res. 2003;18:48–57. doi: 10.1016/j.cogbrainres.2003.09.003. [DOI] [PubMed] [Google Scholar]
- Paivio A. Mental Representations: A Dual-Coding Approach. Oxford Univ. Press; New York: 1986. [Google Scholar]
- Paus T, Zijdenbos A, Worsley K, Collins DL, Blumenthal J, Giedd JN, Rapoport JL, Evans AC. Structural maturation of neural pathways in children and adolescents: in vivo study. Science. 1999;283:1908–1911. doi: 10.1126/science.283.5409.1908. [DOI] [PubMed] [Google Scholar]
- Poldrack RA. Imaging brain plasticity: conceptual and methodological issues—A theoretical review. NeuroImage. 2000;12:1–13. doi: 10.1006/nimg.2000.0596. [DOI] [PubMed] [Google Scholar]
- Postle BR. Working memory as an emergent property of the mind and brain. Neuroscience. 2006;139:23–38. doi: 10.1016/j.neuroscience.2005.06.005. [DOI] [PMC free article] [PubMed] [Google Scholar]
- Press W, Teukolsky S, Vetterling W, Flannery B. Numerical Recipes in C: The Art of Scientific Computing. University Press; Cambridge: 1992. [Google Scholar]
- Rahhal TA, Colcombe SJ, Hasher L. Instructional manipulations and age differences in memory: now you see them, now you don’t. Psychol. Aging. 2001;16:697–706. doi: 10.1037//0882-7974.16.4.697. [DOI] [PubMed] [Google Scholar]
- Raz N, Lindenberger U, Rodrigue KM, Kennedy KM, Head D, Williamson A, Dahle C, Gerstorf D, Acker JD. Regional brain changes in aging healthy adults: general trends, individual differences and modifiers. Cereb. Cortex. 2005;15:1676–1689. doi: 10.1093/cercor/bhi044. [DOI] [PubMed] [Google Scholar]
- Reuter-Lorenz P. New visions of the aging mind and brain. Trends Cogn. Sci. 2002;6:394. doi: 10.1016/s1364-6613(02)01957-5. [DOI] [PubMed] [Google Scholar]
- Richmond BJ, Optican LM. Temporal encoding of two-dimensional patterns by single units in primate inferior temporal cortex: II. Quantification of response waveform. J. Neurophysiol. 1987;57:147–161. doi: 10.1152/jn.1987.57.1.147. [DOI] [PubMed] [Google Scholar]
- Rosen AC, Prull MW, O’Hara R, Race EA, Desmond JE, Glover GH, Yesavage JA, Gabrieli JD. Variable effects of aging on frontal lobe contributions to memory. NeuroReport. 2002;13:2425–2428. doi: 10.1097/00001756-200212200-00010. [DOI] [PubMed] [Google Scholar]
- Rypma B, D’Esposito M. Isolating the neural mechanisms of age-related changes in human working memory. Nat. Neurosci. 2000;3:509–515. doi: 10.1038/74889. [DOI] [PubMed] [Google Scholar]
- Sarvas J. Basic mathematical and electromagnetic concepts of the biomagnetic inverse problem. Phys. Med. Biol. 1987;32:11–22. doi: 10.1088/0031-9155/32/1/004. [DOI] [PubMed] [Google Scholar]
- Schaie KW. The course of adult intellectual development. Am. Psychol. 1994;49:304–313. doi: 10.1037//0003-066x.49.4.304. [DOI] [PubMed] [Google Scholar]
- Schlaggar BL, Brown TT, Lugar HM, Visscher KM, Miezin FM, Petersen SE. Functional neuroanatomical differences between adults and school-age children in the processing of single words. Science. 2002;296:1476–1479. doi: 10.1126/science.1069464. [DOI] [PubMed] [Google Scholar]
- Shimamura AP, Berry JM, Mangels JA, Rusting CL, Jurica PJ. Memory and cognitive abilities in university of professors: evidence for successful aging. Psychol. Sci. 1995;6:271–277. [Google Scholar]
- Sowell ER, Peterson BS, Thompson PM, Welcome SE, Henkenius AL, Toga AW. Mapping cortical change across the human life span. Nat. Neurosci. 2003;6:309–315. doi: 10.1038/nn1008. [DOI] [PubMed] [Google Scholar]
- Stephen JM, Aine CJ, Ranken D, Hudson D, Shih JJ. Multidipole analysis of simulated epileptic spikes with real background activity. J. Clin. Neurophysiol. 2003;20:1–16. doi: 10.1097/00004691-200302000-00001. [DOI] [PubMed] [Google Scholar]
- Stephen JM, Ranken D, Best E, Adair J, Knoefel J, Kovacevic S, Padilla D, Hart B, Aine C. Aging changes and gender differences in response to median nerve stimulation measured with MEG. Clin. Neurophysiol. 2006;117:131–143. doi: 10.1016/j.clinph.2005.09.003. [DOI] [PubMed] [Google Scholar]
- Supek S, Aine CJ. Simulation studies of multiple dipole neuromagnetic source localization: model order and limits of source resolution. IEEE Trans. Biomed. Eng. 1993;40:529–540. doi: 10.1109/10.237672. [DOI] [PubMed] [Google Scholar]
- Tun PA, Wingfield A, Rosen MJ, Blanchard L. Response latencies for false memories: gist-based processes in normal aging. Psychol. Aging. 1998;13:230–241. doi: 10.1037//0882-7974.13.2.230. [DOI] [PubMed] [Google Scholar]
- Walter H, Bretschneider V, Gron G, Zurowski B, Wunderlich AP, Tomczak R, Spitzer M. Evidence for quantitative domain dominance for verbal and spatial working memory in frontal and parietal cortex. Cortex. 2003;39:897–911. doi: 10.1016/s0010-9452(08)70869-4. [DOI] [PubMed] [Google Scholar]
- Wickens D. Some characteristics of word encoding. Mem. Cogn. 1973;1:485–490. doi: 10.3758/BF03208913. [DOI] [PubMed] [Google Scholar]