Abstract
Properly constructed stereoscopic images are aligned vertically on the display screen, so on-screen binocular disparities are strictly horizontal. If the viewer’s inter-ocular axis is also horizontal, he/she makes horizontal vergence eye movements to fuse the stereoscopic image. However, if the viewer’s head is rolled to the side, the on-screen disparities now have horizontal and vertical components at the eyes. Thus, the viewer must make horizontal and vertical vergence movements to binocularly fuse the two images. Vertical vergence movements occur naturally, but they are usually quite small. Much larger movements are required when viewing stereoscopic images with the head rotated to the side. We asked whether the vertical vergence eye movements required to fuse stereoscopic images when the head is rolled cause visual discomfort. We also asked whether the ability to see stereoscopic depth is compromised with head roll. To answer these questions, we conducted behavioral experiments in which we simulated head roll by rotating the stereo display clockwise or counter-clockwise while the viewer’s head remained upright relative to gravity. While viewing the stimulus, subjects performed a psychophysical task. Visual discomfort increased significantly with the amount of stimulus roll and with the magnitude of on-screen horizontal disparity. The ability to perceive stereoscopic depth also declined with increasing roll and on-screen disparity. The magnitude of both effects was proportional to the magnitude of the induced vertical disparity. We conclude that head roll is a significant cause of viewer discomfort and that it also adversely affects the perception of depth from stereoscopic displays.
Keywords: Stereo 3D (S3D), head roll, discomfort, fatigue, vertical vergence, horizontal vergence, binocular vision
1. INTRODUCTION
Stereoscopic presentation has become much more commonplace in video games, cinema, television, medical imaging, scientific visualization, and more. With the increasing popularity, concerns have arisen about the viewer’s experience. For example, viewers often report discomfort: headaches, tired eyes, blurry vision, and even nausea [1,2]. Because of this, many users choose non-stereo 2D content over stereo 3D content (S3D) [3]. Surely, the public’s acceptance of S3D will depend on providing a reasonably comfortable experience.
The causes of discomfort associated with S3D viewing are not well understood. Without such an understanding, it is difficult to know how to reduce or eliminate the problems. There is good evidence that discomfort can arise from image mismatches (e.g., one eye’s image larger than the other’s) [4] and the vergence-accommodation conflict [5–7]. Other candidates are visual-vestibular conflicts [8], cross talk [4,9], window violations [10] and flicker and motion artifacts [11–13]. Here we focus on one potential cause: the vertical vergence eye movements that are required to fuse an S3D image when the head is rolled to the side.
In properly constructed S3D media, the left- and right-eye images are aligned vertically on the display screen, so all differences in the on-screen images (i.e., disparities) are horizontal. Each eye’s image has a center of projection on a line that originates in the middle of the image and is perpendicular to the surface of the display screen [14]. The centers of projection are separated horizontally by the distance between the viewer’s eyes. If the viewer’s eyes are placed at the respective centers of projection, the retinal images (including the horizontal and vertical disparities at the retinas) will be identical to those that would be created by looking at the original 3D scene in the world. When the eyes are not at the centers of projection, the disparities are no longer the same as those that would be generated by the original scene, so distortions in depth are perceived [14,15]. When the viewer’s head is rolled such that one eye is closer to the ground than the other, the two eyes can no longer be positioned at the centers of projection. As a consequence, the strictly horizontal on-screen disparities become partly vertical at the viewer’s eyes. To fuse the stimulus, the viewer now needs to make both horizontal and vertical vergence eye movements. Horizontal vergence movements are rotations of the eyes about head-centric vertical axes (i.e., one eye leftward and the other rightward) and vertical vergence movements are rotations about head-centric horizontal axes (one eye upward and the other downward). The dynamics of horizontal and vertical vergence eye movements are quite different. The eyes can make much faster and larger horizontal than vertical vergence movements [16–18].
We next examine the effects of head roll on the disparities at the eyes. Consider a stereoscopic image with an on-screen horizontal disparity Hd that varies sinusoidally over time with a mean of zero:
| (1) |
where (Hd) is the peak-to-trough disparity amplitude and the units are distance such as centimeters. The on-screen vertical disparity is always zero, so (Vd=0). The horizontal disparity does not vary with position in the stimulus, so the temporal change in disparity specifies a frontoparallel plane approaching and receding from the viewer.
Now consider rolling the head by the angle ϕ while viewing the same stereoscopic image. The viewer’s inter-ocular axis is no longer horizontal in screen coordinates, so the orientation of the disparities at the eyes changes with ϕ. In particular, the horizontal on-screen disparities now produce horizontal and vertical disparities relative to the head. Ignoring the small torsional eye movements made when the head rolls relative to gravitational upright [19], the disparities relative to head are:
| (2) |
If we know the mean onscreen disparities of the display then we can compute the horizontal ψ(t) and vertical θ(t) vergence required to perfectly fuse the stimulus with Equations 3 and 4, respectively.
| (3) |
| (4) |
where I is inter-ocular distance and Z is the distance from the viewer’s eyes to the screen.
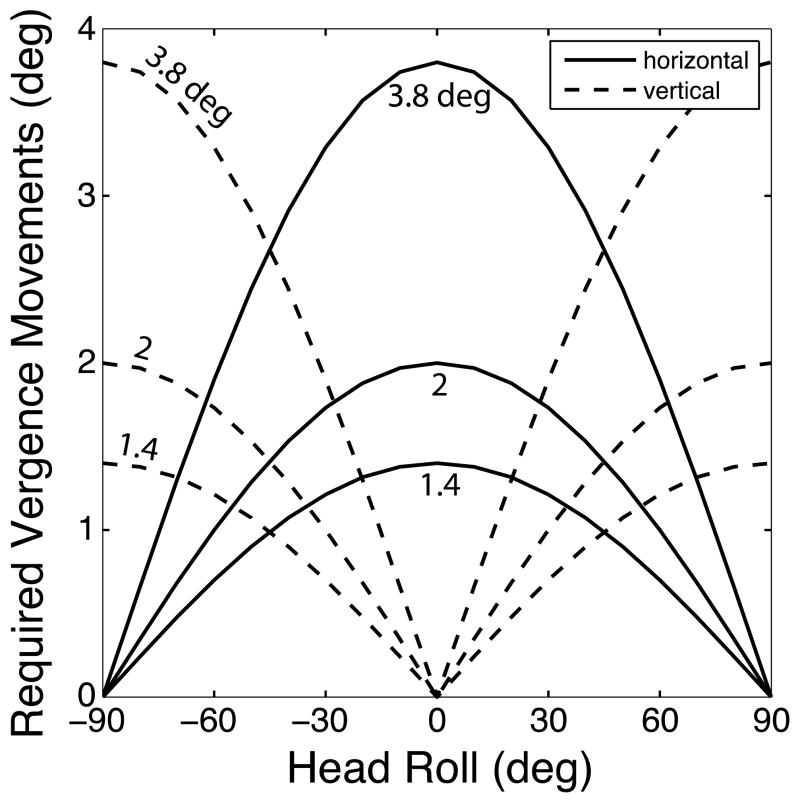
Figure 1 shows the amplitudes of the horizontal and vertical vergence movements required to track and fuse a stimulus with an oscillating horizontal on-screen disparity when the head is rolled by different angles. As you can see, the required vertical vergence is strongly dependent on the angle of head roll and the magnitude of the disparity variation.
Figure 1.
Horizontal and vertical vergence eye movements required to track a stereoscopic image when the head is rolled. The on-screen horizontal disparity of the stimulus oscillates by 1.4, 2, or 3.8° from peak to trough. Ignoring the small torsional components that occur with head roll relative to gravity, we calculated from Equations 3 and 4 the required horizontal and vertical vergence oscillation amplitudes required to maintain fusion. To do so, we converted Hd(t) and Vd(t) into angular units. Solid lines represent required horizontal vergence and dashed lines required vertical vergence.
2. EXPERIMENT 1
In the first experiment, we investigated how head roll and the amplitude of disparity oscillations over time affects visual discomfort and the ability to perceive a stereoscopic stimulus.
2.1 Methods
2.1.1 Subjects
Twenty UC Berkeley students participated. All had normal or corrected-to-normal visual acuity and binocular vision as assessed by standard clinical tests. The human-subjects protocols of UC Berkeley were followed.
2.1.2 Apparatus
Stimuli were presented on a mirror stereoscope with two CRTs (Iiyama MH204DT), one for each eye. CRT resolution was 1600×1200 pixels and the refresh rate was 100Hz. The subject’s head was stabilized with a chin and headrest. At the 116.5cm viewing distance, each pixel subtended 0.75 arcmin.
The stimulus was a dynamic random-dot stereogram of a frontoparallel plane with a sinusoidal depth corrugation of 0.5cpd in the middle. The peak-to-trough amplitude of the corrugation was 4arcmin. The stimulus was generated in MATLAB with the Psychtoolbox [20,21]. Anti-aliasing was enabled. The dots were randomly repositioned every 5ms to create a dynamic stereogram. The sinusoidal depth corrugation was +/−22.5° from earth horizontal. The frontoparallel plane in which the corrugation was embedded oscillated in disparity at 0.125Hz (i.e., a period of 8sec). The peak-to-trough amplitude of oscillation was 1.4, 2, or 3.8°. There was also a condition in which the disparity oscillation was 0° with a simulated roll of 30° only. The corrugation was not visible in the monocular images, so subjects had to fuse the stimulus binocularly in order to see the corrugation waveform.
To simulate head roll, we rotated the entire stereoscopic image about an axis perpendicular to the display screen. Apart from the small torsional eye movements that occur with real head roll, the simulated roll produces the same disparities at the eyes that real head roll produces. Thus, the 0.125Hz oscillation and the sinusoidal corrugations presented the same disparities at the eyes as would occur with real head roll.
2.1.3 Procedure
The corrugation was usually earth horizontal, but every 0.75 to 2sec the orientation changed for 0.5sec to −22.5 or +22.5° relative to earth horizontal. The subject’s task was to indicate with a button press the orientation of the corrugation when the change occurred. No feedback concerning the correctness of the response was provided. This task allowed us to determine how the ability to perceive the corrugation waveform varied with respect to on-screen disparity.
Subjects completed three experimental sessions of two hours each. Each session had 36 stimulus blocks. In each block, the subject viewed one unrolled and one rolled stimulus: ϕ = 0° for the unrolled stimuli and 10, 20, or 30° for the rolled stimuli. The two types of stimuli were otherwise identical. For example, the peak-to-trough on-screen disparity oscillations were 1.4, 2, or 3.8° in both cases. Thus there were nine stimulus conditions in all. During each session, the subject was presented each stimulus condition twice.
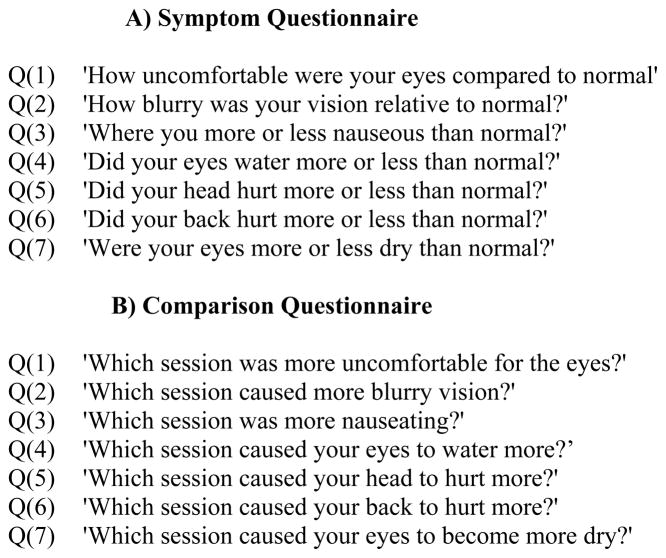
During each block, a pair of unrolled and rolled stimuli were presented with order randomized in the pair. Each block consisted of six parts: (1) The subject viewed the rolled or unrolled stimulus for a minute; (2) they answered a symptom questionnaire (Figure 2A) about the stimulus they were just presented; (3) the subject viewed the other stimulus in the pair for a minute; (4) they answered the symptom questionnaire about that stimulus; (5) the subject answered a comparison questionnaire (Figure 2B) that asked them to compare the discomfort associated with the first and second stimulus in the pair; (6) they took a one-minute break. After the break, the cycle started again for a different condition.
Figure 2.
Symptom and Comparison Questionnaires. A) The Symptom Questionnaire. The seven questions are shown. They were presented one at a time in random order. Subjects responded on a 9-point scale as described in the text. B) The Comparison Questionnaire. The seven questions are shown. They were presented one at a time in random order. Subjects responded on a 9-point scale as described in the text.
The questionnaires contained seven questions presented one by one in random order. Subjects answered each question on a 1–9 scale using the number pad on the keyboard. The questions in the symptom questionnaire concerned how the subject felt during the stimulus presentation relative to how they normally feel, with 5 being the same as normal, less than 5 being better than normal, and greater than 5 being worse than normal. We used the Symptom Questionnaire to assess the amount of discomfort relative to normal. The questions were similar in the Comparison Questionnaire except that they concerned how the subject felt after viewing the second stimulus compared to how they felt after viewing the first; 5 meant the same, less than 5 meant they felt better during the presentation of the first stimulus than during presentation of the second, and so forth. We used the Comparison Questionnaire to assess the effect of head roll per se by asking subjects to compare symptoms with and without head roll while everything else (task, chinrest, etc.) remained the same.
2.2 Results
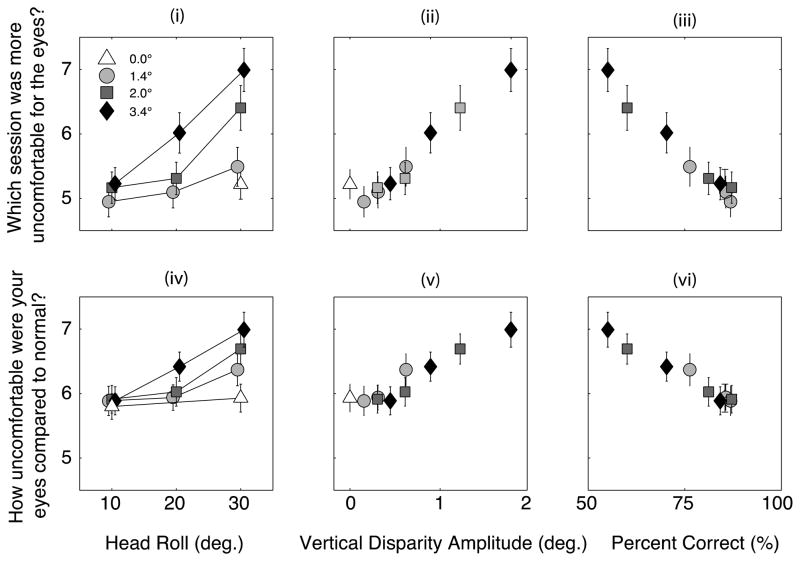
Figure 3 shows the main results of Experiment 1. The first row shows the results from the Comparison Questionnaire and the second row those from the Symptom Questionnaire. The first column shows the discomfort score averaged across subjects as a function of head roll. The second column shows the average score as a function of the induced vertical disparity. The third column shows average score as a function of percent correct in the psychophysical task. Thus, the ordinate is the same in all six panels. Different shapes and shades of the data symbols in each panel represent different oscillation amplitudes. In the first row, scores greater than 5 indicate that the discomfort was greater with the rolled stimulus than with the unrolled stimulus. In the second row, scores greater than 5 mean that the discomfort was greater than normal. Responses in the Comparison Questionnaire show that subjects never reported more discomfort with the unrolled stimulus than with the rolled stimulus. Responses in the Symptom Questionnaire were always greater than 5 indicating that subjects always experienced more discomfort than normal even when the on-screen disparity oscillation was 0. We attribute this to a build-up of discomfort across sessions (which we investigated further in Experiment 2). In contrast, the results with the Comparison Questionnaire reveal scores of ~5 at low oscillation amplitudes and small roll angles. This suggests that responses in the Comparison Questionnaire were less affected by previous stimuli than were responses in the Symptom Questionnaire.
Figure 3.
Discomfort scores. The top row plots the average answer of subjects to the questions, ‘which session was uncomfortable on the eyes?’ The second row plots the answer to the question, ‘how uncomfortable were your eyes compared to normal?’ The first column plots answers as a function of head roll, the second as a function of the onscreen vertical disparity amplitude and the third as a function of the percent of correct responses in the orientation task.
The results clearly demonstrate that discomfort increases with the amplitude of oscillation in on-screen disparity and with the angle of simulated head roll. Using Equation 2, we can plot the data as a function of the amplitude of the vertical disparity oscillations induced by simulated head roll. The second column of Figure 3 shows the discomfort as a function of induced vertical disparity and shows quite clearly that the severity of symptoms, whether assessed by the Comparison Questionnaire (upper row) or Symptom Questionnaire (lower row), is mostly dependent on vertical disparity. The Pearson’s correlation between the vertical disparity amplitudes and the discomfort scores on the comparison questionnaire (Figure 3ii) was 0.95 (p < 0.0001).
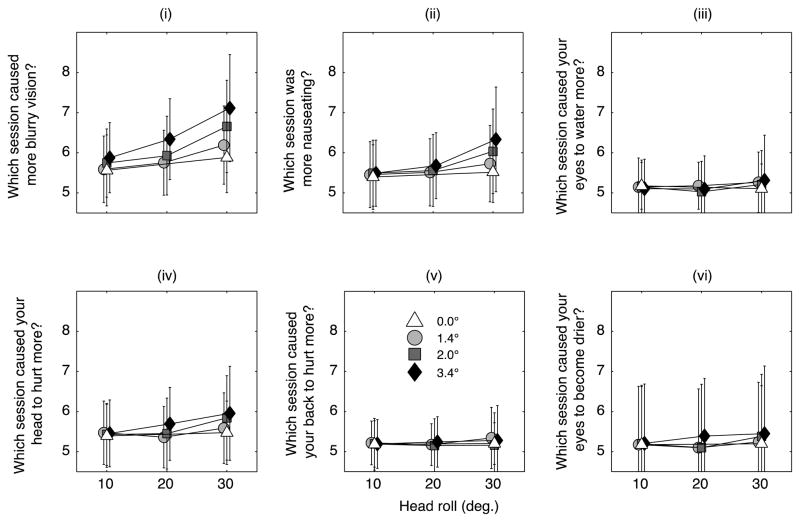
Figure 4 plots subject’s answers to the remaining 6 questions. Results in the Symptom and Comparison Questionnaires were nearly identical, so we only plot the latter. The results show that subjects reported increasingly blurred vision as head roll and the amplitude of oscillations increased (Figure 4i). Subjects reported a small increase in nausea (Figure 4ii) and headaches with increasing head roll (Figure 4iv), but did not report more pain (Figure 4v), or that their eyes watered more (Figure 4iii) or became drier (Figure 4vi) with increasing roll.
Figure 4.
(i) Subjects report increasingly blurry vision as a function increased head roll and the amplitude of oscillation. (ii) Subjects report a modest increase in nausea. Subjects do not report their eyes to water more (iii) or to become drier. (iv) Subjects report a mild increase in headaches with head roll.
3. EXPERIMENT 2
We were concerned that some of the findings in Experiment 1 were affected by symptoms in one session carrying over to another session on the same day. Thus, we re-examined how simulated head roll affects visual discomfort in an experiment in which different conditions were presented on different days.
3.1 Methods
Ten students at UC Berkeley participated. All had normal or corrected-to-normal vision as assessed by standard clinical tests. The apparatus, stimuli, and procedure were the same with a few exceptions. First, there was only one amplitude of oscillation of the on-screen disparity: 2°. Second, the simulated head rolls were 0, 12, 24, 36, 48, and 60°. Third, the different head rolls were presented in six one-hour sessions, each condition on a different day. Each session consisted of 12 blocks and each block consisted of a 4-min stimulus presentation followed by the Symptom Questionnaire.
The results are shown in Figure 5. The left panel plots the average discomfort score as a function of simulated head roll on the left ordinate, and percent correct performance as a function of head roll in the right ordinate. Clearly, discomfort increased significantly with increasing simulated head roll. At the same time, performance fell dramatically with increasing roll. The middle panel plots the discomfort scores (averaged across subjects) as a function of time from the beginning of the session. Different sets of data represent different amounts of head roll. The right panel shows the same data averaged across head rolls. These data show quite clearly that discomfort grew monotonically over time and that discomfort built up more over the first half of the session than over the second half.
Figure 5.
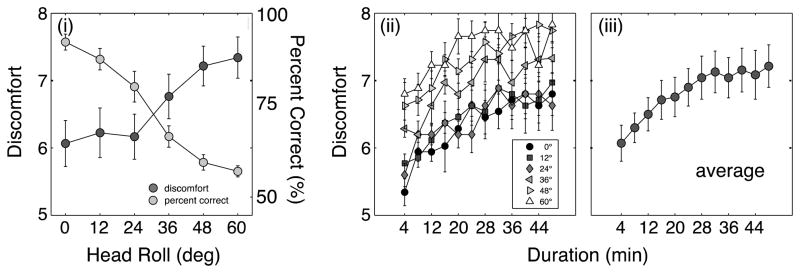
(i) Discomfort and percent correct as a function of the angle of head roll. Scores have been averaged across subjects. (ii) Discomfort scores as a function of time. Different symbols depict the scores in the different head roll conditions. Scores have been averaged across subjects. (iii) Discomfort averaged across all the head roll conditions.
4. DISCUSSION
The current study quantified the level of discomfort caused by watching S3D displays when the head is rolled relative to the display. S3D content is designed with the assumption that the head and display are aligned vertically. But many people have advocated the use circular-polarizing glasses rather than linear-polarizing one because the formers allows “freedom of head movement before the image becomes a double image” and provides the advantage that “you can look at a [stereo 3D] feature film and rest your head on your sweetheart’s shoulder. And still see a 3-D picture” [22]. This statement is true because head roll causes imperfect separation of the two eyes’ images while circular polarizers maintain separation. But these statements ignore the potential for greater discomfort due to the increased vertical vergence requirements and the possibility of double images. Ironically, it may be easier to avoid discomfort from head roll by using linear rather than circular polarizers.
Our data demonstrate a clear linear relationship between the vertical disparity induced by head roll and on-screen horizontal disparity and the amount of discomfort. The fact that the magnitude of vertical disparity predicts discomfort indicates that vertical vergence requirement is the primary cause of symptoms when head roll is present.
Acknowledgments
This research was supported by NIH research grant R01EY012851 and by a grant from Samsung SAIT.
References
- 1.Reisinger D. Survey: Most won’t buy new TV just to get 3D. 2010 cnet.com.
- 2.LG Corp. Cinema 3D Smart TV Survey. 2011 lggulfblog.com.
- 3.Sinclair B. No GDC Online 2010: Interpret LLC survey finds consumer awareness, desire for 3D content are rising across the board; cheaper TVs, Nintendo 3DS could be key drivers in coming year. 2010 www.gamespot.com.
- 4.Kooi F, Toet a. Visual comfort of binocular and 3D displays. Displays. 2004;25:99–108. [Google Scholar]
- 5.Shibata T, Kim J, Hoffman DM, Banks MS. The zone of comfort_: Predicting visual discomfort with stereo displays. Journal of Vision. 2011;11:1–29. doi: 10.1167/11.8.11. [DOI] [PMC free article] [PubMed] [Google Scholar]
- 6.Hoffman DM, Girshick AR, Banks MS. Vergence - accommodation conflicts hinder visual performance and cause visual fatigue. Journal of Vision. 2008;8:1–30. doi: 10.1167/8.3.33. [DOI] [PMC free article] [PubMed] [Google Scholar]
- 7.Emoto M, Niida T, Okano F. Repeated Vergence Adaptation Causes the Decline of Visual Functions in Watching Stereoscopic Television. Journal of Display Technology. 2005;1:328–340. [Google Scholar]
- 8.Palmisano S. Consistent stereoscopic information increases the perceived speed of vection in depth. Perception. 2002;31:463–480. doi: 10.1068/p3321. [DOI] [PubMed] [Google Scholar]
- 9.Siegel M. Perceptions of crosstalk and the possibility of a zoneless autostereoscopic display. Proc SPIE. 2001;4297:34–41. [Google Scholar]
- 10.Mendiburu B. In: Movie Making: Stereoscopic Digital Cinema From Script to Screen. Press OF, editor. Elsevier; 2009. [Google Scholar]
- 11.Hoffman DM, Karasev VI, Banks MS. Temporal presentation protocols in stereoscopic displays: Flicker visibility, perceived motion, and perceived depth. Journal of the Society for Information Display. 2011;19:271–297. doi: 10.1889/JSID19.3.271. [DOI] [PMC free article] [PubMed] [Google Scholar]
- 12.Woods A, Docherty T, Koch R. The use of flicker-free television products for stereoscopic display applications. Displays. 1991;1457:25–27. [Google Scholar]
- 13.Klompenhouwer M. Flat panel display signal processing - Analysis and algorithms for improved static and dynamic resolution. Eindhoven University; 2006. [Google Scholar]
- 14.Held RT, Banks MS. Misperceptions in Stereoscopic Displays_: A Vision Science Perspective. Proceedings of the 5th symposium on Applied perception in graphics and visualization; 2008. pp. 23–32. [DOI] [PMC free article] [PubMed] [Google Scholar]
- 15.Howard IP, Allison RS, Zacher JE. The dynamics of vertical vergence. Experimental brain research. Experimentelle Hirnforschung. Expérimentation cérébrale. 1997;116:153–159. doi: 10.1007/pl00005735. [DOI] [PubMed] [Google Scholar]
- 16.Houtman Wa, Roze JH, Scheper W. Vertical vergence movements. Documenta ophthalmologica. Advances in ophthalmology. 1981;51:199–207. doi: 10.1007/BF00143884. [DOI] [PubMed] [Google Scholar]
- 17.Krishnan VV, Phillips S, Stark L. Frequency analysis of accommodation, accommodative vergence and disparity vergence. Vision Research. 1973;13:1545–1554. doi: 10.1016/0042-6989(73)90013-8. [DOI] [PubMed] [Google Scholar]
- 18.Collewijn H, Van Der Steen J, Ferman L, Jansen TC. Human ocular counterroll: assessment of static and dynamic properties from electromagnetic scleral coil recordings. Experimental Brain Research. 1985;59:185–196. doi: 10.1007/BF00237678. [DOI] [PubMed] [Google Scholar]
- 19.Pelli DG. The VideoToolbox software for visual psychophysics: transforming numbers into movies. Spatial Vision. 1997;10:437–442. [Google Scholar]
- 20.Brainard DH. The Psychophysics Toolbox. Spatial Vision. 1997;10:433–436. [Google Scholar]
- 21.Selick H. Animation Goes High Tech With 3-D. NPR. 2009 [Google Scholar]


