

Abstract
Nonsyndromic orofacial clefts are common birth defects whose etiology is influenced by complex genetic and environmental factors and gene–environment interactions. Although these risk factors are not yet fully elucidated, it is known that alterations in transforming growth factor-beta (TGFβ) signaling can cause craniofacial abnormalities, including cleft palate, in mammals. To elucidate the downstream targets of TGFβ signaling in palatogenesis, we analyzed the gene expression profiles of Tgfbr2fl/fl;Wnt1-Cre mouse embryos with cleft palate and other craniofacial deformities resulting from the targeted inactivation of the Tgfbr2 gene in their cranial neural crest (CNC) cells. Relative to controls, palatal tissues obtained from Tgfbr2fl/fl;Wnt1-Cre mouse embryos at embryonic day 14.5 (E14.5) of gestation have a robust gene expression signature reflective of known defects in CNC-derived mesenchymal cell proliferation. Groups of differentially expressed genes (DEGs) were involved in diverse cellular processes and components associated with orofacial clefting, including the extracellular matrix, cholesterol metabolism, ciliogenesis, and multiple signaling pathways. A subset of the DEGs are known or suspected to be associated with an increased risk of orofacial clefting in humans and/or genetically engineered mice. Based on bioinformatics analyses, we highlight the functional relationships among differentially expressed transcriptional regulators of palatogenesis as well as transcriptional factors not previously associated with this process. We suggest that gene expression profiling studies of mice with TGFβ signaling defects provide a valuable approach for identifying candidate mechanisms by which this pathway controls cell fate during palatogenesis and its role in the etiology of human craniofacial abnormalities.
Keywords: TGFβ SIGNALING, CLEFT PALATE, MICROARRAY, GENE EXPRESSION PROFILING
Orofacial clefts are among the most prevalent birth defects in world-wide human populations [Mossey, 2007; Genisca et al., 2009; Mossey et al., 2009; Marazita, 2012]. Cleft lip with or without cleft palate (CL/P) and cleft palate only (CP) are estimated to affect approximately 1/700 and 1/2,500 live births, respectively [Beaty et al., 2011]. Approximately 70% of CL/P and 50% of CP cases are nonsyndromic with the remainder resulting from a variety of malformation syndromes, chromosomal abnormalities, or exposure to teratogens [Dixon et al., 2011]. The etiology of nonsyndromic CP is influenced by complex genetic and environmental risk factors as well as gene–environment interactions. Although large-scale population and family-based studies provide evidence of strong monogenic and polygenic contributions to CP, these risk factors are still being elucidated [Sozen et al., 2009; Beaty et al., 2011; Dixon et al., 2011]. Ethnicity, population of origin, and gender also have substantial influences on the birth prevalence of cleft palate [Marazita, 2012]. Maternal age, smoking, alcohol consumption, obesity, and micronutrient deficiencies are known or strongly suspected risk factors [Genisca et al., 2009; Beaty et al., 2011; Dixon et al., 2011].
Palatogenesis is a complex process that involves multiple signaling pathways and interactions among mesenchymal and epithelial cells [Meng et al., 2009]. The critical steps in palatogenesis include the growth, alignment and fusion of the palatal shelves, which are completed by embryonic day E16 in mice and by the end of the first trimester in humans [Meng et al., 2009; Bush and Jiang, 2012]. Mammalian palatal structures are composed of a diverse group of cranial neural crest (CNC)-derived cells, mesoderm-derived cells, and pharyngeal ectoderm-derived epithelial cells [Iwata et al., 2011a]. CNC cells contribute to the vast majority of the palatal mesenchyme and have crucial roles in palatogenesis [Ito et al., 2003].
The transforming growth factor-beta (TGFβ) signaling pathway has a profound influence on the gene expression profiles of CNC cells and their developmental fate [Iwata et al., 2011a]. TGFβ1, 2, and 3 are secreted proteins that can initiate this signaling pathway by promoting the assembly of TGFBR1 (aka TGFβRI) and TGFBR2 (aka TGFβRII) cell surface receptor complexes responsible for intracellular signal transduction [Iwata et al., 2011a]. The downstream influences of TGFβ signaling can be dependent or independent upon the activity of SMAD transcription factors (TFs) [Iwata et al., 2011a]. TGFβ1 and TGFβ2 are thought to be mainly involved in regulating the proliferation of the palatal mesenchyme while TGFβ3 has been proposed to play a crucial role in regulating the fate of midline epithelial cells during palatal fusion [Meng et al., 2009].
Alterations in TGFβ signaling present a known risk factor for cleft palate in humans and mouse models. For example, individuals with deleterious mutations in the TGFBR1 or TGFBR2 genes develop Loeys–Dietz syndrome, an autosomal recessive disorder typically characterized by vascular, skeletal, and craniofacial involvement, including cleft palate [Loeys et al., 2005; Pezzini et al., 2012]. Likewise, in genetically engineered mouse models, it has been demonstrated that aberrant TGFBR1 or TGFBR2 activity can result in cleft palate and other craniofacial malformations [Iwata et al., 2011a]. Tgfbr2fl/fl;Wnt1-Cre mouse embryos homozygous for a conditional knockout of the Tgfbr2 gene in their CNC cells develop cleft palate and other craniofacial abnormalities due to a cell proliferation defect within the CNC-derived palatal mesenchyme [Ito et al., 2003]. Recently, it has been shown that this results from inappropriate TGFβ signaling through a noncanonical pathway [Iwata et al., 2012]. Despite their importance, the downstream targets of TGFβ signaling networks responsible for CNC cell fate determination and palatogenesis have not been completely elucidated.
Here, we performed an in-depth analysis of the genome-wide expression profiles from palatal tissue of Tgfbr2fl/fl;Wnt1-Cre and Tgfbr2fl/fl healthy control mouse embryos. Our bioinformatics approaches and confirmatory assays allowed us to identify candidate downstream targets of aberrant TGFβ signaling in CNC cells and provided new insights into the molecular mechanisms by which this signaling pathway influences palatogenesis. The elucidation of these mechanisms could shed light on the nature of genetic, environmental, and gene–environment interactions responsible for orofacial clefting and provide targets for the development of potential prenatal therapeutic interventions.
MATERIALS AND METHODS
MICE AND HISTOLOGICAL EXAMINATION
All mice were raised, genotyped and maintained as described [Iwata et al., 2011b]. All Tgfbr2fl/fl;Wnt1-Cre mouse embryos used in this study presented with cleft palate while all Tgfbr2fl/fl mouse embryos showed normal palate development. The C57BL/6J mouse served as the genetic background in this study. Mice were handled in accordance with the protocols approved by the Institutional Animal Care and Use Committee (IACUC) at the University of Southern California. As previously described, mouse embryos were harvested at E14.5 in order to capture gene expression profiles at the time of normal mouse palatal fusion [Iwata et al., 2011b]. Hematoxylin and eosin staining was performed as described previously [Iwata et al., 2010, 2012].
SCANNING ELECTRON MICROSCOPIC (SEM) ANALYSIS
Samples were fixed with a modified Karnovsky fixative solution for 2 days. After dehydration through a graded ethanol series, samples were critical point dried in a Balzers Union apparatus (FL-9496), ion-sputtered with platinum–palladium (10–15 nm), and observed in JEOL JSM-6390 LV (JEOL USA, Inc., Peabody, MA) at a low accelerating voltage of 10 kv.
APOPTOSIS ANALYSIS
TUNEL (terminal deoxynucleotidyl transferase dUTP nick end labeling) assays were conducted using In Situ Cell Death Detection (fluorescent) kit (Roche Applied Science, Indianapolis, IN) following the manufacturer’s recommended protocol.
GENE EXPRESSION PROFILING
As described in a different analysis of these same RNA samples [Iwata et al., 2012], total RNA was isolated from mouse embryonic palate dissected at E14.5 and subjected to global gene expression analysis on GeneChip® Mouse Genome 430 2.0 Arrays (Affymetrix, Santa Clara, CA) designed to interrogate over 45,000 transcripts. The resulting .CEL files were preprocessed using the WebArray software [Wang et al., 2009] which uses the RMA (Robust Multi-array Average) algorithm [Irizarry et al., 2003] to generate log 2-scaled expression values for each transcript. Using the LIMMA (Linear Models for Microarray) package [Smyth, 2004], we selected probe sets showing absolute fold change greater than 1.2, and a false discovery rate (FDR) value less than 0.05. The FDR values were calculated by adjusting the P-values using the SPLOSH (Spacings LOESS Histogram) method [Pounds and Cheng, 2004]. Original CEL data files are available for download from the FaceBase Consortium [Hochheiser et al., 2011] website (http://www.facebase.org) under accession ID FB00000254 and from the Gene Expression Omnibus (http://www.ncbi.nlm.nih.gov/geo/) under GEO accession ID GSE22989.
QUANTITATIVE REVERSE TRANSCRIPTION PCR (QRT-PCR)
Total RNA was isolated from mouse embryonic palatal tissue dissected at E14.5 with the QIAshredder and RNeasy Micro extraction kits (QIAGEN, Valencia, CA), as described previously [Iwata et al., 2011b]. Statistical significance of qRT-PCR data was obtained by the two-tailed Student’s t-test; a P-value ≤ 0.05 was considered statistically significant. Primer sequences for selected genes are provided in Supplementary Table I.
CATEGORY ENRICHMENT ANALYSIS
WebGestalt v2 software was used to conduct GeneOntology (GO), KEGG (Kyoto Encyclopedia of Genes and Genomes), TF binding site, and miRNA enrichment analyses [Kirov et al., 2007]. Enriched categories for DEGs with higher expression in Tgfbr2fl/fl;Wnt1-Cre or palatal tissue required a Benjamini and Hochberg-corrected FDR<0.05 and at least 6 genes. Enriched categories for the combined set of DEGs required a Benjamini and Hochberg-corrected FDR<0.05 and at least 10 genes, to compensate for the larger number of DEGs sampled in this combined list. Ingenuity Pathways Analysis (IPA) software (Ingenuity Systems, Redwood City, CA) was used to analyze functional relationships of differentially expressed genes (DEGs).
TRANSCRIPTIONAL REGULATOR ANALYSIS
We used IPA software to identify transcriptional regulators that were differentially expressed in palatal tissue obtained from Tgfbr2fl/fl;Wnt1-Cre and Tgfbr2fl/fl mouse embryos and WebGestalt v2 software to identify TF binding site motifs that were over-represented in the promoter regions (±2 kb) of DEGs. The identity of the TF corresponding to each binding site motif was provided by the Molecular Signatures Database (MSigDB) resource (http://www.broadinstitute.org/gsea/msigdb/). We used the IPA Pathway Designer Connect tool to provide graphical output that summarizes all known relationships between the groups of transcriptional regulators and TFs described above.
RESULTS
Consistent with prior expectations [Ito et al., 2003], we observed abnormal palatogenesis and orofacial clefting in Tgfbr2fl/fl;Wnt1-Cre mouse embryos in contrast to normal palate development in control Tgfbr2fl/fl mouse embryos at E14.5 (Fig. 1). As previously described [Iwata et al., 2012], we obtained genome-wide expression data of palatal tissue from five Tgfbr2fl/fl;Wnt1-Cre and five control Tgfbr2fl/fl mouse embryos at E14.5, at which time we detected cell proliferation defect in Tgfbr2 mutant samples. Our genome-wide expression data provides an opportunity to explore downstream effects of TGFβ signaling just prior to the normal fusing of the palatal shelves.
Fig. 1.
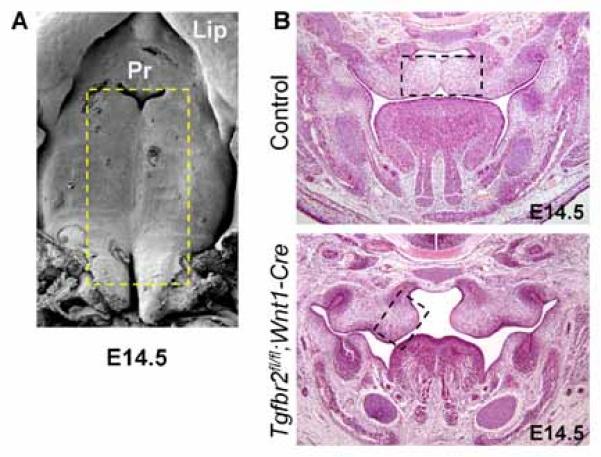
Images of palates from Tgfbr2fl/fl;Wnt1-Cre and Tgfbr2fl/fl mouse embryos at E14.5. A: SEM images of the palates of wild-type C57BL/6J mice. Boxed area was dissected out from Tgfbr2fl/fl (Control) and Tgfbr2fl/fl;Wnt1-Cre mice for gene expression microarray analysis. Pr, primary palate. B: Hematoxylin and eosin staining of E14.5 Tgfbr2fl/fl (Control) and Tgfbr2fl/fl;Wnt1-Cre mice. The boxed area was dissected out from Tgfbr2fl/fl (Control) and Tgfbr2fl/fl;Wnt1-Cre mice for microarray analysis.
Based on gene expression scores from the most variably expressed autosomal loci, the samples clustered according to genotype, except sample Tgfbr2fl/fl-1, whose gene expression profile was equally distant from all Tgfbr2fl/fl;Wnt1-Cre and all other Tgfbr2fl/fl control samples (Fig. 2A). There are several possible explanations for this observation, including subtle differences in sample preparation and acquisition, which we speculate are the most likely cause of these observations. Nevertheless, as discussed below, we observed robust Tgfbr2 genotype-specific differences in gene expression consistent with aberrations in the normal TGFβ-signaling pathway.
Fig. 2.
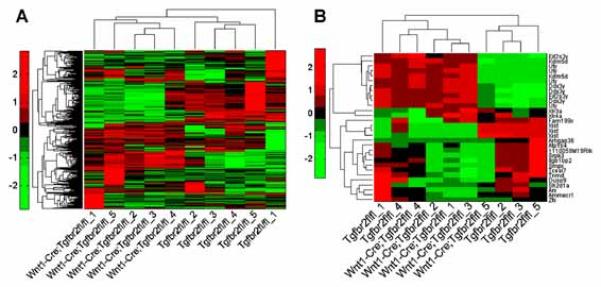
Hierarchical clustering analysis. A: Hierarchical clustering was performed on gene expression values of the 419 most highly variant (CV>0.1) transcripts of autosomal genes. B: Hierarchical clustering was performed on expression values of 30 probe sets representing the most variably expressed transcripts (CV>0.1) that reside on sex chromosomes. All dendrograms were generated using Euclidean distance and average linkage metrics. Rows and columns provide expression values from individual transcripts and samples, respectively. The color bar indicates differences (based on standard deviations) in the expression value assigned a given probe set from the mean expression score of the same probe set across all samples.
We also conducted hierarchical clustering analysis based on gene expression scores obtained from loci on sex chromosomes in order to begin to evaluate the genders of the embryos used in our studies. The candidate female samples included Tgfbr2fl/fl controls 2, 3, and 5 and Tgfbr2fl/fl;Wnt1-Cre mutant 5, while the candidate male samples included Tgfbr2fl/fl controls 1 and 4 as well as Tgfbr2fl/fl;Wnt1-Cre mutants 1–4 (Fig. 2B). Although gender-specific gene expression profiles are interesting, we have reported that Tgfbr2fl/fl;Wnt1-Cre mice have a complete phenotypic penetrance of cleft palate, suggesting that the gender-related genes may not be a primary cause of TGFβ-related cleft palate in mice [Ito et al., 2003; Iwata et al., 2012].
IDENTIFICATION AND CONFIRMATION OF DIFFERENTIALLY EXPRESSED GENES (DEGS)
We identified a total of 1,077 probe sets that indicated differentially expressed genes (“DEGs,” >1.2-fold change, FDR<0.05) in the palatal tissue from the Tgfbr2fl/fl;Wnt1-Cre and control Tgfbr2fl/fl mouse embryos. A volcano plot summarizing the relationships between the magnitude of the fold change indicated by a given probe set and significance is provided in Supplementary Figure 1. Of these probe sets, 342 indicated more and 735 indicated less abundant expression in palatal tissue from Tgfbr2fl/fl;Wnt1-Cre relative to control Tgfbr2fl/fl mouse embryos. Complete information on all DEGs is provided in Supplementary Table II.
We conducted category enrichment analysis on three different groups of DEGs. These included: (i) DEGs with higher expression in Tgfbr2fl/fl;Wnt1-Cre palatal tissue, (ii) DEGs with lower expression in Tgfbr2fl/fl;Wnt1-Cre palatal tissue, and (iii) the complete set of all DEGs. For brevity, we will discuss DEGs in former two categories in greater depth and only highlight the major findings from the combined set of all DEGs.
GENE ONTOLOGY (GO) ANALYSIS
We began by applying category enrichment analysis for Gene Ontology (GO) terms using criteria chosen to highlight larger-scale patterns in the data (see the Materials and Methods Section). The enriched terminal GO categories for DEGs with higher expression in Tgfbr2fl/fl;Wnt1-Cre relative to control palatal tissue included: regulation of apoptosis (14 genes: Ift57, Pim2, Agt, Fgfr3, Aifm2, Zbtb16, AY074887, Grid2, Traf1, Nme5, Bcl2l11, Bnip3, Vegfa, and Tgfb2), negative regulation of cell proliferation (7 genes: Zbtb16, AY074887, Fcgr2b, Agt, Tgfbr3, Krt4, and Fgfr3), cell substrate adhesion (8 genes: Agt, Ccdc80, Vit, Col5a3, Sned1, Bcl2l11, Arhgap6, and Abi3bp), proteinaceous extracellular matrix (10 genes: Mamdc2, Ccdc80, Tgfbr3, Vit, Crispld2, Ltbp4, Adamts1, Col5a3, Mmp16, and Abi3bp), and cilium (6 genes: Tekt4, Ift57, Spag16, Ttll6, Dnahc2, and Dnahc12) (see Supplementary Table III for a complete list).
In contrast, there was less variety in the enriched GO categories for DEGs that showed lower expression in Tgfbr2fl/fl;Wnt1-Cre relative to control donor tissues. The terminal categories included: mitosis (59 genes), DNA replication initiation (7 genes: Ccne1, Mcm2, Clspn, Mcm7, Mcm5, Cdt1, and Cdc45l), microtubule motor activity (9 genes: Kif13a, Kif20b, Kif2c, Kif18b, Kif4, Kif20a, Kif22, Cenpe, and Kif11), and nuclear chromosome part: (14 genes: Orc2l, Rad18, Prim1, Orc6l, Sgol1, Rpa2, Mcm2, Rad51, Bub1, Incenp, Suv39h2, Dnmt3b, Sgol2, and Rpa1) (see Supplementary Table IV for a full listing). We confirmed by qRT-PCR that a subset of the cell cycling genes (Ccna2, Ccnb1, and Birc5) and two genes related to cytoskeletal structure and function (Ttn and Myoz2) showed lower expression in tissue from Tgfbr2fl/fl;Wnt1-Cre mice relative to controls (Fig. 3).
Fig. 3.
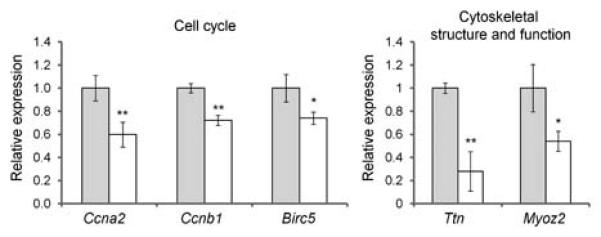
Confirmatory quantitative PCR analysis of selected DEGs. Bars represent mean transcript expression counts of selected genes within palatal tissue of three samples each from Tgfbr2fl/fl E14.5 control mice (gray bars) and Tgfbr2fl/fl;Wnt1-Cre E14.5 mice (white bars). Error bars represent standard deviations. * P <0.05; ** P <0.01 based on a two-tailed Student’s t-test.
The category enrichment analysis of all DEGs provided similar GO categories present in the individual analyses (see Supplementary Table V). We highlight that the glycosaminoglycan (12 genes) and microtubule motor activity (11 genes) categories were comprised of DEGs with higher expression and DEGs with lower expression in Tgfbr2fl/fl;Wnt1-Cre mouse palatal tissue. In the latter case, the DEGs with higher expression in Tgfbr2fl/fl;Wnt1-Cre mice were dynein family members while those with lower expression in these same mice were kinesin family members.
KEGG ANALYSIS
We also conducted KEGG pathway enrichment analyses on the three groups of DEGs (Supplementary Table VI). Although the DEGs with higher expression in Tgfbr2fl/fl;Wnt1-Cre palatal tissue showed no enriched KEGG pathways, we identified 15 KEGG pathways enriched in DEGs with lower expression in Tgfbr2fl/fl;Wnt1-Cre palatal tissue. This included the 11 genes involved in the “cell cycle.” The remaining KEGG pathways were highly related to DNA metabolism and cell division (e.g., purine and pyrimidine metabolism and nucleotide excision repair). The p53 signaling pathway was also highlighted. The combined analysis of all DEGs highlighted the 10 pathways which encompassed cell cycle, DNA metabolism, and a broad category of metabolism. Figure 4 provides the “cell cycle” pathway with all DEGs highlighted. Of these DEGs, only Tgfb2 showed higher expression in the Tgfbr2fl/fl;Wnt1-Cre relative to control animals.
Fig. 4.
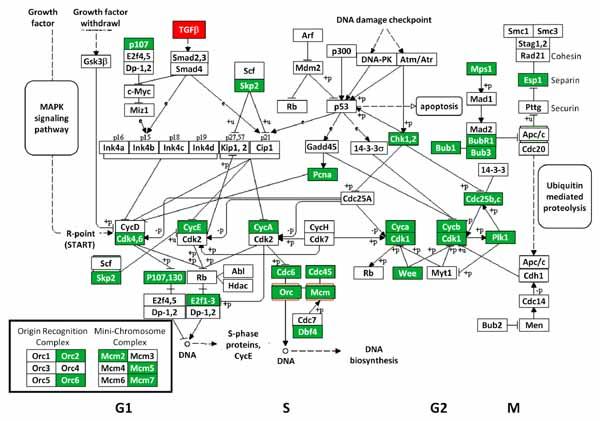
Differentially expressed genes (DEGs) related to the cell cycle. KEGG analysis identified the “cell cycle” pathway as being enriched for DEGs found in our comparisons of palatal tissue from Tgfbr2fl/fl;Wnt1-Cre and Tgfbr2fl/fl mouse embryos at E14.5. DEGs with higher (white text in red boxes) and lower (white text in green boxes) expression in Tgfbr2fl/fl;Wnt1-Cre embryos are highlighted.
IPA PATHWAY ANALYSIS
IPA canonical pathway and toxicology list analyses highlighted many of the same functional categories provided by KEGG analysis (Supplementary Tables VII and VIII). One of the notable exceptions was the inclusion of cholesterol biosynthesis related genes. This included the decreased expression in Tgfbr2fl/fl;Wnt1-Cre palatal tissue of four genes (Mvk, Myp, Idi1, and Fdps) encoding key components to the initial presqualene part of the cholesterol synthetic pathway (Supplementary Fig. 2) [Keber et al., 2011]. Upon manual inspection of the DEGs, we also found the decreased expression of Cyp51, which is part of the postsqualene cholesterol synthetic pathway [Keber et al., 2011].
GENE NETWORK ANALYSIS
In order to analyze further the relationships among DEGs, we performed a gene network analysis using IPA software (Supplementary Fig. 3). In general, the results of this analysis were in agreement with the category enrichment analyses performed above. The two IPA networks identified for DEGs with higher expression in tissue from Tgfbr2fl/fl;Wnt1-Cre relative to control animals with scores >25 were: (i) Free Radical Scavenging, Lipid Metabolism, Small Molecule Biochemistry; and (ii) Cellular Movement, Hematological System Development and Function, Immune Cell Trafficking. The top five IPA networks identified for DEGs with lower expression in tissue from Tgfbr2fl/fl;Wnt1-Cre relative to control animals all had scores >40 and included: (i) Cell Cycle, Cellular Assembly and Organization, DNA Replication, Recombination, and Repair; (ii) DNA Replication, Recombination, and Repair, Hereditary Disorder, Metabolic Disease; (iii) Cell Cycle, Cellular Assembly and Organization, DNA Replication, Recombination, and Repair; (iv) DNA Replication, Recombination, and Repair, Cell Cycle, Cellular Assembly and Organization; and (v) Cell Cycle, Cellular Assembly and Organization, DNA Replication, Recombination, and Repair.
The combined analysis provided similar results to that of the less expressed and had scores ≤35: (i) Cell Cycle, Cellular Assembly and Organization, DNA Replication, Recombination, and Repair (provided in Fig. 5); (ii) Cell Morphology, Auditory Disease, Cell Cycle; (iii) Dermatological Diseases and Conditions, Hereditary Disorder, Amino Acid Metabolism; (iv) Nucleic Acid Metabolism, Small Molecule Biochemistry, Cell Signaling; (v) DNA Replication, Recombination, and Repair, Cell Cycle, Cellular Assembly and Organization.
Fig. 5.
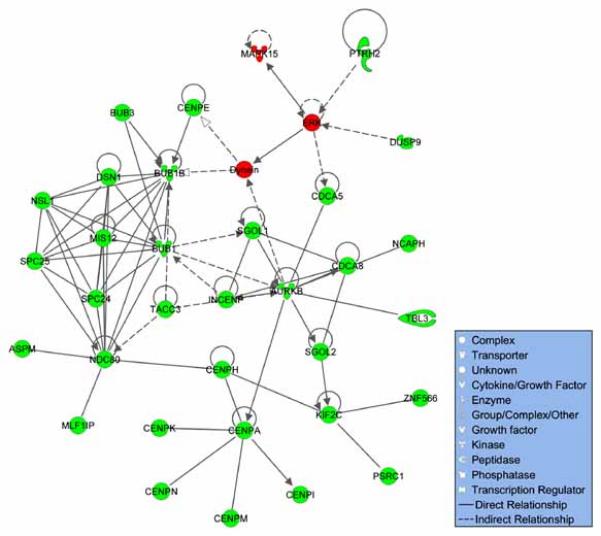
Molecular interactions among all DEGs. Based on IPA software, the top scoring gene network for all DEGs considered together was involved in the following processes: cell cycle, cellular assembly and organization, DNA replication, recombination, and repair. Red and green nodes respectively represent DEGs with higher (red) and lower (green) expression in palatal tissue from Tgfbr2fl/fl;Wnt1-Cre relative to Tgfbr2fl/fl mouse embryos at E14.5. Unshaded nodes are inferred by the IPA software. Solid lines between nodes indicate physical interaction between the connected elements, while dashed lines indicate indirect interaction through additional molecular components.
DIFFERENTIALLY EXPRESSED TRANSCRIPTIONAL REGULATORS
We manually searched our list of DEGs to determine if any were transcriptional regulators (TFs or proteins that bind TFs and regulate their activity), based on the annotations provided by the IPA resource. These include 12 genes (Foxn4, Glis3, Hlf, Klf3, Ldb2, Maf, Meis2, Nfkbiz, Pax3, Tbx22, Tox2, and Zbtb16) with higher expression and 49 genes (Actn2, Alyref, Ankrd1, Barx1, Batf3, Brca1, Cbx2, Ccne1, Csrnp2, E2f2, Ercc8, Etv5, Fem1c, Fli1, Foxk2, Foxm1, Gmnn, Gtf2h4, Gtf3c6, Hmgb1, Hmgb2, Hmgn5, Hnrnpd, Hoxd8, Irx1, Lef1, Limd1, Med27, Med4, Mxd3, Myef2, Myf5, Nfyb, Nolc1, Phb, Phf5a, Pitx2, Pold3, Psmg4, Smyd1, Sncaip, Srsf2, Suv39h2, Taf5, Tceal7, Tgif2, Trip13, Ttf2, and Uhrf1) with lower expression in tissue from Tgfbr2fl/fl;Wnt1-Cre relative to control mouse embryos.
TRANSCRIPTION FACTOR BINDING SITE MOTIF ANALYSIS
To explore potential gene regulatory networks downstream of Tgfβ signaling, we searched for the possible enrichment of TF binding site motifs 2-kb upstream and downstream of the transcription start sites of DEGs (Supplementary Table IX). There were 19 such candidate motifs identified for DEGs with higher expression in Tgfbr2fl/fl;Wnt1-Cre palatal tissue that correspond to the Taf, Jun, Foxf2, Rfx1, Mef2a, Gata1, Sox9, Mllt7, Rora, Tcf3, and Cdx2 TFs. There was a larger group of 37 candidate TF binding site motifs in the DEGs with lower expression in Tgfbr2fl/fl;Wnt1-Cre palatal tissue. These included Fox family members (Foxj2, Foxo3a, Foxo1a, Foxj1, and Foxq1), E2f family members (E2f1 and E2f2), Pcbp1, Sp1, Tal1, Gata1, and Sox9. The enriched TF binding motifs for “all DEGs” also included the following factors not discussed above in the individual analyses: Mllt7, Rfx1, Foxf2, Myb, Ddit3, Nf1, and Anrt.
GENE NETWORK ANALYSIS ON KNOWN AND PREDICTED TRANSCRIPTIONAL REGULATORS
We performed gene network analysis based on 61 transcriptional regulators that were differentially expressed in Tgfbr2fl/fl;Wnt1-Cre relative to Tgfbr2fl/fl palatal tissue and the 22 annotated TFs whose binding site motifs were enriched in the promoters of all DEGs. The known and inferred relationships of all these color-coded TFs are provided in Figure 6. The DEGs and TFs not shown in Figure 6 reflect the fact that the IPA software release used did not recognize them as having annotated relationships to the other genes.
Fig. 6.
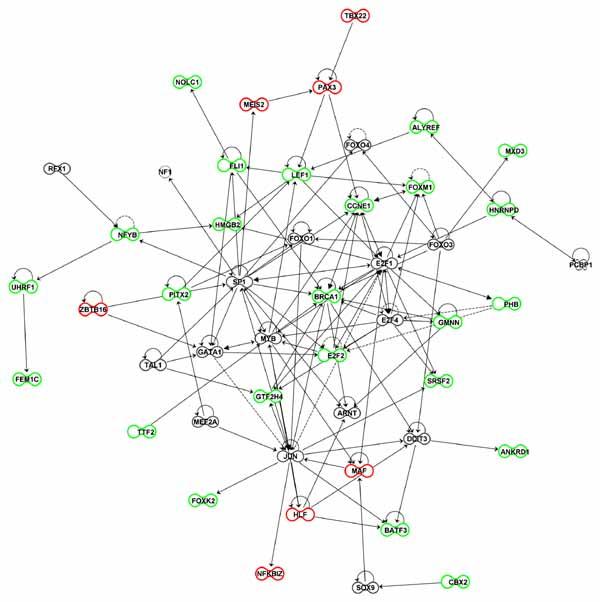
Molecular interactions among transcriptional regulators. Using the connect tool in IPA software we identified molecular interactions between (i) transcriptional regulators that were differentially expressed in palatal tissue from Tgfbr2fl/fl;Wnt1-Cre and Tgfbr2fl/fl mouse embryos and (ii) TFs whose binding site motifs were enriched in the genomic regions 2-kb upstream and downstream of the transcription start site of all DEGs. Transcriptional regulators with higher and lower expression in Tgfbr2fl/fl;Wnt1-Cre mouse embryos are colored in red and green, respectively. TFs identified based on enrichment for their binding site motifs are shaded in gray. Solid and dashed lines between nodes indicate direct and indirect interactions, respectively.
DEGS RELATED TO OROFACIAL CLEFTING IN HUMANS AND MOUSE MODELS
We also searched for overlap in the identities of DEGs with genes implicated in syndromic and nonsyndromic cases of human orofacial clefting, primarily obtained from reference [Dixon et al., 2011], and genetically engineered mouse models, primarily obtained from reference [Iwata et al., 2011b]. We report these overlapping DEGs in Table I. These include 5 genes primarily associated with human orofacial clefting and 13 primarily associated with the mouse orofacial clefting. Mutations in the Tbx22 gene, which showed higher expression in Tgfbr2fl/fl;Wnt1-Cre mouse embryos relative to controls, is associated with orofacial clefting in humans (X-linked cleft palate and ankyloglossia) and null mouse models, which exhibit a submucous cleft palate and ankyloglossia [Marcano et al., 2004; Pauws et al., 2009].
Table I.
DEGs associated with orofacial clefting in humans and/or mice
| AFFY_ID | Symbol | Title | NCBI GeneID | CKO Meana |
Control Meanb |
Fold Change CKO/Control |
FDRc | |
|---|---|---|---|---|---|---|---|---|
| Human Disorders | 1447258_at | Myst4 d | histone acetyltransferase KAT6B | 54169 | 315 | 81 | 3.88 | 0.0134 |
| 1438586_at | Tbx22 | T-box 22 | 245572 | 1107 | 741 | 1.49 | 0.0434 | |
| 1460458_at | Crispld2 | cysteine-rich secretory protein 2 | 78892 | 286 | 199 | 1.44 | 0.0047 | |
|
| ||||||||
| 1428142_at | Etv5 | ets variant gene 5 | 104156 | 173 | 292 | −1.69 | 0.0115 | |
| 1428304_at | Esco2 | establishment of cohesion 1 homolog 2 | 71988 | 206 | 318 | −1.55 | 0.0255 | |
| 1437492_at | Mkx | mohawk homeobox | 210719 | 204 | 278 | −1.36 | 0.0304 | |
|
| ||||||||
| Mouse Models | 1438303_at | Tgfb2 e | transforming growth factor, beta 2 | 21808 | 295 | 143 | 2.07 | 0.0005 |
| 1441743_at | Pax3 e | paired box gene 3 | 18505 | 271 | 180 | 1.51 | 0.0030 | |
| 1438586_at | Tbx22 | T-box 22 | 245572 | 1107 | 741 | 1.49 | 0.0434 | |
| 1420909_at | Vegfa | vascular endothelial growth factor A | 22339 | 668 | 447 | 1.49 | 0.0309 | |
| 1426858_at | Inhbb | inhibin beta-B | 100046802 | 63 | 48 | 1.30 | 0.0340 | |
| 1427613_at | AY074887 | cDNA sequence AY074887 | 246735 | 13 | 10 | 1.25 | 0.0188 | |
| 1422626_at | Mmp16 | matrix metallopeptidase 16 | 17389 | 787 | 631 | 1.25 | 0.0115 | |
|
| ||||||||
| 1450482_a_at | Pitx2 e | paired-like homeodomain TF 2 | 18741 | 224 | 389 | −1.74 | 0.0059 | |
| 1438718_at | Fgf9 | fibroblast growth factor 9 | 14180 | 74 | 112 | −1.52 | 0.0105 | |
| 1422533_at | Cyp51 e | cytochrome P450, family 51 | 13121 | 322 | 459 | −1.42 | 0.0297 | |
| 1456665_at | Eya4 | eyes absent 4 homolog | 14051 | 378 | 512 | −1.36 | 0.0062 | |
| 1449545_at | Fgf18 | fibroblast growth factor 18 | 14172 | 128 | 170 | −1.32 | 0.0169 | |
| 1428827_at | Whsc1 | Wolf-Hirschhorn syndrome candidate 1 | 107823 | 206 | 264 | −1.28 | 0.0348 | |
| 1423342_at | Barx1 | BarH-like homeobox 1 | 12022 | 1100 | 1407 | −1.28 | 0.0280 | |
Geometric mean gene expression score for Tgfbrfl/fl;Wnt1-Cre palatal tissue
Geometric mean gene expression score for Tgfbrfl/fl palatal tissue
False discovery rate
Probe set inerrogates in the intronic region of the Myst4 gene
Multiple probe sets indicate this is a DEG
DISCUSSION
Tgfbr2fl/fl;Wnt1-Cre mutant mice develop cleft palate as a result of cell proliferation defect in their CNC-derived palatal mesenchymal cells [Ito et al., 2003]. We previously reported that palatal tissue from these mice at E14.5 have elevated Tgfb2 and Tgfbr3 protein expression and demonstrated that this results in the activation of an alternative TGFβ signaling pathway and induces a SMAD-independent TNF receptor-associated factor 6/TGFβ-activated kinase 1/p38 (TRAF6/TAK1/p38) signaling cascade [Iwata et al., 2012]. Moreover, we described the role of Pitx2 and Fgf9 as mediators of TGFβ signaling based, in part, on the overlapping identities of a small subset of the DEGs highlighted in the current data set with those in the Mouse Genome Informatics database [Iwata et al., 2011b]. As discussed below, we now provide a detailed comparative analysis of the entire gene expression profiles of palatal tissue derived from Tgfbr2fl/fl;Wnt1-Cre mouse embryos relative to controls at E14.5.
DIFFERENTIALLY EXPRESSED GENES STRONGLY REFLECT CELL PROLIFERATION DEFECTS
The gene expression profiles from Tgfbr2fl/fl;Wnt1-Cre mouse embryos provided strong evidence of cell cycle and cell proliferation related defects that are in agreement with prior observations based on BrdU incorporation assays [Ito et al., 2003]. This included increased expression of negative regulators of cell proliferation and reduced expression of mitosis-related genes relative to controls (Fig. 4). Consistent with this observation, there was enrichment for genes required for DNA metabolism including synthesis, repair, and recombination (Fig. 5). The DEGs with lower expression in Tgfbr2fl/fl;Wnt1-Cre palatal tissue also reflected cellular components critical for cell division. For example, enriched GO categories such as Kinetochore, Spindle Pole, and Microtubule Motor Activity relate to chromosome segregation and cell division and included multiple kinesin family members. A nuclear isoform of titin has been proposed to be involved in the organization and maintenance of chromosome, spindle, and nuclear membrane structure and the regulation of cell division [Qi et al., 2008]. By qRT-PCR analysis, we confirmed the reduced transcripts levels of titin (Ttn) and the contractile fiber element gene myozenin 2 (Myoz2) in Tgfbr2fl/fl;Wnt1-Cre tissues (Fig. 3).
Relative to controls, we also observed elevated expression genes in the “Regulation of Apoptosis” GO category with many having pro-apoptotic functions (e.g., Bnip3, Bcl2l11, and Aimf2) in the Tgfbr2fl/fl;Wnt1-Cre mutant mouse embryos. Nevertheless, several genes in the category have additional functions. For example, Vegfa is involved in vasculogenesis and endothelial cell growth, promoting cell migration, in addition to inhibiting apoptosis [Neufeld et al., 1999]. Consistent with prior observations in this model system [Ito et al., 2003], we demonstrated by TUNEL assays that there is no significant difference in cellular apoptosis in the CNC-derived palatal mesenchyme between the Tgfbr2fl/fl;Wnt1-Cre mutant and wild-type embryos (Supplementary Fig. 4). We also note that these apoptosis-related DEGs are all of low magnitude and may reflect populations of cells that have not committed to apoptosis, but still have a weak, yet statistically significant, elevated expression of apoptotic regulatory genes.
DIFFERENTIAL EXPRESSION OF MICROTUBULE-RELATED GENES
The GO Cellular Component categories enriched for DEGs with higher expression in Tgfbr2fl/fl;Wnt1-Cre palatal tissues include “microtubule” and “cilium.” Centrosomes are microtubule-organizing organelles that play vital roles in mitotic spindle formation, chromosome segregation, and cell division [Nigg and Stearns, 2011]. The centrosome also acts as the base of the primary cilium and has an important role in associated signaling pathways involving Hedgehog (Hh), Wingless (Wnt), and Notch [Christensen et al., 2012]. The primary cilium is a dynamic structure whose formation and resorption is linked to the cell cycle and tends to protrude from noncycling quiescent cells [Michaud and Yoder, 2006; Tobin and Beales, 2009]. Thus, the higher expression of ciliarelated genes in Tgfbr2fl/fl;Wnt1-Cre palatal tissue is consistent with cell cycle arrest in mesenchymal cells.
The functional significance of the increased expression of ciliarelated genes in the Tgfbr2fl/fl;Wnt1-Cre palatal tissue is unclear. Further studies are required to determine if there are differences in the number, structure, and function of primary cilia in palatal mesenchymal cells from Tgfbr2fl/fl;Wnt1-Cre mouse embryos relative to controls. Nevertheless, we note that ciliopathies are a group of heterogeneous genetic disorders caused by cilial dysfunction that affect the function of multiple organs, most frequently the kidneys and liver [Tobin and Beales, 2009]. In a subset of these disorders, there is an increased incidence of cleft lip and/or palate [Tobin and Beales, 2009].
SIGNATURES SUGGEST REDUCED CHOLESTEROL SYNTHESIS IN TGFBR2 MUTANT PALATAL TISSUE
The Fdps, Idi1, Mvd, Mvk, and Cyp51 genes has lower expression in palatal tissue from Tgfbr2fl/fl;Wnt1-Cre mouse embryos relative to controls. The first four genes encode enzymes involved in the presqualene cholesterol synthetic pathway that contributes to both sterol and isoprenoid synthesis (Supplementary Fig. 2) while Cyp51 is involved in the postsqualene cholesterol synthetic pathway. Cyp51−/− mice show multiple developmental defects, including cleft palate, and midgestation lethality [Keber et al., 2011]. This gene expression signature could reflect the cell proliferation defect in the palatal tissue from Tgfbr2fl/fl;Wnt1-Cre mouse embryos that lessens the demands for cholesterol biosynthesis. Alternatively, this signature could suggest differences in the levels of cholesterol or its intermediates in all or a subset of cells within the palatal tissue of Tgfbr2fl/fl;Wnt1-Cre mouse embryos relative to controls.
The latter interpretation is intriguing since inherited defects in cholesterol biosynthesis are responsible for a diverse group of human syndromes, whose clinical presentations include cleft palate and other craniofacial anomalies [Porter and Herman, 2011]. Likewise, mice homozygous for null mutations in the Dhcr7, Sc5d, Insig1, and Insig2 genes critical for cholesterol biosynthesis develop cleft palate [Porter and Herman, 2011]. In fact, there is strong evidence that sterol precursor accumulation is involved in the etiology of craniofacial abnormalities in Insig1/2 null mouse models [Engelking et al., 2006]. Moreover, it is intriguing to speculate about the role of cholesterol metabolism in modulating sonic hedgehog (Shh) signaling during palatogenesis [Porter and Herman, 2011]. The importance of Shh signaling has been highlighted in mouse models of palatogenesis [Cobourne et al., 2009; Han et al., 2009].
GENE EXPRESSION SIGNATURES SUGGEST ALTERED INTERACTIONS WITH THE EXTRACELLULAR MATRIX (ECM)
TGFβ signaling activity is intimately tied to the ECM, which concentrates inactive TGFβ noncovalently bound in the large latent complex (LLC) to relevant regions prior to activation and influences the bioavailability and/or function of TGFβ activators [Doyle et al., 2012]. Furthermore, it has been suggested that the ECM could influence the activity of cell surface effectors of TGFβ signaling [Doyle et al., 2012]. Through feedback modulation, TGFβ signaling can have a profound impact on the ECM by stimulating the synthesis of component proteoglycans, collagens and glycoproteins, inhibiting proteases involved in its degradation, and altering the relative proportions of cell surface receptors that could facilitate adhesion to the ECM [Noble et al., 1992].
Tgfbr2fl/fl;Wnt1-Cre mouse embryo-derived palatal tissue showed an elevated expression of genes related to the roles of ECM in TGFβ-signaling and possible downstream effects on cell adhesion. One notable DEG was Latbp4, which encodes part of the aforementioned LLC that provides a readily accessible reservoir of latent TGFβ in the ECM [Wipff and Hinz, 2008; Todorovic and Rifkin, 2012]. This is relevant to the confirmed over-expression of Tgfb2 in palatal tissue from E14.5 Tgfbr2fl/fl;Wnt1-Cre mouse embryos. While the exact mechanisms involved in activating latent TGFβ in the ECM are not fully described, enzymatic activation by matrix metalloproteinase and cathepsin family members has been described [Wipff and Hinz, 2008; Todorovic and Rifkin, 2012], which could relate to multiple DEGs in our study.
The increased expression of other ECM-related genes in Tgfbr2fl/fl;Wnt1-Cre palatal tissue are relevant to palatogenesis. For example, the increased expression of Col5a3 is relevant given the roles collagens have on palatal mesenchymal growth and shelf elevation [Meng et al., 2009]. The increased expression of genes encoding glycosaminoglycan (GAG) binding proteins (e.g., Adamts1) is relevant to the critical role of GAGs in palatal shelf elevation [Meng et al., 2009]. As members of disintegrin and metalloproteinase with thrombospondin motifs family, the elevated expression of Adamts1 and Adamts5 and decreased expression of Adamts6 could influence ECM composition and the function of integrins, which modulate intracellular responses to TGFβ and has been proposed to be involved in activating latent TGFβ in the ECM [Doyle et al., 2012].
EVIDENCE FOR OTHER CELLULAR AND/OR METABOLIC DIFFERENCES
Based on IPA pathway analysis, we found evidence suggesting differences in the red blood cell content of palatal tissue obtained from Tgfbr2fl/fl;Wnt1-Cre mouse embryos relative to those of control mice. This was based on the differential expression of the Cdk4, Ciapin1, Fli1, and Hfe2 genes, which all showed lower expression in Tgfbr2fl/fl;Wnt1-Cre mouse embryos relative to controls. Mildly impaired blood circulation would be consistent with known defects in the cardiovascular systems of Tgfbr2fl/fl;Wnt1-Cre mouse embryos [Choudhary et al., 2006]. IPA pathway analysis also highlighted the statistically significant (P=0.017) enrichment of HIF1-α signaling genes (Vegfa, Slc2a1, Mmp16, and Mapk15) among the DEGs with higher expression in Tgfbr2fl/fl;Wnt1-Cre mouse embryos (Supplementary Tables VI and VII). This is consistent with mild hypoxia due to impaired blood circulation.
Given the critical role that iron levels play in cell proliferation [Yu et al., 2007], it is intriguing that Slc40a1 (ferroportin), the only known mammalian iron exporter [Mleczko-Sanecka et al., 2010], showed higher expression and Hfe2, a cellular iron sensor [Mleczko-Sanecka et al., 2010], showed lower expression in Tgfbr2fl/fl;Wnt1-Cre palatal tissue relative to control. Prior studies have investigated links between the expression of iron homeostasis genes and TGFβ signaling [Mleczko-Sanecka et al., 2010]. Several reports suggest that maternal iron supplementation could reduce the risk of orofacial clefting under certain circumstances [Krapels et al., 2004; Shaw et al., 2006]. Nevertheless, to the best of our knowledge, there is no evidence that humans and genetically engineered mice with altered iron homeostasis gene function have an increased risk of orofacial clefts.
EFFECTS ON OTHER SIGNALING PATHWAYS RELEVANT TO PALATOGENESIS
Many of the DEGs in our current study involve signaling pathways relevant to TGFβ signaling and/or palatogenesis. For example, the increased expression of the Agt (angiotensinogen) gene, encoding the precursor to the angiotensin I (Ang-I) and II (Ang-II) hormones, is especially pertinent to TGFβ signaling [Habashi et al., 2011]. Ang-I signals through angiotensin receptors, and an angiotensin blocker losartan is known to reduce the expression of TGFβ ligands, receptors, and activators [Habashi et al., 2011]. Thus, increased Agt expression may contribute to the elevated TGFβ2 and TGFBR3 levels in Tgfbr2fl/fl;Wnt1-Cre palatal tissue, following the activation of the angiotensin signaling pathway. However, we could not detect a difference in the TGFβ signaling activation after treatment of angiotensin between wild-type control and Tgfbr2 mutant palatal mesenchymal cells, suggesting that noncanonical TGFβ signaling is activated in a tissue-specific manner (data not shown).
The DEGs are also consistent with increased ERK1/2 and NF-κB signaling (Supplementary Fig. 2A and B), and decreased sonic hedgehog signaling. This could be relevant to the proposal that aberrant noncanonical TGFβ signaling though the ERK1/2 or JNK1 pathways can cause heart disease in mouse models of Marfan syndrome [Holm et al., 2011]. Moreover, our results would also be consistent with prior reports that TGFβ signaling is associated with increasing the activity of the NF-κB signaling pathway [Gingery et al., 2008]. As discussed above, the sonic hedgehog signaling pathway has a pivotal role in craniofacial development and intracellular cholesterol levels can influence its activity in certain cell types [Porter and Herman, 2011]. This is relevant to the gene expression signature of reduced cholesterol biosynthesis in the Tgfbr2fl/fl;Wnt1-Cre mouse embryos (Supplementary Fig. 2). Furthermore, Hhip, an inhibitor of Hedgehog signaling, showed higher expression in the Tgfbr2fl/fl;Wnt1-Cre mice relative to controls. Finally, we note the signature of the primary cilia-related genes could influence Shh signaling since the patched (PTCH) receptor and smoothened (SMO) transmembrane protein localize to these structures [Porter and Herman, 2011].
DIFFERENTIAL EXPRESSION OF TRANSCRIPTION REGULATORS
We identified 61 DEGs relevant to transcriptional regulation and another 22 annotated TFs whose binding site motifs were enriched in the promoter regions of DEGs. As discussed in the next section, several of the DEGs related to transcriptional regulations are involved in orofacial clefting in mice and/or humans (Table I). Sox9 was identified based on the higher expression of DEGs in Tgfbr2fl/fl;Wnt1-Cre relative to control palatal tissue. Interestingly, Sox9 haploinsufficiency is associated with cleft palate in mice and in humans with Campomelic dysplasia [Lee and Saint-Jeannet, 2011].
A combined gene network analysis of the DEGs and inferred TFs provided preliminary insights into their known relationships. For example, Pax3 served as a node connecting Tbx22, Meis2, Lef1, Ccne1, and Pitx2. Likewise, Lef1 served as another major node connecting Fli1, Pax3, Alyref, Foxm1, Pitx2, Hmgb2, E2f1, and Myb. As discussed in our prior study, Pitx2 showed lower expression in palatal tissue from Tgfbr2fl/fl;Wnt1-Cre mice relative to controls and is a downstream target of TGFβ signaling [Iwata et al., 2011b]. It served as a node connected with Zbtb16, Lef1, Sp1, and Foxo1. Finally, we note the large number of connections to nodes representing the Ccne1, E2f1, Jun, and Sp1 transcriptional regulators. While a discussion of all these interrelationships is beyond the scope of the current study, these data provide candidate gene expression networks for future functional analyses and validation.
EXPRESSION OF GENES RELATED TO OROFACIAL CLEFTING IN HUMANS AND MOUSE MODELS
A subset of our DEGs are known or suspected to be implicated in orofacial clefting in humans and/or genetically engineered mouse models (Table I); however, the directionality of the gene expression differences can make the interpretation of their functional significance challenging. Nevertheless, we highlight the reduced expression of Esco2 that is responsible for Roberts syndrome, a genetic disorder that manifests CL/P. We also note the reduced expression of Etv5 and Mkx, recently reported candidate fetal genetic risk factor in Scandinavian populations [Jugessur et al., 2009], whose transcript levels were lower in Tgfbr2fl/fl;Wnt1-Cre tissues relative to controls. With the exception of Pax3 [Wu et al., 2008], all the genes highlighted in Table I for the mouse models result in orofacial clefting as a result of gene disruptions. The fact that Pax3 had elevated expression in Tgfbr2fl/fl;Wnt1-Cre palatal tissues could be functionally relevant given the prior report that the persistent expression of Pax3 in the neural crest causes cleft palate in mice [Wu et al., 2008]. The mouse orofacial clefting genes with lower expression in Tgfbr2fl/fl;Wnt1-Cre mouse embryos included Pitx2, Fgf9, Cyp51, Eya4, Fgf18, Whsc1, and Barx1. In the Tgfbr2fl/fl;Wnt1-Cre mouse model, we have previously confirmed the functional relationships between Pitx2 and Fgf9 in relation to orofacial clefting [Iwata et al., 2011b]. Thus, we believe the other genes are excellent candidates for influencing palatogenesis in our model.
FUTURE DIRECTIONS
Additional gene expression profiling studies involving multiple tissue types at different stages of development could provide a deeper understanding of the TGFβ signaling mechanism in craniofacial development. These studies would benefit from advances in gene expression profiling technology, such as RNA-Seq methods, that will allow for more sensitive analyses and ability to detect splice variants. Furthermore, the analysis of the transcriptomes of single cells or small groups of cells, such as those comprising the medial edge epithelium (MEE), will provide an exciting opportunity to elucidate the spatiotemporal aspects of the TGFβ signaling mechanism at the highest resolution. This could enhance our ability to dissect the complex gene–environment risk factors for abnormal palatogenesis and offer new options for prenatal nutritional therapies for the prevention of craniofacial abnormalities.
Supplementary Material
ACKNOWLEDGMENTS
We thank Ray Mosteller (University of Southern California) for thoughtful discussion. This study was supported by grants from the National Institute of Dental and Craniofacial Research, National Institutes of Health (U01DE020065, DE012711, DE014078, and DE017007) to Yang Chai and the National Institute of General Medical Sciences, National Institutes of Health (GM072477) to Joseph Hacia.
Grant sponsor: NIDCR, NIH; Grant numbers: U01DE020065, DE012711, DE014078, DE017007; Grant sponsor: NIGMS, NIH; Grant number: GM072477.
Footnotes
Additional supporting information may be found in the online version of this article.
REFERENCES
- Beaty TH, Ruczinski I, Murray JC, Marazita ML, Munger RG, Hetmanski JB, Murray T, Redett RJ, Fallin MD, Liang KY, Wu T, Patel PJ, Jin SC, Zhang TX, Schwender H, Wu-Chou YH, Chen PK, Chong SS, Cheah F, Yeow V, Ye X, Wang H, Huang S, Jabs EW, Shi B, Wilcox AJ, Lie RT, Jee SH, Christensen K, Doheny KF, Pugh EW, Ling H, Scott AF. Evidence for gene-environment interaction in a genome wide study of nonsyndromic cleft palate. Genet Epidemiol. 2011;35:469–478. doi: 10.1002/gepi.20595. [DOI] [PMC free article] [PubMed] [Google Scholar]
- Bush JO, Jiang R. Palatogenesis: Morphogenetic and molecular mechanisms of secondary palate development. Development. 2012;139:231–243. doi: 10.1242/dev.067082. [DOI] [PMC free article] [PubMed] [Google Scholar]
- Choudhary B, Ito Y, Makita T, Sasaki T, Chai Y, Sucov HM. Cardiovascular malformations with normal smooth muscle differentiation in neural crest-specific type II TGFbeta receptor (Tgfbr2) mutant mice. Dev Biol. 2006;289:420–429. doi: 10.1016/j.ydbio.2005.11.008. [DOI] [PubMed] [Google Scholar]
- Christensen ST, Clement CA, Satir P, Pedersen LB. Primary cilia and coordination of receptor tyrosine kinase (RTK) signalling. J Pathol. 2012;226:172–184. doi: 10.1002/path.3004. [DOI] [PMC free article] [PubMed] [Google Scholar]
- Cobourne MT, Xavier GM, Depew M, Hagan L, Sealby J, Webster Z, Sharpe PT. Sonic hedgehog signalling inhibits palatogenesis and arrests tooth development in a mouse model of the nevoid basal cell carcinoma syndrome. Dev Biol. 2009;331:38–49. doi: 10.1016/j.ydbio.2009.04.021. [DOI] [PMC free article] [PubMed] [Google Scholar]
- Dixon MJ, Marazita ML, Beaty TH, Murray JC. Cleft lip and palate: Understanding genetic and environmental influences. Nat Rev Genet. 2011;12:167–178. doi: 10.1038/nrg2933. [DOI] [PMC free article] [PubMed] [Google Scholar]
- Doyle JJ, Gerber EE, Dietz HC. Matrix-dependent perturbation of TGFbeta signaling and disease. FEBS Lett. 2012;586:2003–2015. doi: 10.1016/j.febslet.2012.05.027. [DOI] [PMC free article] [PubMed] [Google Scholar]
- Engelking LJ, Evers BM, Richardson JA, Goldstein JL, Brown MS, Liang G. Severe facial clefting in Insig-deficient mouse embryos caused by sterol accumulation and reversed by lovastatin. J Clin Invest. 2006;116:2356–2365. doi: 10.1172/JCI28988. [DOI] [PMC free article] [PubMed] [Google Scholar]
- Genisca AE, Frias JL, Broussard CS, Honein MA, Lammer EJ, Moore CA, Shaw GM, Murray JC, Yang W, Rasmussen SA. Orofacial clefts in the National Birth Defects Prevention Study, 1997–2004. Am J Med Genet A. 2009;149A:1149–1158. doi: 10.1002/ajmg.a.32854. [DOI] [PMC free article] [PubMed] [Google Scholar]
- Gingery A, Bradley EW, Pederson L, Ruan M, Horwood NJ, Oursler MJ. TGF-beta coordinately activates TAK1/MEK/AKT/NFkB and SMAD pathways to promote osteoclast survival. Exp Cell Res. 2008;314:2725–2738. doi: 10.1016/j.yexcr.2008.06.006. [DOI] [PMC free article] [PubMed] [Google Scholar]
- Habashi JP, Doyle JJ, Holm TM, Aziz H, Schoenhoff F, Bedja D, Chen Y, Modiri AN, Judge DP, Dietz HC. Angiotensin II type 2 receptor signaling attenuates aortic aneurysm in mice through ERK antagonism. Science. 2011;332:361–365. doi: 10.1126/science.1192152. [DOI] [PMC free article] [PubMed] [Google Scholar]
- Han J, Mayo J, Xu X, Li J, Bringas P, Jr., Maas RL, Rubenstein JL, Chai Y. Indirect modulation of Shh signaling by Dlx5 affects the oral-nasal patterning of palate and rescues cleft palate in Msx1-null mice. Development. 2009;136:4225–4233. doi: 10.1242/dev.036723. [DOI] [PMC free article] [PubMed] [Google Scholar]
- Hochheiser H, Aronow BJ, Artinger K, Beaty TH, Brinkley JF, Chai Y, Clouthier D, Cunningham ML, Dixon M, Donahue LR, Fraser SE, Hallgrimsson B, Iwata J, Klein O, Marazita ML, Murray JC, Murray S, de Villena FP, Postlethwait J, Potter S, Shapiro L, Spritz R, Visel A, Weinberg SM, Trainor PA. The FaceBase Consortium: A comprehensive program to facilitate craniofacial research. Dev Biol. 2011;355:175–182. doi: 10.1016/j.ydbio.2011.02.033. [DOI] [PMC free article] [PubMed] [Google Scholar]
- Holm TM, Habashi JP, Doyle JJ, Bedja D, Chen Y, van Erp C, Lindsay ME, Kim D, Schoenhoff F, Cohn RD, Loeys BL, Thomas CJ, Patnaik S, Marugan JJ, Judge DP, Dietz HC. Noncanonical TGFbeta signaling contributes to aortic aneurysm progression in Marfan syndrome mice. Science. 2011;332:358–361. doi: 10.1126/science.1192149. [DOI] [PMC free article] [PubMed] [Google Scholar]
- Irizarry RA, Hobbs B, Collin F, Beazer-Barclay YD, Antonellis KJ, Scherf U, Speed TP. Exploration, normalization, and summaries of high density oligonucleotide array probe level data. Biostatistics. 2003;4:249–264. doi: 10.1093/biostatistics/4.2.249. [DOI] [PubMed] [Google Scholar]
- Ito Y, Yeo JY, Chytil A, Han J, Bringas P, Jr., Nakajima A, Shuler CF, Moses HL, Chai Y. Conditional inactivation of Tgfbr2 in cranial neural crest causes cleft palate and calvaria defects. Development. 2003;130:5269–5280. doi: 10.1242/dev.00708. [DOI] [PubMed] [Google Scholar]
- Iwata J, Hosokawa R, Sanchez-Lara PA, Urata M, Slavkin H, Chai Y. Transforming growth factor-beta regulates basal transcriptional regulatory machinery to control cell proliferation and differentiation in cranial neural crest-derived osteoprogenitor cells. J Biol Chem. 2010;285:4975–4982. doi: 10.1074/jbc.M109.035105. [DOI] [PMC free article] [PubMed] [Google Scholar]
- Iwata J, Parada C, Chai Y. The mechanism of TGF-beta signaling during palate development. Oral Dis. 2011a;17:733–744. doi: 10.1111/j.1601-0825.2011.01806.x. [DOI] [PMC free article] [PubMed] [Google Scholar]
- Iwata J, Tung L, Urata M, Hacia JG, Pelikan R, Suzuki A, Ramenzoni L, Chaudhry O, Parada C, Sanchez-Lara PA, Chai Y. Fibroblast growth factor 9 (FGF9)-pituitary homeobox 2 (PITX2) pathway mediates transforming growth factor beta (TGFbeta) signaling to regulate cell proliferation in palatal mesenchyme during mouse palatogenesis. J Biol Chem. 2011b;287:2353–2363. doi: 10.1074/jbc.M111.280974. [DOI] [PMC free article] [PubMed] [Google Scholar]
- Iwata J, Hacia JG, Suzuki A, Sanchez-Lara PA, Urata M, Chai Y. Modulation of noncanonical TGF-beta signaling prevents cleft palate in Tgfbr2 mutant mice. J Clin Invest. 2012;122:873–885. doi: 10.1172/JCI61498. [DOI] [PMC free article] [PubMed] [Google Scholar]
- Jugessur A, Shi M, Gjessing HK, Lie RT, Wilcox AJ, Weinberg CR, Christensen K, Boyles AL, Daack-Hirsch S, Trung TN, Bille C, Lidral AC, Murray JC. Genetic determinants of facial clefting: Analysis of 357 candidate genes using two national cleft studies from Scandinavia. PLoS ONE. 2009;4:e5385. doi: 10.1371/journal.pone.0005385. [DOI] [PMC free article] [PubMed] [Google Scholar]
- Keber R, Motaln H, Wagner KD, Debeljak N, Rassoulzadegan M, Acimovic J, Rozman D, Horvat S. Mouse knockout of the cholesterogenic cytochrome P450 lanosterol 14alpha-demethylase (Cyp51) resembles Antley-Bixler syndrome. J Biol Chem. 2011;286:29086–29097. doi: 10.1074/jbc.M111.253245. [DOI] [PMC free article] [PubMed] [Google Scholar]
- Kirov SA, Zhang B, Snoddy JR. Association analysis for large-scale gene set data. Methods Mol Biol. 2007;408:19–33. doi: 10.1007/978-1-59745-547-3_2. [DOI] [PubMed] [Google Scholar]
- Krapels IP, van Rooij IA, Ocke MC, West CE, van der Horst CM, Steegers-Theunissen RP. Maternal nutritional status and the risk for orofacial cleft offspring in humans. J Nutr. 2004;134:3106–3113. doi: 10.1093/jn/134.11.3106. [DOI] [PubMed] [Google Scholar]
- Lee YH, Saint-Jeannet JP. Sox9 function in craniofacial development and disease. Genesis. 2011;49:200–208. doi: 10.1002/dvg.20717. [DOI] [PMC free article] [PubMed] [Google Scholar]
- Loeys BL, Chen J, Neptune ER, Judge DP, Podowski M, Holm T, Meyers J, Leitch CC, Katsanis N, Sharifi N, Xu FL, Myers LA, Spevak PJ, Cameron DE, De Backer J, Hellemans J, Chen Y, Davis EC, Webb CL, Kress W, Coucke P, Rifkin DB, De Paepe AM, Dietz HC. A syndrome of altered cardiovascular, craniofacial, neurocognitive and skeletal development caused by mutations in TGFBR1 or TGFBR2. Nat Genet. 2005;37:275–281. doi: 10.1038/ng1511. [DOI] [PubMed] [Google Scholar]
- Marazita ML. The evolution of human genetic studies of cleft lip and cleft palate. Annu Rev Genomics Hum Genet. 2012;13:18.11–18.21. doi: 10.1146/annurev-genom-090711-163729. [DOI] [PMC free article] [PubMed] [Google Scholar]
- Marcano AC, Doudney K, Braybrook C, Squires R, Patton MA, Lees MM, Richieri-Costa A, Lidral AC, Murray JC, Moore GE, Stanier P. TBX22 mutations are a frequent cause of cleft palate. J Med Genet. 2004;41:68–74. doi: 10.1136/jmg.2003.010868. [DOI] [PMC free article] [PubMed] [Google Scholar]
- Meng L, Bian Z, Torensma R, Von den Hoff JW. Biological mechanisms in palatogenesis and cleft palate. J Dent Res. 2009;88:22–33. doi: 10.1177/0022034508327868. [DOI] [PubMed] [Google Scholar]
- Michaud EJ, Yoder BK. The primary cilium in cell signaling and cancer. Cancer Res. 2006;66:6463–6467. doi: 10.1158/0008-5472.CAN-06-0462. [DOI] [PubMed] [Google Scholar]
- Mleczko-Sanecka K, Casanovas G, Ragab A, Breitkopf K, Muller A, Boutros M, Dooley S, Hentze MW, Muckenthaler MU. SMAD7 controls iron metabolism as a potent inhibitor of hepcidin expression. Blood. 2010;115:2657–2665. doi: 10.1182/blood-2009-09-238105. [DOI] [PubMed] [Google Scholar]
- Mossey P. Epidemiology underpinning research in the aetiology of orofacial clefts. Orthod Craniofac Res. 2007;10:114–120. doi: 10.1111/j.1601-6343.2007.00398.x. [DOI] [PubMed] [Google Scholar]
- Mossey PA, Little J, Munger RG, Dixon MJ, Shaw WC. Cleft lip and palate. Lancet. 2009;374:1773–1785. doi: 10.1016/S0140-6736(09)60695-4. [DOI] [PubMed] [Google Scholar]
- Neufeld G, Cohen T, Gengrinovitch S, Poltorak Z. Vascular endothelial growth factor (VEGF) and its receptors. FASEB J. 1999;13:9–22. [PubMed] [Google Scholar]
- Nigg EA, Stearns T. The centrosome cycle: Centriole biogenesis, duplication and inherent asymmetries. Nat Cell Biol. 2011;13:1154–1160. doi: 10.1038/ncb2345. [DOI] [PMC free article] [PubMed] [Google Scholar]
- Noble NA, Harper JR, Border WA. In vivo interactions of TGF-beta and extracellular matrix. Prog Growth Factor Res. 1992;4:369–382. doi: 10.1016/0955-2235(92)90017-c. [DOI] [PubMed] [Google Scholar]
- Pauws E, Hoshino A, Bentley L, Prajapati S, Keller C, Hammond P, Martinez-Barbera JP, Moore GE, Stanier P. Tbx22null mice have a submucous cleft palate due to reduced palatal bone formation and also display ankyloglossia and choanal atresia phenotypes. Hum Mol Genet. 2009;18:4171–4179. doi: 10.1093/hmg/ddp368. [DOI] [PMC free article] [PubMed] [Google Scholar]
- Pezzini A, Del Zotto E, Giossi A, Volonghi I, Costa P, Padovani A. Transforming growth factor beta signaling perturbation in the Loeys-Dietz syndrome. Curr Med Chem. 2012;19:454–460. doi: 10.2174/092986712803414286. [DOI] [PubMed] [Google Scholar]
- Porter FD, Herman GE. Malformation syndromes caused by disorders of cholesterol synthesis. J Lipid Res. 2011;52:6–34. doi: 10.1194/jlr.R009548. [DOI] [PMC free article] [PubMed] [Google Scholar]
- Pounds S, Cheng C. Improving false discovery rate estimation. Bioinformatics. 2004;20:1737–1745. doi: 10.1093/bioinformatics/bth160. [DOI] [PubMed] [Google Scholar]
- Qi J, Chi L, Labeit S, Banes AJ. Nuclear localization of the titin Z1Z2Zr domain and role in regulating cell proliferation. Am J Physiol Cell Physiol. 2008;295:C975–C985. doi: 10.1152/ajpcell.90619.2007. [DOI] [PubMed] [Google Scholar]
- Shaw GM, Carmichael SL, Laurent C, Rasmussen SA. Maternal nutrient intakes and risk of orofacial clefts. Epidemiology. 2006;17:285–291. doi: 10.1097/01.ede.0000208348.30012.35. [DOI] [PubMed] [Google Scholar]
- Smyth GK. Linear models and empirical bayes methods for assessing differential expression in microarray experiments. Stat Appl Genet Mol Biol. 2004;3 doi: 10.2202/1544-6115.1027. Article 3. [DOI] [PubMed] [Google Scholar]
- Sozen MA, Hecht JT, Spritz RA. Mutation analysis of the PVRL1 gene in caucasians with nonsyndromic cleft lip/palate. Genet Test Mol Biomarkers. 2009;13:617–621. doi: 10.1089/gtmb.2009.0052. [DOI] [PMC free article] [PubMed] [Google Scholar]
- Tobin JL, Beales PL. The nonmotile ciliopathies. Genet Med. 2009;11:386–402. doi: 10.1097/GIM.0b013e3181a02882. [DOI] [PubMed] [Google Scholar]
- Todorovic V, Rifkin DB. LTBPs, more than just an escort service. J Cell Biochem. 2012;113:410–418. doi: 10.1002/jcb.23385. [DOI] [PMC free article] [PubMed] [Google Scholar]
- Wang Y, McClelland M, Xia XQ. Analyzing microarray data using WebArray. Cold Spring Harb Protoc. 2009;4 doi: 10.1101/pdb.prot5260. [DOI] [PubMed] [Google Scholar]
- Wipff PJ, Hinz B. Integrins and the activation of latent transforming growth factor beta1—An intimate relationship. Eur J Cell Biol. 2008;87:601–615. doi: 10.1016/j.ejcb.2008.01.012. [DOI] [PubMed] [Google Scholar]
- Wu M, Li J, Engleka KA, Zhou B, Lu MM, Plotkin JB, Epstein JA. Persistent expression of Pax3 in the neural crest causes cleft palate and defective osteogenesis in mice. J Clin Invest. 2008;118:2076–2087. doi: 10.1172/JCI33715. [DOI] [PMC free article] [PubMed] [Google Scholar]
- Yu Y, Kovacevic Z, Richardson DR. Tuning cell cycle regulation with an iron key. Cell Cycle. 2007;6:1982–1994. doi: 10.4161/cc.6.16.4603. [DOI] [PubMed] [Google Scholar]
Associated Data
This section collects any data citations, data availability statements, or supplementary materials included in this article.