Abstract
Quantifying the number of nanoparticles present in tissue is central to many in vivo and in vitro applications. Magnetic nanoparticles can be detected with high sensitivity both in vivo and in vitro using the harmonics of their magnetization produced in a sinusoidal magnetic field. However, relaxation effects damp the magnetic harmonics rendering them of limited use in quantitation. We show that an accurate measure of the number of nanoparticles can be made by correcting for relaxation effects. Correction for relaxation reduced errors of 50% for larger nanoparticles in high relaxation environments to 2%. The result is a method of nanoparticle quantitation capable of in vivo and in vitro applications including histopathology assays, quantitative imaging, drug delivery and thermal therapy preparation.
Keywords: Magnetic nanoparticle quantitation, MSB, MPI
1 Introduction
The number of nanoparticles present in tissue and samples is central to many in vivo and in vitro magnetic nanoparticles (NPs) applications. Quantification is critical to bio-sensing and histology and is becoming more important in medical imagining applications. A quantitative nanoparticle assay is important in histology [1] and bio-sensing [2] where specific protein expression is estimated from the number of bound antibody targeted magnetic nanoparticles. The quantitative nature of magnetic particle imaging (MPI) [3] remains central to its appeal [4–8]. Quantitative estimation of the number of magnetic nanoparticles is perhaps most critical in therapeutic applications including thermal ablation, hyperthermia and nanoparticle drug delivery. The number of NPs determines the amount of drug released from magnetically activated carriers [9] in nanoparticle drug delivery. The amount of iron present determines the temperature increase for a given applied field [10] so the number of NPs present is necessary to predict the results of thermal therapies and to determine when more NPs are required [11].
Vibrating sample magnetometers provide quantitative estimates of the number of NPs present in small liquid samples but they cannot be used in vivo or with unhomogenized samples. AC susceptibility has also been used to measure NP quantities [12, 13] and is able to quantify more than one NP size but requires the use a SQUID and changes the temperature of the sample. Mass spectrometers are also capable of providing the total amount of iron but they are unable to distinguish hemoglobin from NPs. MRI quantitation of magnetic NPs requires isolation of other susceptibility effects, which is challenging because of the quantity of those effects.
Magnetic NPs can be detected with very high sensitivity by measuring the harmonics of their magnetization in an applied sinusoidal magnetic field. The magnetization contains signal at the harmonic frequencies where there are no other sources of signal so very small amounts of iron can be detected. The in vivo detection limit is on the order of 10 nanograms of iron [7]. The signal at the harmonic frequencies is proportional to the number of NPs only if relaxation effects are invariant. The dominant relaxation mechanisms are Néel for smaller NPs and Brownian for larger NPs. Néel relaxation occurs as the magnetization changes direction due to reconfiguration of the electrons within the crystal and depends on the size of the NP and the temperature while Brownian relaxation occurs as the nanoparticles physically rotate so it depends on a wide array of environmental factors including viscosity and chemical binding. Brownian relaxation is sensitive enough that it has been used to measure temperature [14, 15], viscosity [16, 17] and chemical binding [18, 19]. When quantitative measures are required, the NP size is kept small to minimize Brownian relaxation [7]. For larger NPs used for many therapeutic [20] and sensing [14, 16, 18, 21–24] applications, Brownian relaxation is complicated and has a large effect on the signal at the harmonic frequencies.
The Néel process does not depend on environmental effects such as viscosity and binding so it is less sensitive to environmental factors that could change during an experiment. However, Néel relaxation does depend on temperature, which can change in vivo.
Our hypothesis was that the number of magnetic NPs could be accurately estimated even in the Brownian relaxation domain by compensating for relaxation effects. Relaxation effects can impact the signal easily by a factor of two. NP relaxation times can be estimated using magnetic spectroscopy of nanoparticle Brownian motion (MSB) [25]. Here we introduce a method of using the estimated relaxation time to compensate for relaxation effects so the weight of nanoparticles in the sample can be estimated using the MSB signal. The relaxation time is estimated from the ratio of two of the harmonics because the ratio is independent of NP concentration. The estimated relaxation time is then used to scale the individual normalized harmonics (as opposed to the ratios) at which point the signal size is directly proportional to the amount of nanoparticles present.
2 Methods
2.1 Theoretical Basis
The magnetization formed from an ensemble of magnetic NPs can be described using the stochastic Langevin equation for the orientations of the NP magnetizations [26]. The time dependence allows us to scale the MSB signal as a function of frequency to estimate the relaxation time [23]. It is then possible to correct the measured harmonics for changes in relaxation time and the result is directly proportional to the number of NPs present.
The relaxation time can be found by capitalizing on the frequency dependence of the Langevin equation for a sinusoidal applied field. The magnetization, M(t), is a function of the product of the frequency of the applied field, ω, and relaxation time of the nanoparticles, τ [23]. For any periodic magnetic field with frequency ω and period T, the magnetization produced by an ensemble of NPs can be written as a Fourier series [27]:
| (1) |
where the product of the mass susceptibility, χm, times the density of iron nanoparticles, ρ, is the equilibrium magnetic susceptibility [28], t is time, Ho and ω are the amplitude and frequency of the applied sinusoidal magnetic field. The Fourier coefficients reflect not only the shape of the applied magnetic field but also the nonlinearities in the magnetization’s response, which is also periodic:
| (2) |
The relaxation time characterizes the stability of the magnetization’s orientation over time when the applied field is changed and is a combination of Néel and Brownian relaxation processes. The signal detected is the time derivative of the magnetic flux through the coil, which is a unitless geometric coupling factor, G, times the time derivative of the magnetization so the measured harmonics are:
| (3) |
where the out of phase signal is represented as the complex portion of the harmonic. The ratio of the harmonics is a function of the ωτ product:
| (4) |
so scaling the frequency produces the same effect as scaling the relaxation time, which enables the relaxation time to be measured [23]. The relaxation time is measured by estimating the scale factor, S, that minimizes the difference between the ratio of the harmonics,|Ru (Sωτu) − Rr (ωτr)|, where Ru is the ratio of the harmonics from the unknown sample and Rr is the ratio from the reference sample. Geometrically, that scale factor aligns the ratios of harmonics of the unknown bound state, τu, with that of the reference bound state, τr. The resulting scale factor is the ratio of the relaxation times so the unknown relaxation time can be found from the reference relaxation time [23]:
| (5) |
The concept underpinning this relationship is that the functional form describing the harmonics is identical for any given ensemble of nanoparticles; it is only the relaxation time that changes when the bound state changes.
The measured harmonics can be corrected for relaxation effects by scaling the normalized values using the scale factor S. The normalized harmonic for the unknown state, F3n = F3/ω, when scaled is:
| (6) |
The scaled harmonic from the unknown bound state in Eq. 6 is exactly that of the reference harmonic except for the density of iron. Therefore, the ratio of the two normalized harmonics is equal to the ratio of the densities of iron nanoparticles allowing the density of iron nanoparticles in the unknown sample to be calculated:
| (7) |
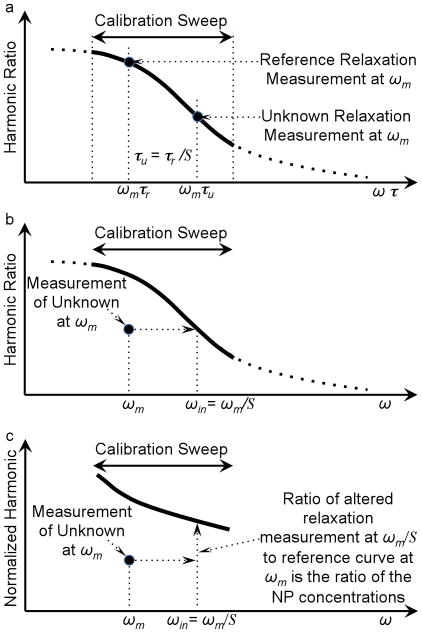
The process of estimating the nanoparticle density is diagramed in Fig. 1.
Figure 1.
Diagram of the method of estimating the NP weight quantitatively by correcting for relaxation. a) The harmonic ratio as a function of ωτ for a reference ensemble of NPs measured over a range of frequencies, the calibration curve, and the harmonic ratio for an ensemble of NPs with an unknown relaxation time measured at frequency, ωτm. Recall from Eq. 5 the scale factor, S, as the ratio of the reference relaxation time, τr, over the unknown relaxation time, τu. In this example, the unknown sample has less rotational freedom so τu > τr so S < 1 and the harmonic ratio for the unknown sample shifts to the right on the curve shown in a). b) Harmonic ratios from a known reference sample and the sample with unknown relaxation as a function of ω. The scaling factor, S, is found scaling the harmonic ratio for the unknown sample so it is on the curve formed by the reference data. c) The harmonics normalized by frequency for both the reference sample and the unknown sample. The unknown is also shown shifted in frequency to compensate for the relaxation found in b). When shifted in frequency, the ratio of the signal from the unknown to that of the reference sample is the ratio of the weights of NPs in the two samples.
2.2 Numerical Methods
The calibration data measured with NPs in the reference state at a range of sampled frequencies, ωj ∈ [ωL, ωH], are F3r(ωj) and F5r(ωj). The measurement of the NPs in the unknown state at one or more frequencies, ωm, are F3u(ωm) and F5u(ωm). The scale change, S, characterizing the change in relaxation, described in more detail elsewhere [23], can be written in terms of the interpolated frequencies, ωin, at which the harmonic ratio for the unknown state equals that of the reference state, Ru(ωin) = Rr(ωj), shown graphically by the horizontal arrow in Fig. 1b. The interpolated frequencies can generally be found using a cubic spline interpolation if the reference data is sampled at enough frequencies. The scale factor is simply a ratio of ωm over ωin if the unknown state is only measured at one frequency. If the unknown state is measured at more than one frequency, the least squares solution for the scale factor is:
| (8) |
The values of the reference harmonics at the shifted frequencies, Sωm, can be estimated using a cubic spline interpolation, Fr(Sωm)interp. If the unknown sample was only measured at one frequency, the density of NPs in the unknown sample can be calculated by multiplying the density of NPs in the reference sample by the ratio of the normalized harmonics. If the harmonics from the unknown sample were measured at multiple frequencies, a least squares estimate of the density of iron nanoparticles can be made:
| (9) |
The estimate can also be made from the fifth harmonic or an uncertainty weighted average of the two, however, the fifth harmonic adds little because it is generally so much smaller than the third harmonic. It should be noted that an alternative estimate of the density of iron nanoparticles can be made by interpolating the unknown bound state to the reference state instead of interpolating the reference state to the unknown state as above. The reason we have not used this alternative is that interpolation should generally be performed on the most completely sampled data to minimize errors and the reference measurements are generally better sampled for most experiments. However, the alternative does present possibilities that could be pursued in future efforts.
2.3 Experimental Methods
Three sets of twenty five samples with five quantities of iron oxide nanoparticles (approximately 1 mg, 0.7 mg, 0.5 mg, 0.3 mg, 0.1 mg) and five quantities of glycerol (0%, 7%, 13%, 20%, 28%) were prepared. Glycerol changes the relaxation time so the twenty five samples provided a grid of relaxation times and NP weights. PBS was added to equalize the volumes. The exact quantities of iron and glycerol in each sample were calculated from the measured weights. MSB signals were recorded for each sample at frequencies (290 Hz, 510 Hz, 737 Hz, 1050 Hz, 1270 Hz, 1740 Hz, 2110 Hz). Starch coated 100 nm bionized nanoferrite BNF NPs (Micromod Partikeltechnologie GmbH, Rostock-Warnemuende, Germany) were used in all of the experiments for Brownian motion. The mean hydrodynamic diameter measured using the Malvern (Worcestershire, UK) ZetaSizer Nano ZS was 116 nm and their manufactured iron concentration was 25 mg/mL.
The experiments with smaller NPs where Neel relaxation dominated were performed using polymer coated 25nm iron oxide particles (Ocean NanoTech, LLC) in agar gel to eliminate Brownian relaxation. The hydrodynamic size is reported as 31.80nm, and their manufactured iron concentration is 5 mg/mL. The MSB signals were acquired from five samples (0.2 mg, 0.15 mg, 0.1 mg, 0.05mg of NPs) at four relaxation times (temperatures of 20°C, 30°C, 40°C, 45°C).
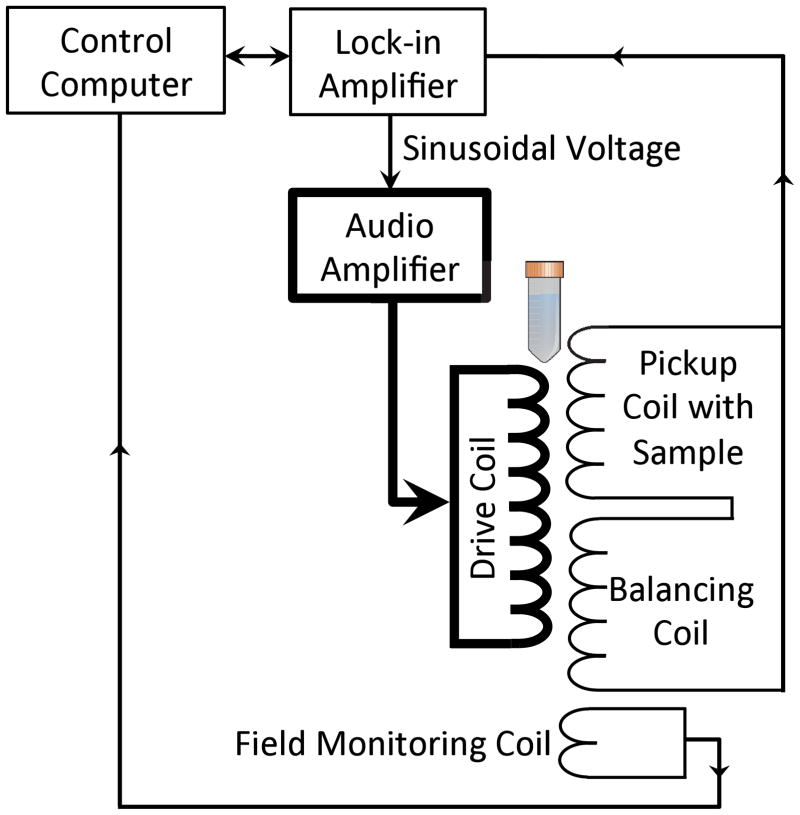
The MSB spectrometer used to measure the magnetization has been described previously [23, 29] and is diagramed in Fig. 2. Briefly, the drive field was generated from a pure sinusoidal voltage, generated by a phase-lock amplifier (SRS SR830), amplified by an audio power amplifier (QSC PL 236) and driving a current through a resonant coil. A computer-controlled relay bank was used to place different capacitors into series with the drive coil changing the resonant frequency of the coil. Seven resonant frequencies were used: 290Hz, 510Hz, 755Hz, 1050Hz, 1270Hz, 1740Hz, and 2110Hz. A pickup coil recorded the applied magnetic field induced by the NP magnetization. The pickup coil was connected in series with a balancing coil of opposite polarity but placed down the drive coil away from the NP sample so it only recorded the drive field. The pickup coil and balancing coil combination effectively canceled the current generated in the pickup coil by the drive field. A phase-lock amplifier was used to amplify and record the harmonics generated by the NP sample. A third coil was used to monitor and adjust the amplitude of the applied field. Only data where the reference frequency range was wide enough that there were points on either side of the interpolated values were used in the analysis.
Figure 2.
Diagram of the apparatus used to measure the MSB signals from samples of magnetic nanoparticles. The pickup coil and balancing coil were fixed inside the drive coil producing the applied field. The pickup and balancing coils were connected in series and the output was measured using the phase-lock amplifier. The computer controlled the phase-lock amplifier and the switched capacitors, which together determined the drive field amplitude and frequency. The computer also recorded the phase-lock amplifier measurements of the third and the fifth harmonics. The ADC card in the computer sampled the drive field as the phase-lock amplifier sampled the harmonics to maintain the field at the desired amplitude.
For each sample, the weight of NPs was calculated from: 1) the weights of NPs added to each sample, 2) a least squares of the ratios of the uncorrected MSB signal and the reference MSB signal and 3) Eq. 10 which is corrected for relaxation effects.
3 Results and Discussion
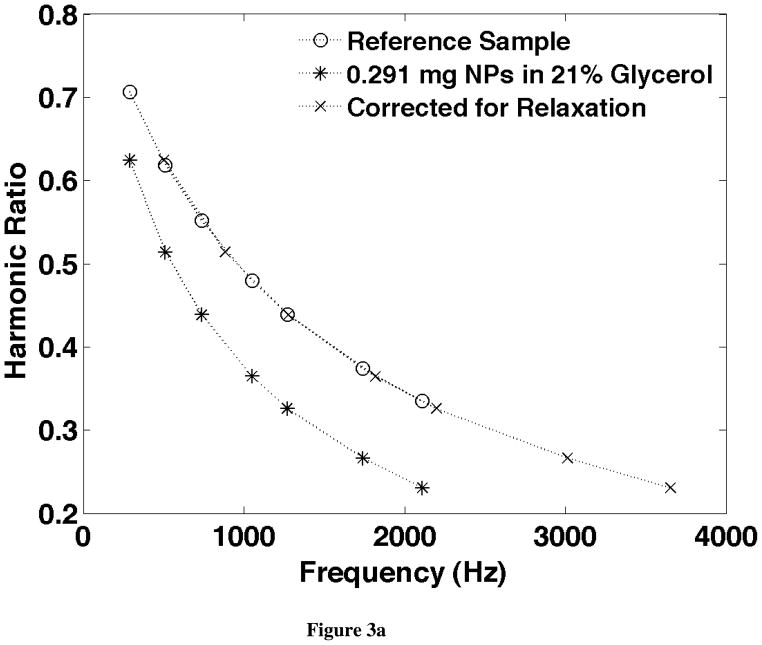
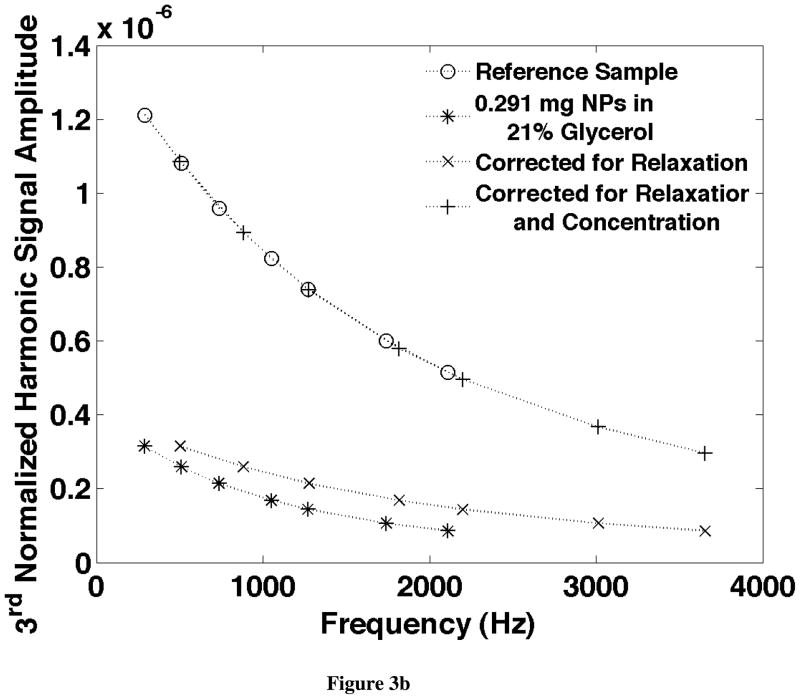
An example of the correction for relaxation effects is shown in Fig. 3. The frequency scaling that aligns the harmonic ratios is shown in Fig. 3a and the amplitude scaling of the frequency normalized harmonics is shown for the same data in Fig. 3b. These two figures correspond to the diagrams in Fig. 2 and show how well the data fits the theory.
Figure 3.
a) The ratio of the 5th over the 3rd harmonics from starch coated 100nm iron oxide NPs measured at seven frequencies between 290Hz and 2110Hz. The signal from the reference sample with a known quantity of NPs in a known solution (in this case with 0.988mg NPs in PBS) is compared to that from an unknown sample (in this case with 0.291mg NPs and 21% glycerol). By scaling the frequencies at which the unknown data is plotted, the two curves can be made coincident providing a relaxation time. b) The 3rd harmonic scaled by the frequency for the same sample shown in Fig. 3. The signal from the unknown sample is also plotted at frequencies scaled by the relaxation time found in a. The frequency scaled signals from the unknown sample were then scaled in amplitude to provide the weight of NPs: 0.287 mg which is 1.5% lower than the true value found from the weights of the materials forming the sample.
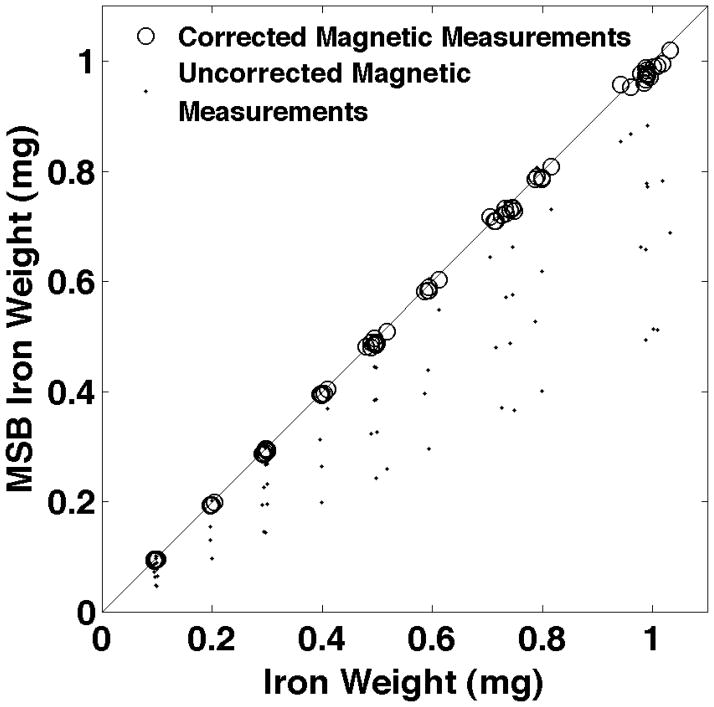
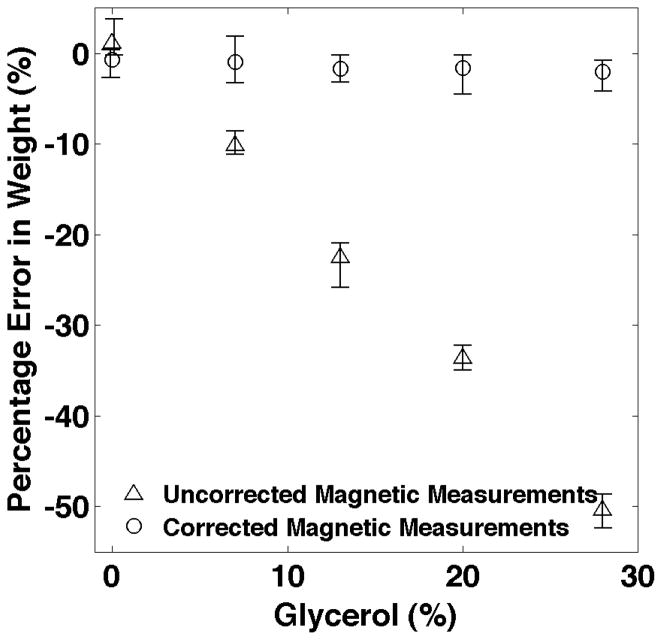
The estimated NP weights for all three groups of twenty five samples has been shown in Fig. 4. The largest errors in the uncorrected magnetic measurements occur when the relaxation effects are most pronounced which is for higher glycerol concentrations. The average percentage errors for each glycerol concentration are shown in Fig. 5. The RMS error for all of the relaxation corrected estimates of NP weight is 1.8% while the errors in the uncorrected NP weights average over 50% for the largest glycerol concentration.
Figure 4.
The MSB corrected magnetic measurement estimates of the NP weights plotted vs the true weights of NPs found from the weights of the components of the samples. Three sets of twenty five samples over a grid of NP weights and glycerol content are shown. Propagation of error could not be used to estimate the error in the corrected NP weights from the reproducibility of the MSB measurements because spline interpolation has no closed form solution. Therefore, we used repeated MSB measurements on each sample three times to estimate the reproducibility of the NP weighted. Reproducibility averaged 0.0025 mg (0.45%) which was smaller than the figure symbols so error bars were not used.
Figure 5.
The average percentage error for each concentration of glycerol. The largest errors in the uncorrected magnetic measurements occur when the relaxation effects are most pronounced which is for higher glycerol concentrations. The bars show the maximum and minimum percentage errors for each glycerol concentration.
Relaxation effects are larger for larger NPs where Brownian relaxation dominates. However, temperature changes also produce relaxation effects for smaller NPs where Néel relaxation dominates. Normally temperatures don’t vary enough to produce large relaxation effects but they are present. Temperature changes in degrees Kelvin tend to be relatively small in biological samples; the absolute temperature rarely changes by more than a few percent and the effect on relaxation is proportional. Changing the temperature from room temperature to 45°C produced only 2.27% errors in the estimated weight that is uncorrected for relaxation effects. Correction for relaxation reduced the errors in the estimated NP weights to 1.15%. The difference between the uncorrected estimates and the true weights was highly significant (p-value 10−20) but relatively small in magnitude. The difference between the MSB corrected estimates and the true weights was not significantly (p-value 0.12). The difference between the MSB corrected estimates and the uncorrected estimates was also highly significant (p-value 10−19).
4 Conclusions
The weight of magnetic NPs present in a sample can be accurately estimated using magnetic measurements if the harmonics are corrected for relaxation effects. The uncorrected magnetic measurements provide a poor estimate of the NP quantity if significant relaxation effects are unknown. Small NPs relaxing through the Neel mechanism had relatively small relaxation effects resulting from temperature changes. Larger NPs relaxing through the Brownian mechanism had much larger relaxation effects. NP weight estimates were significantly improved by compensating for relaxation effects in both cases. The technique presented effectively compensates for relaxation effects.
Acknowledgments
NIH-NCI 1U54CA151662-01
References
- 1.Krause HJ, Wolters N, Zhang Y, Offenhäusser A, Miethe P, Meyer MHF, Hartmann M, Keusgen M. Magnetic particle detection by frequency mixing for immunoassay applications. Journal of Magnetism and Magnetic Materials. 2007;311:436–444. [Google Scholar]
- 2.Jun Y, Seo J, Cheon J. Nanoscaling Laws of Magnetic Nanoparticles and Their Applicabilities in Biomedical Sciences. Accounts of Chemical Research. 2008;41:179–189. doi: 10.1021/ar700121f. [DOI] [PubMed] [Google Scholar]
- 3.Gleich B, Weizenecker J. Tomographic imaging using the nonlinear response of magnetic particles. Nature. 2005;435:1214–1217. doi: 10.1038/nature03808. [DOI] [PubMed] [Google Scholar]
- 4.Knopp T, Biederer S, Sattel T, Weizenecker J, Gleich B, Borgert J, Buzug TM. Trajectory analysis for magnetic particle imaging. Physics in medicine and biology. 2009;54:385–397. doi: 10.1088/0031-9155/54/2/014. [DOI] [PubMed] [Google Scholar]
- 5.Goodwill PW, Scott GC, Stang PP, Conolly SM. Narrowband Magnetic Particle Imaging. IEEE Transactions on Medical Imaging. 2009;28:1231–1237. doi: 10.1109/TMI.2009.2013849. [DOI] [PubMed] [Google Scholar]
- 6.Biederer S, Knopp T, Sattel TF, Lüdtke-Buzug K, Gleich B, Weizenecker J, Borgert J, Buzug TM. Magnetization response spectroscopy of superparamagnetic nanoparticles for magnetic particle imaging. Journal of Physics D: Applied Physics. 2009;42:205007. [Google Scholar]
- 7.Ferguson RM, Minard KR, Krishnan KM. Optimization of nanoparticle core size for magnetic particle imaging. J Magn Magn Mater. 2009;321:1548–1551. doi: 10.1016/j.jmmm.2009.02.083. [DOI] [PMC free article] [PubMed] [Google Scholar]
- 8.Weizenecker J, Gleich B, Rahmer J, Dahnke H, Borgert J. Three-dimensional real-time in vivo magnetic particle imaging. Physics in medicine and biology. 2009;54:L1–L10. doi: 10.1088/0031-9155/54/5/L01. [DOI] [PubMed] [Google Scholar]
- 9.Peiris Pubudu M, Bauer Lisa, Toy Randall, Tran Emily, Pansky Jenna, Doolittle Elizabeth, Schmidt Erik, Hayden Elliott, Mayer Aaron, Keri Ruth A, Griswold Mark A, Karathanasis E. Enhanced Delivery of Chemotherapy to Tumors Using a Multicomponent Nanochain with Radio-Frequency- Tunable Drug Release. ACS Nano. 2012;6:4157–4168. doi: 10.1021/nn300652p. [DOI] [PMC free article] [PubMed] [Google Scholar]
- 10.Hergt R, Hiergeist R, Zeisberger M, Glöckl G, Weitschies W, Ramirez LP, Hilger I, Kaiser WA. Enhancement of AC-losses of magnetic nanoparticles for heating applications. Journal of Magnetism and Magnetic Materials. 2004;280:358–368. [Google Scholar]
- 11.Brigger I, Dubernet C, Couvreur P. Nanoparticles in cancer therapy and diagnosis. Adv Drug Deliv Rev. 2012 doi: 10.1016/s0169-409x(02)00044-3. [DOI] [PubMed] [Google Scholar]
- 12.Gutiérrez L, Mejías R, Barber DF, Veintemillas-Verdaguer S, Serna CJ, Lázaro FJ, Morales MP. AC Magnetic susceptibility study of in vivo nanoparticle biodistribution. J Phys D: Appl Phys. 2011;44:255002, 255009pp. [Google Scholar]
- 13.Lopez A, Gutierrez L, Lazaro FJ. The role of dipolar interaction in the quantitative determination of particulate magnetic carriers in biological tissues. Physics in medicine and biology. 2007;52:5043–5056. doi: 10.1088/0031-9155/52/16/022. [DOI] [PubMed] [Google Scholar]
- 14.Weaver John B, Rauwerdink Adam M, Hansen EW. Magnetic nanoparticle temperature estimation. Medical Physics. 2009;36:1822–1829. doi: 10.1118/1.3106342. [DOI] [PMC free article] [PubMed] [Google Scholar]
- 15.Rauwerdink AM, Hansen EW, Weaver JB. Nanoparticle temperature estimation in combined ac and dc magnetic fields. Physics in medicine and biology. 2009;54:L51–55. doi: 10.1088/0031-9155/54/19/L01. [DOI] [PMC free article] [PubMed] [Google Scholar]
- 16.Rauwerdink AM, Weaver JB. Viscous effects on nanoparticle magnetization harmonics. Journal of Magnetism and Magnetic Materials. 2010;322:609–613. [Google Scholar]
- 17.Rauwerdink AM, Weaver JB. Harmonic phase angle as a concentration-independent measure of nanoparticle dynamics. Medical Physics. 2010;37:2587–2592. doi: 10.1118/1.3426294. [DOI] [PMC free article] [PubMed] [Google Scholar]
- 18.Rauwerdink AM, Weaver JB. Measurement of molecular binding using the Brownian motion of magnetic nanoparticle probes. Applied Physics Letters. 2010;96:033702. Also appears in February 033701, 032010 issue of Virtual Journal of Biological Physics Research. [Google Scholar]
- 19.Weaver JB, Rauwerdink AM. Quantitation of Nanoparticle Concentrations in Microscopic Bound States. Medical Physics. 2010;37:358. [Google Scholar]
- 20.Dennis CL, Jackson AJ, Borchers JA, Hoopes PJ, Strawbridge R, Foreman AR, Lierop Jv, Grüttner C, Ivkov R. Nearly complete regression of tumors via collective behavior of magnetic nanoparticles in hyperthermia. Nanotechnology. 2009;20:395103. doi: 10.1088/0957-4484/20/39/395103. [DOI] [PMC free article] [PubMed] [Google Scholar]
- 21.Giustini AJ, Ivkov R, Hoopes PJ. Magnetic nanoparticle biodistribution following intratumoral administration. Nanotechnology. 2011;22:345101–345105. doi: 10.1088/0957-4484/22/34/345101. [DOI] [PMC free article] [PubMed] [Google Scholar]
- 22.Rauwerdink AM, Weaver JB. Concurrent quantification of multiple nanoparticle bound states. Medical Physics. 2011;38:1136–1140. doi: 10.1118/1.3549762. [DOI] [PMC free article] [PubMed] [Google Scholar]
- 23.Weaver JB, Kuehlert E. Measurements of Magnetic Nanoparticle Relaxation Times. Medical Physics. 2012;39:2765–2770. doi: 10.1118/1.3701775. Also published in the May 2761, 2012 issue of Virtual Journal of Biological Physics Research. [DOI] [PMC free article] [PubMed] [Google Scholar]
- 24.Weaver JB, Scarlett UK, Rauwerdink AM, Fiering SN, Conejo-Garcia JR. Potential Ovarian Cancer Screening Method: Immunologically Targeted Nanoparticles Detected with Magnetic Spectroscopy of Nanoparticle Brownian Motion. Radiology, RSNA. 2011 [Google Scholar]
- 25.Weaver JB, Rauwerdink AM. “MSB estimation chemical binding affinity” SPIE Medical Imaging 7965–33, 2011. Proceedings of SPIE Medical Imaging. 2011;7965:33. [Google Scholar]
- 26.Reeves Daniel B, Weaver JB. Simulations of magnetic nanoparticle Brownian motion. Journal of Applied Physics. 2012;JR12:8177R8171. doi: 10.1063/1.4770322. [DOI] [PMC free article] [PubMed] [Google Scholar]
- 27.Bracewell R. The Fourier Transform and Its Applications. 2. McGraw-Hill; New York, NY: 1986. revised ed. [Google Scholar]
- 28.March HW. Magnetic Susceptibility of Mixtures of Solutions. Physical Review (Series I) 1907;24:29–36. [Google Scholar]
- 29.Weaver JB, Rauwerdink AM, Sullivan CR, Baker I. Frequency distribution of the nanoparticle magnetization in the presence of a static as well as a harmonic magnetic field. Medical Physics. 2008;35:1988–1994. doi: 10.1118/1.2903449. Also appears in Virtual Journal of Nanoscale Science & Technology, May 1985, Volume 1917, Issue 1918 (2008) [DOI] [PMC free article] [PubMed] [Google Scholar]


