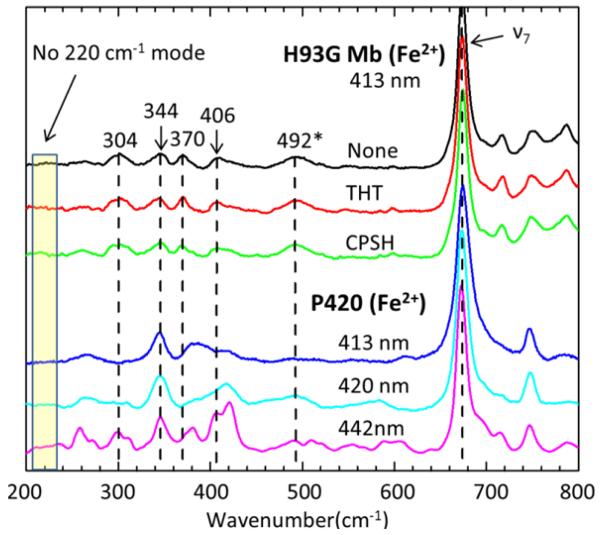
Figure 1.
Low frequency resonance Raman spectra of reduced H93G Mb, its THT and CPSH adducts, and ferrous P420cam. The excitation wavelength is 413 nm and the laser power at the sample is 11mw for the H93G samples, while for the P420 sample the excitation is 20mw at 413nm (blue), 25 mW at 420 nm (cyan) and 32mw at 442 nm (magenta). The sample cell is spinning at 6000 rpm. All spectra are normalized to the ν7 band. The 492 cm−1 feature also appears in Fig. 3 and is not assigned to a νFeCO mode.

