Summary
The discovery of potent BRAF inhibitors has revolutionized therapy for BRAF-mutant melanoma, yet NRAS-mutant melanoma remains without effective therapy. Since direct pharmacological inhibition of RAS has thus far been unsuccessful, we explored system biology approaches to identify synergistic drug combination(s) that can mimic direct RAS inhibition. Here, leveraging an inducible mouse model of NRAS-mutant melanoma, we show that pharmacological MEK inhibition activates apoptosis but fails to trigger cell cycle arrest, in contrast to complete NRAS extinction in vivo by genetic means. Network modeling pinpointed CDK4 as a key driver of this differential phenotype. Accordingly, combined pharmacological inhibition of MEK and CDK4 in vivo led to significant synergy in therapeutic efficacy. Taken together, our data suggest a gradient model of oncogenic NRAS signaling to the canonical MAPK cascade, where the output is gated, resulting in de-coupling of discrete downstream biological phenotypes in the setting of incomplete inhibition. Such a gated signaling model provides a novel framework to identify non-obvious co-extinction target(s) for combined pharmacological inhibition in NRAS-mutant melanomas.
Introduction
The RAS proto-oncogene is activated across diverse human cancers1, including 15–20% of melanomas which harbor activating NRAS mutations2. Agents that block its downstream canonical MAPK signaling components, including BRAF, MEK, or ERK, have matured rapidly with notably positive preclinical and clinical effects in several cancer types, particularly BRAF-mutant melanoma3–5. Clinically, single-agent MEK inhibition has been ineffective against NRAS-mutant melanoma6, while BRAF inhibitors have not been proven to be beneficial in RAS-mutant cancers7–10. Efforts to target oncogenic RAS mutants directly have been unsuccessful to date.
Traditionally, RAS pathway diagrams depict a linear canonical MAPK cascade consisting of RAS-RAF-MEK-ERK, as well as non-canonical signaling branches emanating from RAS, prominently the AKT pathway. This signaling model has guided combination strategies to target RAS, such as co-inhibition of the canonical MAPK (e.g. MEK) and AKT signaling11, or combined MEK and BRAF inhibition to maximize inhibition of MAPK signaling12. These advances aside, key questions remain, including to what extent RAS-MAPK signaling can be maximally inhibited given the redundancy of its signaling network, and whether there exists co-extinction strategies other than reinforcing inhibition of MAPK signaling to approximate RAS inhibition.
Keys to data-driven discovery of novel therapeutic combinations include not only robust computational platforms but also suitable and maneuverable experimental systems. Computational modeling of signaling pathways within individual cells have included a range of logic-based13 and probabilistic models14. However, modeling the kinetics of such a network on an organismal level requires not only appropriate in vivo physiological systems but also the ability to perturb such system with ease for data acquisition. Inducible conditional genetically engineered mouse (GEM) models offer the physiological systems in which to acquire global transcriptome and proteome data under various perturbation conditions (e.g. genetic inactivation; pharmacological inhibition) over time. Importantly, it provides discrete and specific phenotypic correlates on organismal (tumor growth and regression) and molecular (apoptosis and cell cycle arrest) levels in vivo. Integrating these input and output data would enable a system view of a particular state upon genetic or pharmacological inhibition to define non-obvious combination strategies.
In this study, we employed such a system-biology approach to discover evidence-based co-extinction strategies against NRAS mutant melanoma. In an inducible NRASQ61K-driven GEM model of melanoma, we interrogated the network of oncogenic NRAS signaling using both genetic and pharmacological perturbations. We show evidence for a model in which the signaling output downstream of NRAS-MEK-ERK is gated, resulting in decoupling of two major cancer biological phenotypes, proliferation and survival, which in turns provides the molecular basis for co-extinction of MEK and CDK4 to approximate NRAS inhibition.
Results
Mutant NRAS extinction, but not MEK inhibitor treatment, induces tumor regression
In the “iNRAS” GEM model of melanoma, expression of the melanoma signature mutation, NRASQ61K (or oncogenic NRAS) is controlled by a doxycycline-regulated tet-promoter on the background of a CDKN2A null allele, also a key human melanoma suppressor. Expression of NRASQ61K is restricted to melanocytes by use of the Tyr-rtTA transgene15. Administration of doxycycline at weaning turns on expression of the NRASQ61K transgene and results in spontaneous melanoma formation after an average of 15 weeks with a 50% penetrance (Supplementary Fig. 1a).
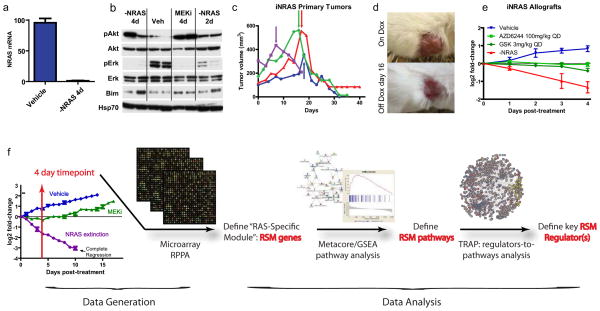
In established tumors of both primary de novo and allograft models, doxycycline withdrawal turns off the Tet promoter driving NRASQ61K expression. At 4 days post doxycycline withdrawal, we measured a complete extinction of NRASQ61K transgene expression (Fig. 1a). Western blotting at the same time point (Fig. 1b) confirmed a loss of a phospho-ERK (pERK) activity as expected. Phenotypically, loss of NRASQ61K expression in the established melanomas resulted in rapid, durable and complete tumor regression within 10 days (Fig. 1a–e), validating NRASQ61K as a tumor-maintenance oncogene.
Figure 1. Characterization of the iNRAS mouse melanoma model and experimental design.
(a)Transgene mRNA levels following 4 days of doxycycline withdrawal in iNRAS melanomas, by RT-PCR.(b)Western blot of pAkt, Akt, pErk, Erk, and Bim from iNras-413 tumors. Hsp70 is a loading control. (c) Tumor volumes from four independent iNras primary tumors. Arrows indicate start of doxycycline withdrawal. (d) Representative gross appearance of tumors before and after doxycycline withdrawal, which leaves a non-malignant scar. Tumor is the same as the red line in (c). (e)The effect of two different MEK inhibitors or doxycycline withdrawal on allograft tumor growth from iNRAS cell line 475.(f) Flow chart of the experimental design. Transcriptome data comparing genetic NRASQ61K extinction and pharmacological MEK inhibition is processed through statistical and network analyses to generate a “RAS-Specific Module” of genes, pathways, and ultimately pathway regulators. The tumor growth chart is taken from Fig. 5b.
In this same model system, we treated iNRAS melanoma-bearing mice with two different pharmacological MEK inhibitors (hereafter denoted as “MEKi” for short), specifically the second-generation MEK inhibitor Selumetinib (also known as AZD6244 or ARRY-142886)16 or the third-generation GSK1120212 (also known as JTP-74057)4. Similar to other studies with human NRAS mutant melanomas or xenografts6,17, we found that MEKi was unable to induce tumor regression, despite evidence that the canonical MAPK signaling was inhibited as measured by pERK (Fig. 1b). Specifically, both compounds at their respective maximally tolerated doses only produced tumor stasis but no tumor regression in contrast to genetic extinction of NRASQ61K (Fig. 1e). This suggests that MEK inhibitor treatment only partially inhibited oncogenic NRAS activity in this GEM model. Elucidation of the unaffected activity or activities downstream of NRASQ61K could lead to new target(s) for co-extinction with MEKi.
Molecular phenotypes of NRAS* extinction versus MEK inhibitor in vivo
Using genetic extinction of NRASQ61K as the “ground-truth” and the pharmacological perturbation by MEKi as the comparator, we reasoned that global transcriptomic profiles and network modeling could uncover, in an unbiased manner, pathways or activities downstream of oncogenic NRAS that are not impacted by MEKi. Such would represent candidate co-extinction targets that, in combination with MEKi, could approximate NRAS inhibition (Fig. 1f).
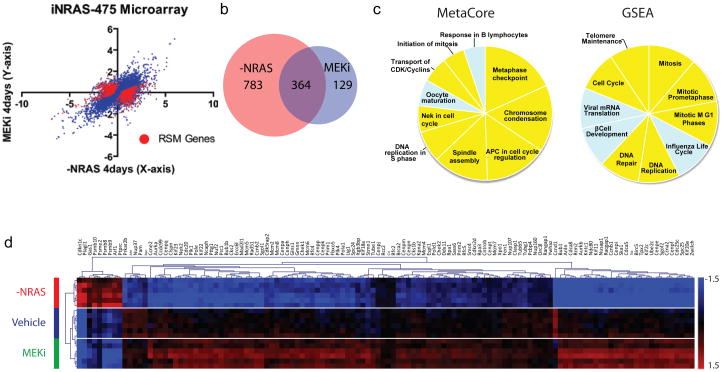
To this end, we compiled the transcriptomic profiles of iNRAS tumors upon these two perturbations. Specifically, we harvested iNRAS melanomas at 4 days post (i) doxycycline-withdrawal, (ii) pharmacological MEK inhibition (daily maximal tolerated doses of Selumetinib), or (iii) vehicle treatment (n=6 each) for transcriptome profiling (Fig. 2a). Using the criteria of 2-fold expression change and a q-value <10−3, we found that 74% (364/493) of the genes that are differentially regulated by Selumetinib were also similarly modulated by NRASQ61K extinction (Fig. 2b). As expected, this set of 364 overlapping genes was enriched for canonical downstream ERK targets and pathway sensors such as Maff, Fosl1, Spry4, Dusp4, and Etv418 (Supplementary Table 1), corroborating the western blot data showing that the canonical MAPK signaling has been inhibited in both settings (Fig. 1d).
Figure 2. RAS-Specific Module genes are highly enriched for cell cycle functions.
(a)Microarray data. The plot shows log2 fold-change values of doxycycline withdrawal versus AZD6244 after 4 days, each compared to vehicle in iNRAS-475 allografts. Each point represents an average value (n=6 each cohort). RAS-Specific Module genes with p-values < 10−5 are plotted in red. (b)Venn diagram showing the overlap of differentially expressed genes shared by both MEKi and NRASQ61K extinction. (c) Pie charts showing the top 10 RSM pathways defined by Metacore and GSEA analyses. Slice sizes reflect -log10(p-value) and normalized enrichment score (NES), respectively. Cell cycle and related pathways are highlighted in yellow.(d)Microarray heat map of RSM genes from significant GSEA cell cycle pathways, with unsupervised hierarchical clustering.
Next, to delineate the activity impacted by NRASQ61K extinction but not MEK inhibition, we defined a RAS-Specific Module or “RSM” comprising genes whose expressions were significantly regulated by NRASQ61K extinction, but showed either no change or a change in the opposite direction by Selumetinib treatment (see Supplementary Methods) (Fig. 2a and Supplemental Table 2). Knowledge-based pathway analyses by Metacore (GeneGo Inc.) and gene set enrichment analysis (GSEA)19 using an RSM-ranked list of genes (see Supplementary Methods) revealed a dominance of pathways directly related to cell cycle regulation (Fig. 2c,d and Supplementary Tables 3–4). No other canonical oncogenic signaling pathway, including PI3K, TGFβ, WNT, or JNK signaling (Supplementary Tables 3–4), showed statistically significant enrichment among the RSM genes.
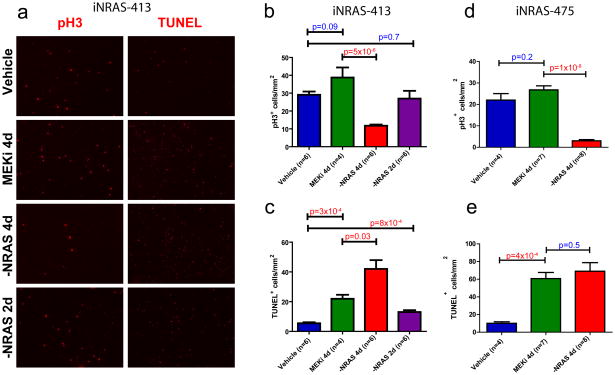
The above knowledge-based pathway analysis suggested that a major reason pharmacological MEK inhibition fails to induce tumor regression is its inability to engage the cell cycle checkpoint in iNRAS melanomas. This finding seems counter-intuitive given RAS/MEK/ERK signaling has been intimately linked to cell proliferation20. Thus, we sought to confirm this analytical result by quantitating mitosis and apoptosis intumor histological sections across two independent tumor cohorts. Staining for phospho-histone-H3 revealed a significant inhibition of mitotic activity after genetic extinction of NRAS* (Fig. 3a,b,d and Supplementary Fig. 1b). Consistent with the profiling data, no significant change in mitotic activity was measured in tumors treated with maximally tolerated doses of either Selumitinib or GSK1120212 after the fourth day of daily dosing (Fig. 3a,b,d and Supplementary Fig. 1b,c). In contrast, TUNEL staining for apoptotic cells revealed a significant induction of apoptosis by both genetic NRASQ61K extinction and pharmacological MEK inhibition (Fig. 3a,c,e and Supplementary Fig. 1b,c). Correspondingly, BimandBmf, known to be central to induction of apoptosis upon MAPK pathway inhibition21, were upregulated to similar extents by both NRASQ61K extinction and Selumetinib treatment on the mRNA and protein levels (Fig. 1d and Supplementary Fig. 2). Taken together, the experimental data and computational analyses collectively demonstrate that pharmacological MEK inhibition efficiently induces apoptosis but not cell cycle arrest, in contrast to the dual impact of NRASQ61K genetic extinction.
Figure 3. Cellular proliferation is inhibited by NRASQ61K extinction, but not MEK inhibition.
(a) Representative immunofluorescence staining of iNRAS-413 melanoma allografts to measure proliferation by phospho-histone-H3 (pH3) and apoptosis by TUNEL staining. See also Supplementary Fig. 1b. (b,c) Quantitation of (b) pH3 and (c) TUNEL positivity in iNRAS-413 allografts. (d,e)Quantitation of (d) pH3 and (e) TUNEL positivity in iNRAS-475 allografts. Two-tailed student’s t-tests were used to calculate p-values. All error bars are SEM.
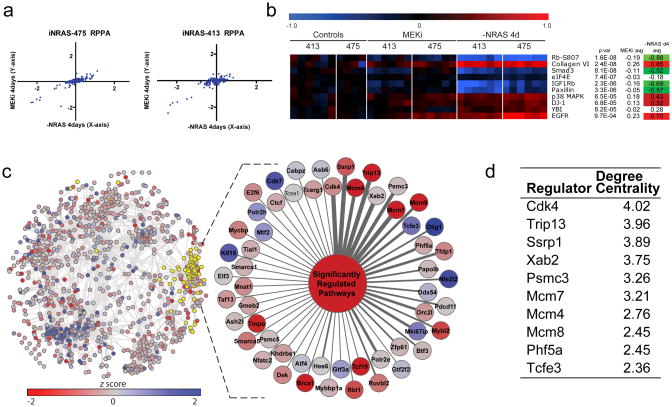
Further reinforcement of this conclusion derives from targeted proteome analysis by RPPA (reverse phase protein array) profiling of 120 signaling proteins and phospho-specific states. As expected, the genetic and pharmacological perturbations showed a similarly high degree of overlap in target inhibition (Fig. 4a). But in line with the gene expression analysis, the most significantly differentially-modulated RAS-specific protein across two independent cohorts was the phosphorylated and thus inactivated form of the RB tumor suppressor (Fig. 4b). Specifically, tumors subjected to NRASQ61K extinction harbored significantly lower levels of phosphorylated RB compared to those treated with MEK inhibitor or vehicle (Fig. 4b), suggesting that the RB checkpoint is differentially activated by these two perturbations.
Figure 4. The CDK4/RB axis regulates the RAS-Specific pathways.
(a)Reverse phase protein array data. The plot shows log2 fold-change values of doxycycline withdrawal versus AZD6244 after 4 days, each compared to vehicle in two independent iNRAS allograft cohorts. Each point represents an average value (n=6 each cohort except n=4 for iNRAS-475 vehicle). (b)RPPA heat map of the top 10 RSM proteins, including the RSM p-values (Fisher combined p-values, see Supplementary Methods) and averages. (c)TRAP network overlaid with microarray and GSEA data, colored by z-score. The yellow highlighted nodes represent the 41 significantly downregulated pathways identified through GSEA and the 55 first-neighbor regulator genes. The enlargement shows all 55 regulators connected to a generic node representing the downregulated pathways. See Supplementary Table 3 for all pathways. The regulators have been ordered clockwise based on the number of edges the regulator shares with the pathways, which is reflected in the edge thickness. (d)Top 10 pathway regulators ranked by gain in degree centrality, a measurement of regulator strength that takes into account both weighted edge strength and the normalized connectivity of the regulators in the sub network of RSM pathways versus all pathways. See Supplementary Table 7 for the full ranked list of 55 regulators.
Network modeling pinpoints CDK4 as a co-extinction target with MEK
To identify the lynchpin driving the molecular differences between the genetic and pharmacological perturbations, we employed a novel network inference algorithm, TRAP (Transcriptional Regulatory Associations in Pathways). In contrast to a gene-gene network, TRAP was designed to identify gene-pathway transcriptional regulatory relationships, where the gene is a transcriptional regulator and the pathway is a defined biological pathway or process (Supplementary Fig. 3 and Supplementary Methods). Briefly, a global regulator-pathway network for mouse was constructed based on a compendium of over 3,000 public microarray profiles spanning a wide range of experimental conditions and perturbations (but not including the profiles of iNRAS melanomas from this study). For each pathway defined by MSigDB v322, the average expression of its constituent genes (exclusive of the transcription regulators themselves) was taken as the measure for that pathway’s activity. Next, mutual information was computed for all regulator-pathway pairs, a background correction applied to account for off target, indirect regulation, and a statistic calculated. The resultant TRAP network (Fig. 4c) therefore captures the most significant regulator-pathway associations existing within the large compendium of expression profiles.
Using the TRAP network, we asked which regulators are most significantly linked to (i.e. candidate drivers of) the key pathway differences between genetic and pharmacological perturbations in the iNRAS model. We selected the first neighbor regulators connected to each of the highest-ranking 41 pathways enriched in the RAS-specific module by GSEA (FDR < 10−3). We next ranked the regulators based on degree centrality, a measure of the number and strength of the connections to these pathways. In this manner, TRAP ranked 55 candidate regulators connected to pathways enriched amongst the RSM genes (Fig. 4d and Supplementary Tables 5–7). Consistent with the experimental data showing cell cycle arrest as a key phenotypic difference, the most significant regulator ranked by TRAP was CDK4, a well-known proximal regulator of the RB-regulated G1/S cell cycle checkpoint. Importantly, the related cell cycle agonists CDK2 (which also phosphorylates RB), CDK7, and CDK9 were not ranked significantly.
In summary, global network modeling by TRAP not only confirmed the RB-regulated cell cycle checkpoint as a target differentially affected by genetic NRASQ61K extinction versus pharmacological MEK inhibition, but also pinpointed CDK4 as a key driver of the molecular differences correlating with the different phenotypic consequences, namely tumor regression versus tumor stasis.
Combined MEK and CDK4/6 inhibitor treatment is synergistic in vivo
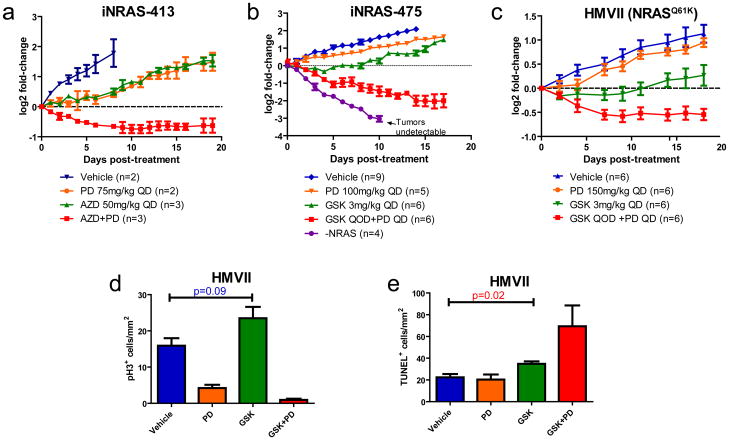
The unbiased network modeling analysis suggested CDK4 as a co-extinction target with MEK, which is consistent with the knowledge-based pathway analysis and histo-pathological characterization of the treated iNRAS melanomas. Since a selective inhibitor against CDK4/6, PD-0332991, is currently under clinical development, we next sought to experimentally validate this predicted synergy between MEK and CDK4 inhibition. Of note, PD-0332991 has been reported to inhibit cell proliferation in vivo without enhancing apoptosis23, unlike other cell cycle inhibitors targeting CDK1, CDK2, CDK9, AURK, or PLK24,25. As shown in Figure 5, in vivo co-administration of PD-0332991 and either Selumetinib(Fig. 5a) or GSK1120212 (Fig. 5b)indeed induced potent synergy in iNRAS allograft tumors, resulting in not just tumor stasis, but frank regression including two complete responses (i.e. no residual palpable tumor) in the GSK1120212 cohort (Fig. 5b and Supplementary Fig. 4a). Importantly, this efficacy was achieved at sub-maximal tolerated doses of each inhibitor. Similarly, in the NRAS-mutant human melanoma cell line HMVII, combined PD-0332991 and GSK1120212 treatment in xenograft tumors revealed synergistic anti-oncological efficacy (Fig. 5c). Specifically, MEK inhibition alone in this human melanoma xenograft induced apoptosis but not cell cycle arrest (Fig. 5d,e), establishing that this is not a mouse-specific phenomenon. CDK4/6 inhibitor treatment alone suppressed proliferation but did not impact on apoptosis. As predicted, the drug combination resulted in both apoptosis and cell cycle arrest in the xenograft tumors, with corresponding tumor regression (Fig. 5d,e). Although some weight loss was observed with PD-0332991 treatment as previously reported23, this was not significantly exacerbated by MEK inhibition (Supplementary Fig. 4b), suggesting a lack of adverse drug-drug interaction. In summary, in both GEM and human melanoma xenograft model systems, combined treatment with pharmacological inhibitors of CDK4 and MEK was potently synergistic as predicted.
Figure 5. Combination MEK and CDK4/6 Inhibition is synergistic in vivo.
(a)Mouse cell line iNRAS-413 allografts treated singly or in combination with PD0332991 and AZD6244. All error bars in this figure are SEM. (b)Mouse cell line iNRAS-475 allografts treated singly or in combination with PD0332991 and GSK1120212. Doxycycline withdrawal is shown for comparison. QD: daily. QOD: every other day. (c)Human NRAS*-mutant cell line HMVII xenografts treated singly or in combination with PD0332991 and GSK1120212. (d,e)Quantification of (d) phospho-histone-3 and (e) TUNEL positivity in HMVII tumors after 8 days of treatment.
Gated signaling of NRASQ61K activity decouples survival and proliferation
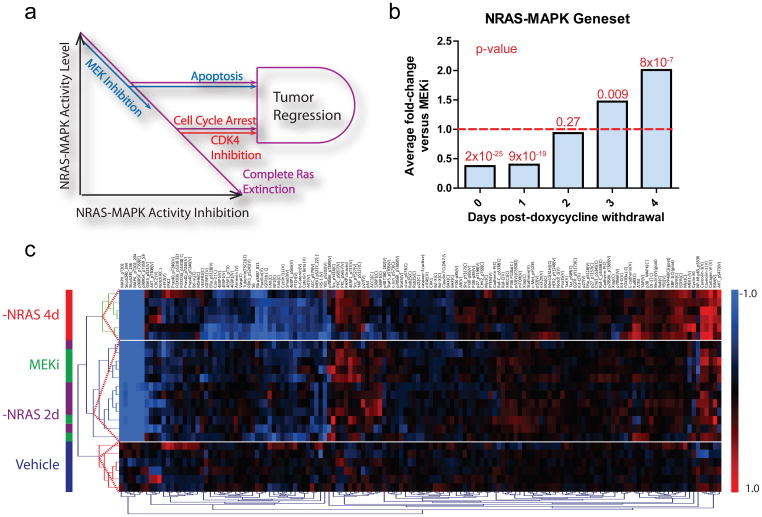
While there was a significant overlap in genes co-regulated by both MEKi and NRASQ61K extinction (Fig. 2b), especially amongst known canonical downstream ERK targets and pathway sensors (Supplementary Table 1), it was notable that genetic NRASQ61K extinction produced larger-amplitude global gene expression and protein changes when compared with MEKi (Fig. 2a and Fig. 4a). To quantify this, we defined a gene-set comprising 49 MAPK-regulated genes conserved between mouse and human (Supplementary Table 8 and Supplementary Methods)26–28, similar to gene-sets reported in other studies27,29. We then employed this gene-set as a surrogate measure of oncogenic NRASQ61K activity propagating down the canonical MAPK signaling cascade (hereafter referred to as “NRAS-MAPK activity”). Applying a paired student’s t-test to restrict the comparison to matched gene measurements while generating a signature-wide significance score, we found that, on average, genetic extinction of NRASQ61K was ~2-fold more effective than MEKi in suppressing MAPK signaling (P=7.8×10⁻⁷; Supplementary Table 8). This difference in degree of inhibition raised the possibility that NRAS-MAPK activity is not a binary on/off signal, but rather an analog output over a gradient. If downstream phenotypes such as proliferation and survival have differential sensitivities to the level of NRAS-MAPK activity, gated outputs would be generated (Fig. 6a). In other words, this model would predict that when NRAS-MAPK activity is only partially inhibited along the gradient (eg, by a pharmacological inhibitor of MEK), only apoptosis would be triggered if the residual MAPK signaling is sufficient to drive proliferation. Thus, complete (or near-complete) inhibition (eg, by genetic extinction) would be required to additionally induce cell cycle arrest.
Figure 6. NRAS-MAPK activity differentially regulates apoptosis and proliferation.
(a)A model of oncogenic NRAS signaling as a gradient with gated phenotypic outputs. As NRAS-MAPK activity is inhibited, apoptosis and cell cycle arrest are triggered at different levels of activity. Complete RAS extinction (purple) or combined MEK (blue) and CDK4 (red) inhibition complementarily trigger both phenotypes, fulfilling the dual input into the AND gate required for efficient tumor regression. (b)Comparison of average values of the NRAS-MAPK gene-set for MEKi versus doxycycline withdrawal time points. P-values are indicated above each bar. (c) Unsupervised hierarchical clustering of RPPA data from iNRAS-413 tumors treated with vehicle, MEKi, or 2 or 4 days of doxycycline withdrawal.
To test this hypothesis, we sought to create a state of partial genetic NRAS-MAPK inhibition similar to that achieved by pharmacological MEK inhibition. Specifically, we computed the NRAS-MAPK activity measure using the MAPK-regulated gene-set described above, based on transcriptome data of iNRAS melanomas post-doxycycline withdrawal over a four-day time-course. We found that the degree of NRAS-MAPK inhibition at 2-days post-doxycycline withdrawal was most similar to that achieved by MEKi(P=0.27; Fig. 6b and Supplementary Table 8). Reinforcing this, unsupervised hierarchical clustering of the RPPA profiles revealed co-clustering of the 2-days doxycycline withdrawal and MEK inhibitor groups (Fig. 6c). Taking these results to suggest a partial inhibition state at 2-days post doxycycline withdrawal, we next quantified iNRAS melanomas at this time point for proliferation and apoptosis by immunohistopathology. As shown in Figure 3, we found that iNRAS melanomas at 2-days post-doxycycline withdrawal showed no significant change in mitotic index (Fig. 3b)or pRB levels (Supplementary Fig. 5), but exhibited significantly elevated levels of apoptosis (Fig. 3c) and of BIM (Fig. 1d). In other words, partial genetic extinction of NRAS-MAPK activity resulted in the induction of apoptosis but not cell cycle arrest, similar to MEKi treatments. Taken together, these data support the model that oncogenic NRAS signaling to the canonical MAPK cascade is not binary but analog, producing a gradient of activity that triggers discrete biological phenotypes at different threshold levels (Fig. 6a).
Discussion
In this study, we exploited the experimental merits of the mouse and the vantage of systems biology to understand the actions of activated RAS signaling in cancer. By comparing the molecular changes induced by genetic NRASQ61K extinction versus pharmacological MEK inhibition using knowledge-based pathway analysis and global network modeling, followed by tumor-histopathological validation, we found that MEK inhibitors failed to engage the cell cycle checkpoint, resulting in only tumor stasis despite robust apoptosis. Using an intermediate time point at which NRAS-MAPK activity was only partially extinguished by genetic means, we provided experimental support for a gated model of canonical NRAS-MAPK signaling which regulates its two major downstream phenotypes at different threshold levels(Fig. 6a). Such gated output model explains the observation of MEKi inducing apoptosis but not cell cycle arrest in our iNRAS model, providing a rationale for combining CDK4 inhibitor with MEKi to achieve therapeutic synergy. Of note, a recent study has reported that CDK4 is synthetic lethal in KRAS mutant lung cancer cells30. Although the study did not suggest, either experimentally or mechanistically, that combined CDK4 and MEK inhibition could be synergistic, this finding of synthetic lethality raises the possibility that this gated-output model of NRAS-MAPK signaling could be operative in mutant KRAS signaling, in spite of differences in KRAS and NRAS functions31.
Our experimental findings are of clinical relevance since complete shut-off of oncogenic NRAS signaling to downstream RAF-MEK-ERK may be difficult to achieve pharmacologically given the redundant feedbacks and the likely induction of toxicity in patients32. The combined inhibition of two orthogonal targets may offer advantage of a wider therapeutic window given the differing toxicity profiles of two drugs32,33. More broadly, the gated signaling model provides a new framework to develop combination strategies for pathway inhibition, i.e. by complementing the partial inhibition by one drug with another that targets a decoupled phenotype of the same signaling pathway. That said, it is clear that co-inhibition of CDK4 and MEK, while synergistic, does not fully recapitulate the complete tumor regression phenotype achieved by genetic NRASQ61K extinction (Fig 5b). Although this may be due to imperfect target inhibition or pharmacokinetics, we cannot rule out that additional oncogenic NRAS-dependent activity(ies) might need to be inhibited to perfectly mimic direct RAS inhibition.
In conclusion, the convergence of advanced genomic technologies, maturing network modeling methodologies, and sophisticated inducible GEM models of cancers enabling perturbation of key targets in a controlled fashion, provides a framework for the systematic design and execution of preclinical studies for an emerging pharmacological agent. The faithfulness of GEM models, the relative ease of access to tumor tissues pre- and post- dosing, and their ability to produce an otherwise-unachievable “ground truth” frame of reference for the drug, together make for an ideal system to study and understand therapeutic responses and resistance, informing on a clinical path hypothesis. As in the current study, systems-level approaches enabled us to model the data in an unbiased and physiological setting to pinpoint NRASQ61K activity-dependent differences in the key phenotypic outputs of survival and proliferation. Ultimately, such analyses arrived at an unanticipated yet efficacious strategy, MEK plus CDK4 inhibition, for targeting this intractable tumor type. This is an important complement to the knowledge-based approach of designing combination strategies based on existing pathway models.
Methods
Statistical Analyses
Detailed statistical methods are supplied in the Supplementary Methods.
RNA Extraction and Expression Microarrays
Tumors were homogenized in Trizol solution. Nucleic acids were extracted using phenol:chloroform, precipitated with isopropanol, washed with 70% ethanol, and resuspended in RNAse-free water. DNA was removed using DNAse in the presence of RNAse inhibitors by incubating for 40 minutes at 37°C (Promega). Samples were processed through the RNEasy kit (Qiagen) to wash and elute the RNA. Samples were tested for purity by measuring 260/230 and 260/280 values on a Nanodrop machine (Thermo Scientific) and impure samples (<1.8 ratio) were re-purified using standard ethanol precipitation. Further quality control was performed by the Dana-Farber Cancer Center Microarray Core facility (http://chip.dfci.harvard.edu/) using the Bioanalyzer platform (Agilent). A minimum of 1 μg of RNA per sample was run on a Mouse Genome 430 2.0 Array (Affymetrix).
Western Blotting and Reverse Phase Protein Arrays
Protein was homogenized from tumors in RIPA buffer plus phosphatase and protease inhibitors (Sigma) and sonicated to shear genomic DNA. Samples were aliquoted and stored in −80°C. 100 μg of protein was run on precast 4–10% polyacrylamide gels (Invitrogen). Antibodies used were pErk, Erk, pAkt (Cell Signaling Technologies), Bim (Assay Designs), and Hsp70 (BD Bioscience). Samples in RIPA buffer were diluted to 1ug/ul and RPPA was performed by the MD Anderson RPPA Core 34.
Immunofluorescence and TUNEL Staining
Immunofluorescence was performed on 5uM formalin-fixed, paraffin-embedded sections. A pressure cooker was used for antigen retrieval in 10mM Sodium Citrate Buffer, pH 8.5 at 110°C for 10 minutes. Antibody against phosphorylated histone 3 (Cell Signaling Technologies) was diluted in 1% BSA, PBST and incubated overnight at 4°C. Biotinylated secondary antibody (Abcam) signals were amplified with streptavidin-HRP (Biogenex), fluorescence was developed using a tetramethylrhodamine Tyramide TSA-Plus kit (Perkin-Elmer), and slides were counterstained with DAPI. TUNEL staining was performed using the Apoptotag Red kit (Millipore) as per manufacturer’s instructions. Positive signals were counted on a fluorescent microscope, using DAPI and adjacent H&E sections to discriminate between tumor and non-tumor regions. All signals were counted per tumor. H&E sections were photographed on a light microscope and Adobe Photoshop was used to measure tumor area.
Cell Culture
iNRAS melanoma cell lines were isolated from primary tumors by collagenase digestion followed by culture in RPMI and 10% FBS, supplemented with 2mg/ml doxycycline (Research Products International). Eleven iNRAS cell lines were assayed for tumor development and doxycycline dependence in nude mice. iNRAS lines 413 and 475 were selected for efficient tumor formation, regression upon doxycycline withdrawal, and complete loss of transgene expression by qRT-PCR. Both cell lines were always used as low-passage (<p8) cultures, maintained in RPMI and 10% FBS, supplemented with 2mg/ml doxycycline. HMVII is a mycoplasma-free human melanoma cell line, maintained in RPMI and 10% FBS.
Animal Studies
iNras mice harbor three genetically engineered alleles: a constitutive Cdkn2a knockout 35, a novel TetO-iNRASQ61K transgene, and a Tyr-rtTA transgene 15. All mice have been backcrossed at least eight generations onto the FVB/N strain. Mice intended for tumor development are weaned onto 2mg/ml doxycycline(Research Products International) drinking water containing 5% sucrose (Sigma) at 3–4 weeks of age.
All xenograft studies use immunodeficient nude mice (Taconic). 1×10⁶ cells in HBSS (Gibco) are injected intradermally into the flank. Tumor volumes were calculated by using electronic calipers to measure the length, width, and height and using the formula (l × w × h) × π/6.
AZD6244 or GSK1120212 was dissolved in sterile 100% DMSO and diluted 1:9 in sterile-filtered 1% carboxymethyl cellulose, 0.4% Tween-80 (Sigma). PD-0332991 was dissolved directly in sterile-filtered 50mM sodium lactate, pH 4.0 (Sigma). Oral gavage was delivered using sterile flexible plastic adapters in 100 μl or 200 μl doses when tumors reached between 100 and 200 mm3 in volume. Body mass was measured using an electronic scale.
Supplementary Material
Acknowledgments
We thank G. Mills, Y. Lu, and N. Shih at the MD Anderson Reverse Phase Protein Array core facility; E. Fox at the Dana-Farber Cancer Center Microarray core facility; Shan Zhou for mouse husbandry; R. DePinho and G. Draetta and members of the laboratory, including S. Quayle, M. Chen, A. Blanchette, and J. Kamara for insightful discussions. L.N.K. is supported by the Postdoctoral Fellowship (117842-PF-09-261-01-TBG) from the American Cancer Society. J.C. is supported by the NIH Director’s Pioneer Award Program and the Howard Hughes Medical Institute. This work was supported by funding from the NIH to L.C (U01 CA141508). LC is a recipient of the Milestein Innovation Award in Melanoma Research.
Footnotes
Contributions
L.N.K. performed the majority of experiments described in the manuscript. J.C.C. performed GSEA and TRAP analyses. L.N.K. and J.C.C. jointly generated the remaining statistics. H.L. maintained nude mouse colonies and assisted in the majority of experiments. G.G. performed western blotting. S.J. maintained the iNRASGEMM colony and measured tumor volumes for primary melanomas. J.H.J. generated the iNRAS mouse. R.P.B. assisted in generating the iNRAS time course microarray data. L.N.K. and L.C. conceived the study. L.N.K., J.C.C. and L.C. wrote the paper.
Competing financial interests
The authors declare no competing financial interests.
References
- 1.Schubbert S, Shannon K, Bollag G. Hyperactive Ras in developmental disorders and cancer. Nature reviews. 2007;7:295–308. doi: 10.1038/nrc2109. [DOI] [PubMed] [Google Scholar]
- 2.Jakob JA, et al. NRAS mutation status is an independent prognostic factor in metastatic melanoma. Cancer. 2011 doi: 10.1002/cncr.26724. [DOI] [PMC free article] [PubMed] [Google Scholar]
- 3.Flaherty KT, et al. Inhibition of mutated, activated BRAF in metastatic melanoma. The New England journal of medicine. 2010;363:809–819. doi: 10.1056/NEJMoa1002011. [DOI] [PMC free article] [PubMed] [Google Scholar]
- 4.Gilmartin AG, et al. GSK1120212 (JTP-74057) is an inhibitor of MEK activity and activation with favorable pharmacokinetic properties for sustained in vivo pathway inhibition. Clin Cancer Res. 2011;17:989–1000. doi: 10.1158/1078-0432.CCR-10-2200. [DOI] [PubMed] [Google Scholar]
- 5.Bollag G, et al. Clinical efficacy of a RAF inhibitor needs broad target blockade in BRAF-mutant melanoma. Nature. 2010;467:596–599. doi: 10.1038/nature09454. [DOI] [PMC free article] [PubMed] [Google Scholar]
- 6.Kirkwood JM, et al. Phase II, open-label, randomized trial of the MEK1/2 inhibitor selumetinib as monotherapy versus temozolomide in patients with advanced melanoma. Clinical cancer research: an official journal of the American Association for Cancer Research. 2012;18:555–567. doi: 10.1158/1078-0432.CCR-11-1491. [DOI] [PMC free article] [PubMed] [Google Scholar]
- 7.Hatzivassiliou G, et al. RAF inhibitors prime wild-type RAF to activate the MAPK pathway and enhance growth. Nature. 2010;464:431–435. doi: 10.1038/nature08833. [DOI] [PubMed] [Google Scholar]
- 8.Poulikakos PI, Zhang C, Bollag G, Shokat KM, Rosen N. RAF inhibitors transactivate RAF dimers and ERK signalling in cells with wild-type BRAF. Nature. 2010;464:427–430. doi: 10.1038/nature08902. [DOI] [PMC free article] [PubMed] [Google Scholar]
- 9.Heidorn SJ, et al. Kinase-dead BRAF and oncogenic RAS cooperate to drive tumor progression through CRAF. Cell. 2010;140:209–221. doi: 10.1016/j.cell.2009.12.040. [DOI] [PMC free article] [PubMed] [Google Scholar]
- 10.Su F, et al. RAS mutations in cutaneous squamous-cell carcinomas in patients treated with BRAF inhibitors. The New England journal of medicine. 2012;366:207–215. doi: 10.1056/NEJMoa1105358. [DOI] [PMC free article] [PubMed] [Google Scholar]
- 11.Villanueva J, et al. Acquired resistance to BRAF inhibitors mediated by a RAF kinase switch in melanoma can be overcome by cotargeting MEK and IGF-1R/PI3K. Cancer cell. 2010;18:683–695. doi: 10.1016/j.ccr.2010.11.023. [DOI] [PMC free article] [PubMed] [Google Scholar]
- 12.Paraiso KH, et al. Recovery of phospho-ERK activity allows melanoma cells to escape from BRAF inhibitor therapy. British journal of cancer. 2010;102:1724–1730. doi: 10.1038/sj.bjc.6605714. [DOI] [PMC free article] [PubMed] [Google Scholar]
- 13.Morris MK, Saez-Rodriguez J, Sorger PK, Lauffenburger DA. Logic-based models for the analysis of cell signaling networks. Biochemistry. 2010;49:3216–3224. doi: 10.1021/bi902202q. [DOI] [PMC free article] [PubMed] [Google Scholar]
- 14.Sachs K, Gifford D, Jaakkola T, Sorger P, Lauffenburger DA. Bayesian network approach to cell signaling pathway modeling. Sci STKE. 2002:pe38. doi: 10.1126/stke.2002.148.pe38. [DOI] [PubMed] [Google Scholar]
- 15.Chin L, et al. Essential role for oncogenic Ras in tumour maintenance. Nature. 1999;400:468–472. doi: 10.1038/22788. [DOI] [PubMed] [Google Scholar]
- 16.Yeh TC, et al. Biological characterization of ARRY-142886 (AZD6244), a potent, highly selective mitogen-activated protein kinase kinase 1/2 inhibitor. Clin Cancer Res. 2007;13:1576–1583. doi: 10.1158/1078-0432.CCR-06-1150. [DOI] [PubMed] [Google Scholar]
- 17.Solit DB, et al. BRAF mutation predicts sensitivity to MEK inhibition. Nature. 2006;439:358–362. doi: 10.1038/nature04304. [DOI] [PMC free article] [PubMed] [Google Scholar]
- 18.Pratilas CA, et al. (V600E)BRAF is associated with disabled feedback inhibition of RAF-MEK signaling and elevated transcriptional output of the pathway. Proceedings of the National Academy of Sciences of the United States of America. 2009;106:4519–4524. doi: 10.1073/pnas.0900780106. [DOI] [PMC free article] [PubMed] [Google Scholar]
- 19.Subramanian A, et al. Gene set enrichment analysis: a knowledge-based approach for interpreting genome-wide expression profiles. Proceedings of the National Academy of Sciences of the United States of America. 2005;102:15545–15550. doi: 10.1073/pnas.0506580102. [DOI] [PMC free article] [PubMed] [Google Scholar]
- 20.Luo J, et al. A genome-wide RNAi screen identifies multiple synthetic lethal interactions with the Ras oncogene. Cell. 2009;137:835–848. doi: 10.1016/j.cell.2009.05.006. [DOI] [PMC free article] [PubMed] [Google Scholar]
- 21.VanBrocklin MW, Verhaegen M, Soengas MS, Holmen SL. Mitogen-activated protein kinase inhibition induces translocation of Bmf to promote apoptosis in melanoma. Cancer research. 2009;69:1985–1994. doi: 10.1158/0008-5472.CAN-08-3934. [DOI] [PMC free article] [PubMed] [Google Scholar]
- 22.Liberzon A, et al. Molecular signatures database (MSigDB) 3.0. Bioinformatics (Oxford, England) 2011;27:1739–1740. doi: 10.1093/bioinformatics/btr260. [DOI] [PMC free article] [PubMed] [Google Scholar]
- 23.Fry DW, et al. Specific inhibition of cyclin-dependent kinase 4/6 by PD 0332991 and associated antitumor activity in human tumor xenografts. Molecular cancer therapeutics. 2004;3:1427–1438. [PubMed] [Google Scholar]
- 24.Shapiro GI. Cyclin-dependent kinase pathways as targets for cancer treatment. J Clin Oncol. 2006;24:1770–1783. doi: 10.1200/JCO.2005.03.7689. [DOI] [PubMed] [Google Scholar]
- 25.Lens SM, Voest EE, Medema RH. Shared and separate functions of polo-like kinases and aurora kinases in cancer. Nature reviews. 2010;10:825–841. doi: 10.1038/nrc2964. [DOI] [PubMed] [Google Scholar]
- 26.Joseph EW, et al. The RAF inhibitor PLX4032 inhibits ERK signaling and tumor cell proliferation in a V600E BRAF-selective manner. Proceedings of the National Academy of Sciences of the United States of America. 2010;107:14903–14908. doi: 10.1073/pnas.1008990107. [DOI] [PMC free article] [PubMed] [Google Scholar]
- 27.Packer LM, East P, Reis-Filho JS, Marais R. Identification of direct transcriptional targets of (V600E)BRAF/MEK signalling in melanoma. Pigment Cell Melanoma Res. 2009;22:785–798. doi: 10.1111/j.1755-148X.2009.00618.x. [DOI] [PubMed] [Google Scholar]
- 28.Hoeflich KP, et al. Antitumor efficacy of the novel RAF inhibitor GDC-0879 is predicted by BRAFV600E mutational status and sustained extracellular signal-regulated kinase/mitogen-activated protein kinase pathway suppression. Cancer research. 2009;69:3042–3051. doi: 10.1158/0008-5472.CAN-08-3563. [DOI] [PubMed] [Google Scholar]
- 29.Dry JR, et al. Transcriptional pathway signatures predict MEK addiction and response to selumetinib (AZD6244) Cancer research. 2010;70:2264–2273. doi: 10.1158/0008-5472.CAN-09-1577. [DOI] [PMC free article] [PubMed] [Google Scholar]
- 30.Puyol M, et al. A synthetic lethal interaction between K-Ras oncogenes and Cdk4 unveils a therapeutic strategy for non-small cell lung carcinoma. Cancer cell. 2010;18:63–73. doi: 10.1016/j.ccr.2010.05.025. [DOI] [PubMed] [Google Scholar]
- 31.Haigis KM, et al. Differential effects of oncogenic K-Ras and N-Ras on proliferation, differentiation and tumor progression in the colon. Nat Genet. 2008;40:600–608. doi: 10.1038/ngXXXX. [DOI] [PMC free article] [PubMed] [Google Scholar]
- 32.Adjei AA, et al. Phase I pharmacokinetic and pharmacodynamic study of the oral, small-molecule mitogen-activated protein kinase kinase 1/2 inhibitor AZD6244 (ARRY-142886) in patients with advanced cancers. J Clin Oncol. 2008;26:2139–2146. doi: 10.1200/JCO.2007.14.4956. [DOI] [PMC free article] [PubMed] [Google Scholar]
- 33.Schwartz GK, et al. Phase I study of PD 0332991, a cyclin-dependent kinase inhibitor, administered in 3-week cycles (Schedule 2/1) British journal of cancer. 2011;104:1862–1868. doi: 10.1038/bjc.2011.177. [DOI] [PMC free article] [PubMed] [Google Scholar]
- 34.Paweletz CP, et al. Reverse phase protein microarrays which capture disease progression show activation of pro-survival pathways at the cancer invasion front. Oncogene. 2001;20:1981–1989. doi: 10.1038/sj.onc.1204265. [DOI] [PubMed] [Google Scholar]
- 35.Serrano M, et al. Role of the INK4a locus in tumor suppression and cell mortality. Cell. 1996;85:27–37. doi: 10.1016/s0092-8674(00)81079-x. [DOI] [PubMed] [Google Scholar]
Associated Data
This section collects any data citations, data availability statements, or supplementary materials included in this article.


