

Abstract
Experimental and imaging studies in monkeys have outlined various long association fiber pathways within the fronto-temporo-parietal region. In the present study, the trajectory of the extreme capsule (EmC) fibers has been delineated in five human subjects using DT-MRI tractography. The EmC seems to be a long association fiber pathway, which courses between the inferior frontal region and the superior temporal gyrus extending into the inferior parietal lobule. Comparison of EmC fibers with the adjacent association fiber pathway, the middle longitudinal fascicle (MdLF), in the same subjects reveals that EmC is located in a medial and rostral position relative to MdLF flanking in part the medial wall of the insula. The EmC can also be differentiated from other neighboring fiber pathways such as the external capsule, uncinate fascicle, arcuate fascicle, superior longitudinal fascicles II and III, and the inferior longitudinal fascicle. Given the location of EmC within the language zone, specifically Broca’s area in the frontal lobe, and Wernicke’s area in the temporal lobe and inferior parietal lobule, it is suggested that the extreme capsule could have a role in language function.
Keywords: Diffusion imaging, DT-MRI, Tractography, Language, Extreme capsule
Introduction
Traditionally, it has been thought that language processing is carried out by a network involving fronto-temporoparietal regions in the human cerebral cortex (Wernicke 1874; Dejerine 1901; Geschwind 1965a, b). Specifically, Broca’s area in the frontal lobe, the angular gyrus in the parietal lobe, Wernicke’s area in the temporal lobe, and their interconnections by the arcuate fascicle (AF) have been considered the principal components of the network responsible for the genesis and expression of language (Wernicke 1874; Dejerine 1901; Geschwind 1965a, b). These observations were based on clinical and pathological studies. In recent years, this notion has received further support from imaging observations derived by diffusion tensor magnetic resonance imaging (DT-MRI) (Catani et al. 2005).
Experimental observations in macaque monkeys have shown that cortical regions equivalent to human language-related areas are interconnected by another stream of connections. Specifically, it has been shown that an equivalent on architectonic grounds of Broca’s area in the frontal lobe is connected with the equivalent of Wernicke’s area in the temporal lobe via the extreme capsule (EmC) (Petrides and Pandya 2006, 2007; Schmahmann and Pandya 2006). Experimental studies have also demonstrated that the caudal inferior parietal region (angular gyrus) is connected with the equivalent on architectonic grounds of Wernicke’s area in the superior temporal gyrus (STG) via a distinct association fiber pathway, the middle longitudinal fascicle (MdLF) (Seltzer and Pandya 1984; Schmahmann and Pandya 2006). In addition, it has also been shown that the arcuate fascicle principally connects the caudodorsal part of the frontal lobe (dorsal area 8) with the temporal area caudal to the equivalent on architectonic grounds of Wernicke’s area in STG. These pathways also have been delineated in the monkey using diffusion spectrum imaging (DSI) (Schmahmann et al. 2007).
Some of the aforementioned pathways in experimental animals have been delineated in humans using DT-MRI tractography and segmentation (Makris et al. 2005, 2008). Thus, it has been shown that MdLF in humans interconnects the angular gyrus with the middle part of the superior temporal gyrus (Wernicke’s area) (Makris et al. 2008) whereas the arcuate fascicle (AF) connects the dorsolateral prefrontal cortex (areas 6, 8 and 46) preferentially with the posteriormost part of the STG (area Tpt) (Makris et al. 2005). Both, the experimental observations in animals and the DT-MRI findings in humans have indicated that the AF may not be the principal connection between Broca’s area and Wernicke’s area, as has been suggested by the classical studies. This raises the question of which specific anatomical pathways link Broca’s area and Wernicke’s area. As mentioned above, experimental studies in monkeys have shown that the equivalent on architectonic grounds of Broca’s area and the equivalent on architectonic grounds of Wernicke’s area are interconnected bidirectionally via the extreme capsule (Petrides and Pandya 2006, 2007). Therefore, to resolve this issue in humans, in the present study we delineated the extreme capsule fibers in five healthy human subjects using DT-MRI tractography, to see whether EmC has a similar trajectory and connectivity as in the monkey.
The present results show clearly that the extreme capsule is a long association fiber pathway and that its fibers can be distinguished from neighboring fiber bundles, i.e., the uncinate fascicle (UF), the external capsule (EC), the MdLF, the arcuate fascicle (AF), the superior longitudinal fascicles II and III (SLF II and III) and the inferior longitudinal fascicle (ILF). Furthermore, the EmC extends between the inferior frontal gyrus (Broca’s area) and the middle-posterior portion of the superior temporal gyrus (Wernicke’s area).
Methods
We used magnetic resonance imaging (MRI) to trace and quantify the EmC fibers and to delineate their trajectory in five normal adult right-handed human subjects (3 males and 2 females), age range 23–24 years. We applied DT-MRI-based tractography (Mori et al. 1999). For segmentation of subcortical structures (such as the claustrum and the putamen) and cortical parcellation, we used a T1-based morphometric technique (Filipek et al. 1994; Caviness et al. 1996).
MRI protocol
Magnetic resonance imaging was performed using a Siemens Trio 3 T imaging system at Massachusetts General Hospital (MGH). Scans included a T1-weighted acquisition with the following parameters: TE = 3.3 ms, TR = 2,530 ms, TI = 1,100 ms, flip angle = 7°, slice thickness = 1.33 mm, 128 contiguous sagittal slices, acquisition matrix = 256 × 256, in-plane resolution = 1 ×1 mm2 (i.e., FOV = 256 mm × 256 mm), two averages and pixel bandwidth = 200 Hz/pixel. A DT-MRI echo-planar based protocol was also acquired, and it included automatic magnetic field shimming and axial diffusion tensor imaging covering the entire brain (60 axial sections). We sampled the diffusion tensor, D, using a seven-shot echo-planar imaging (EPI) technique that samples the magnitude and orientation of the diffusion tensor. The following parameters were used: TR = 8.9 s, TE = 79 ms, average = 10, number of slices = 60 in the axial orientation, slice thickness = 2 mm, no slice spacing, FOV = 256 mm × 256 mm (i.e., data matrix = 128 × 128, in-plane resolution = 2 mm2), diffusion sensitivity b = 600 s/mm2. The total imaging time for DT-MRI was 10 min.
Tractography
Tractography allows the delineation of most parts of the trajectory of a fiber tract. Furthermore, tractography enables visualization of the relative topographic relations between fiber tracts in the cerebral cortex (Makris et al. 2005, 2008) and allows for differentiation between fiber tracts (Catani et al. 2002; Makris et al. 2005). To generate a fiber bundle using the tractographic technique, the sampling of a “seed” is required (Mori et al. 1999). Generally, this seed consists of one or more voxels.
Characterization of the seed
The seed was determined based upon a priori anatomical knowledge from the human brain (Dejerine 1895; Ariens- Kappers et al. 1936; Crosby and Schnizlein 1982; Makris et al. 1997; Makris 1999) and from experimental animal literature (Petrides and Pandya 1988; Schmahmann and Pandya 2006; Schmahmann et al. 2007). This was done through the T2-EPI principal eigenvector color-coded coronal sections in the white matter in the rostrocaudal dimension by selecting and labeling voxels pertaining to the “stem” portion of the EmC (Makris et al. 1997). To determine whether the selected voxels were part of the stem portion of the EmC, two criteria were used: (1) the topography of the voxels, and (2) the orientation of diffusion properties of the tissue. In the coronal plane, the stem of the EmC consisted of voxels with tensor information of anterior-posterior orientation within the white matter located between the claustrum and the insula (Fig. 1). The characterization of the claustrum and the insula was performed as part of a comprehensive procedure of segmentation of subcortical structures (Filipek et al. 1994) and parcellation of the cortical mantle (Rademacher et al. 1992; Caviness et al. 1996). This step added accuracy and confidence in the selection of the voxels pertaining to stems of the EmC and EC, as shown in Fig. 1. Moreover, to make more explicit, more replicable and generally accessible, the definition of the seed point used to generate each individual EmC (in 10 hemispheres) was determined in the Talairach coordinate system (Talairach and Tournoux 1988). This was performed for the group of brains by computing the Talairach coordinate of the center of mass for the seed in each coronal slice in which it was placed (Fig. 2).
Fig. 1.
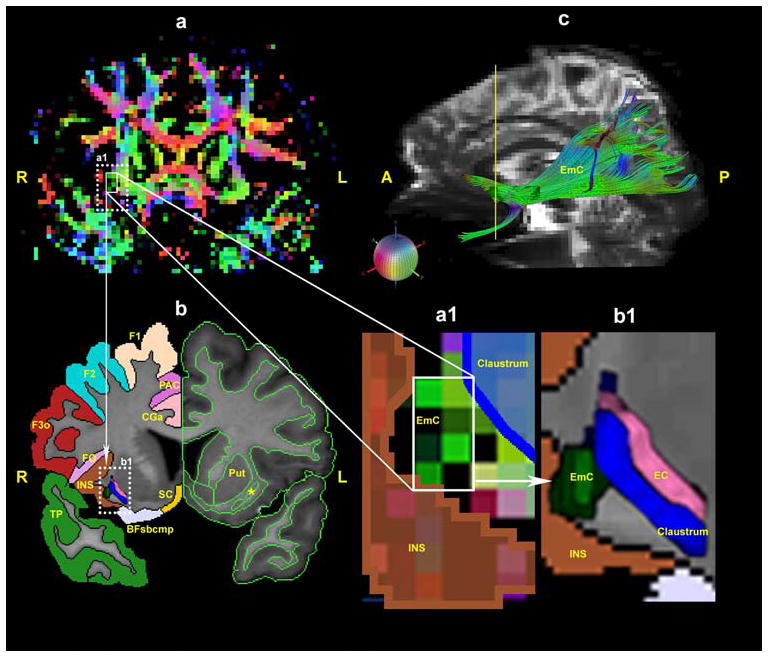
In the left upper row, a shows a representative color-coded T2-EPI coronal section composed of the principal eigenvector maps. In the left lower row, b shows a T1-weighted section corresponding to the T2-EPI section of the upper panel. Coronal sections a and b are derived at a level indicated by the yellow vertical line in a parasagittal view of the cerebral hemisphere as shown in c (upper right). In b, the segmentation of subcortical structures and of the neocortex as a whole is shown on the left hemisphere. On the right side, the parcellation of specific cortical regions has been done, and the location of the EmC, the claustrum and the EC (external capsule) are illustrated within the rectangle b1 designated within the dotted lines. [For this, the individual brain was segmented and parcellated using the Center for Morphometric Analysis neuroanatomic framework (Filipek et al. 1994; Caviness et al. 1996)]. In coronal section a the inset a1 has been magnified, as shown in the middle of the lower row, showing the EmC (green voxels) occupying a large portion of the space between the insula (shown in brown) and the claustrum (shown in dark blue). In the lower left row, b shows the topography of the EmC (extreme capsule) (shown in dark green) in an area contained within the rectangle b1. This rectangular area has been further magnified as shown in the right lower corner of the figure. In the magnified view of b1, the EmC (dark green) is located within the white matter medial to the insula (INS) (shown in brown) and lateral to the claustrum (shown in dark blue). In c, the trajectory of the EmC is shown in the rostrocaudal dimension in a lateral view of the hemisphere. The colored sphere in the middle row shows the color-coding scheme adopted in the DT-MRI data analysis. Red is right–left, green is anterior–posterior and blue is superior–inferior orientations. The yellow asterisk in b indicates the claustrum. Abbreviations: Bfsbcmp basal forebrain subcomponent, CGa cingulate gyrus, anterior; F1 superior frontal gyrus; F2 middle frontal gyrus; F3o inferior frontal gyrus, pars opercularis; FO frontal operculum; EC external capsule; EmC extreme capsule; INS insula; Put putamen; SC subcallosal cortex; TP temporal pole; L left; R right; A anterior; P posterior
Fig. 2.

Composite representations (a–d) of sagittal (a, b), axial (c) and coronal (d), planes of the seed point of the EmC (extreme capsule) in five subjects in the Talairach space. The anterior commissure (AC) corresponds to 0 mm and the posterior commissure to −24 mm. For each individual subject each EmC seed has been color-coded as shown in the insets in the middle column. Note that in a–d the orientation of the tensors are co-aligned with the slice-to-slice progression of the centers of mass
To confirm the results observed by this tractographic technique unequivocally, we also differentiated the EmC fibers from other neighboring fiber tracts. To this end we delineated the trajectory of the fiber tracts surrounding the EmC, namely the external capsule (EC), uncinate fascicle (UF), arcuate fascicle (AF), superior longitudinal fascicle II (SLF II), superior longitudinal fascicle III (SLF III), and the inferior longitudinal fascicle (ILF). We selected the seeds for these fiber pathways as follows. For the EC the seed was placed medial to the claustrum and lateral to the putamen (Fig. 1b, b1) (Makris et al. 1997; Makris 1999), whereas the seed for the UF was placed at the fronto-temporal junction and the limen insula (Makris et al. 1997; Makris 1999). The seeds for the AF, SLF I, II and III were placed based on Makris et al. (2005), whereas the seed for ILF was placed within the temporal white matter core, lateral to the temporal horn of the lateral ventricle as indicated in Dejerine (1895), (Makris et al. (1997) and Makris (1999). The tractographic parameters used to generate these fiber bundles were FA = 0.20 and angular threshold = 25°. The capability of differentiating the EmC fibers from neighboring fiber tracts adds credence to the proposal that EmC is a distinct long cortico-cortical white matter fiber pathway running within the inferior frontal gyrus and superior temporal gyrus.
Characterization of the extreme capsule
Once the seed was selected, we carried out the tractographic delineation of this fiber bundle (Fig. 1c). Tractographic analysis was performed using DTI Task Card software (MGH) (Makris et al. 2005). The algorithm used by the software is a streamlined method that grows fiber tracts by following the direction of the principal eigenvector at each step starting from a seed point (Mori et al. 1999; Lori et al. 2002). The tractographic parameters of the EmC fibers were FA = 0.20 and angular threshold = 25°.
We calculated the mean and standard deviation (SD) of anisotropy as a fractional anisotropy index (FA) for the EmC (Basser and Pierpaoli 1996; Pierpaoli and Basser 1996). We also measured the volume of the EmC by deriving the number of voxels sampled in each EmC (which is provided automatically by the DTI Task Card software) and multiplying this number by the voxel size. Furthermore, the trajectory of EmC was defined in each individual subject using DT-MRI-based tractography. Three-dimensional reconstructions were done based on the tractographic results (Fig. 3). Moreover, using the combination of DT-MRI tractography and cortical parcellation (Caviness et al. 1996), the cortical connections of the EmC fibers were estimated (Fig. 4). We also created three-dimensional reconstructions of the fiber tracts surrounding the EmC, i.e., the EC, UF, AF, SLF II, SLF III, and ILF (Fig. 5). Furthermore, we measured the seeds used to generate these fiber tracts (Table 3).
Fig. 3.
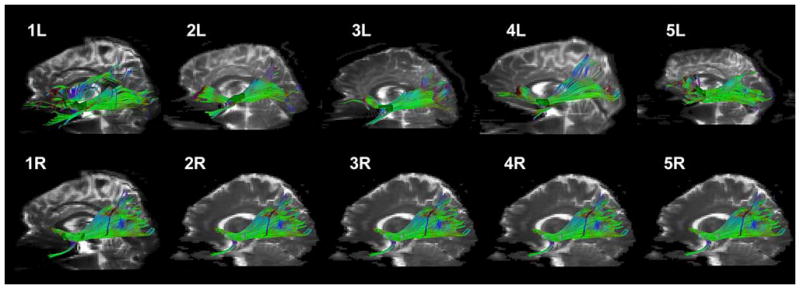
Three-dimensional renderings showing the trajectory of the EmC (extreme capsule) including the seed point, as resulted from DTMRI-based tractography in the ten hemispheres (ten hemispheres, 1L–5R) of all the subjects analyzed in the study in a lateral view. The EmC is shown in green projected on the background of a parasagittal T2-EPI section. Abbreviations: L left; R right
Fig. 4.
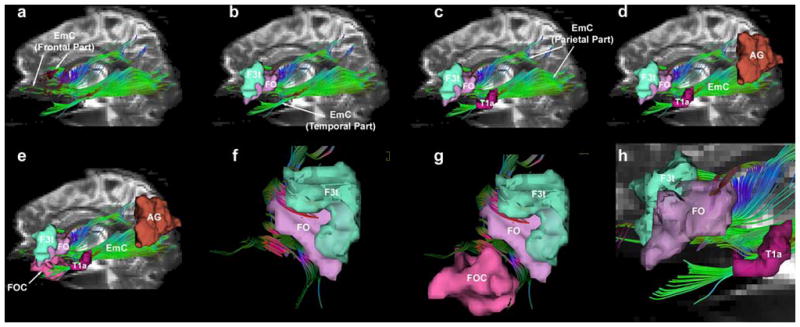
The trajectory of the EmC (extreme capsule) and the cortical regions it connects are shown on a series of illustrations of a left lateral profile (a–e) in a representative subject (1L of Fig. 3). EmC resulted from DT-MRI-based tractography and is shown in green projected on the background of a parasagittal T2-EPI section. The cortical ROIs were derived using cortical parcellation (Caviness et al. 1996). The EmC appears to have a frontal, a temporal and a parietal part (a–d). The fibers of the rostral or frontal part are shown within the cortex of the inferior frontal gyrus (F3t and FO) and the frontoorbital cortex (FOC) (b, e, f, g). The fibers of the caudal or parietal segment are shown within the inferior parietal lobule (angular gyrus, AG) (d, e). The fibers of the intermediate, lateral or temporal part are shown within the cortex of the superior temporal gyrus (T1a) (c, e, h). Abbreviations: AG angular gyrus, F3t inferior frontal gyrus, pars triangularis, FO frontal operculum, FOC frontoorbital cortex, T1a superior temporal gyrus, anterior, L left, R right
Fig. 5.
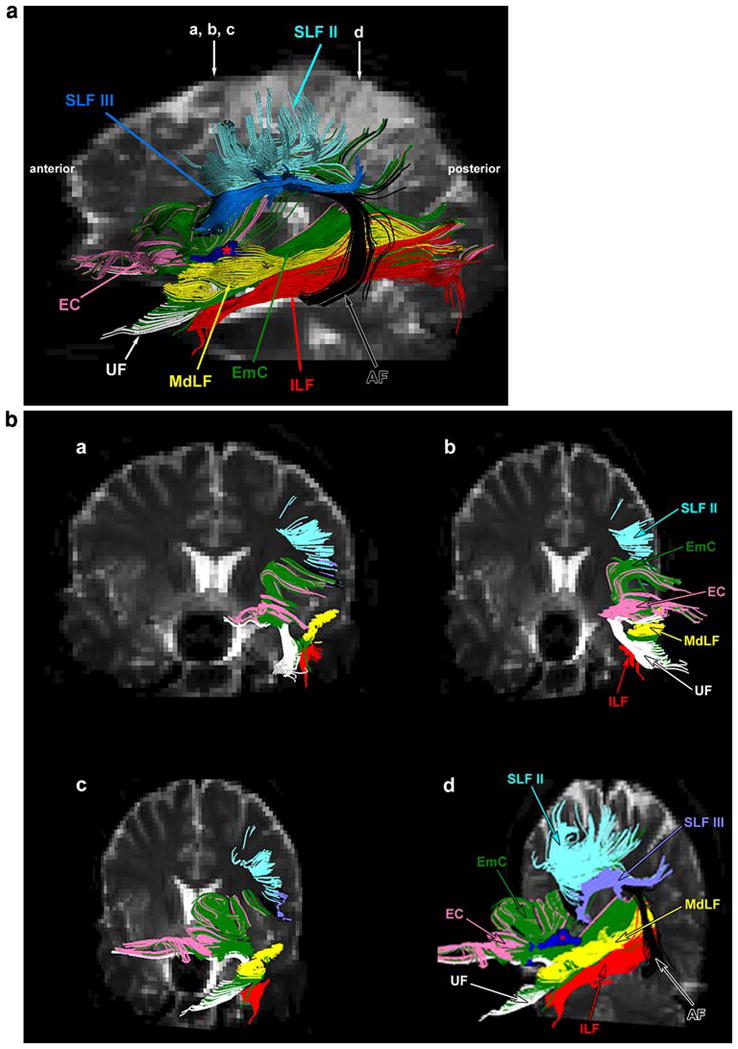
a Composite topographic comparison of trajectories of EmC shown in green and a set of other fiber bundles on a T2-EPI left lateral profile using DT-MRI tractography. Using DT-MRI tractography, we were able to differentiate the EmC from other neighboring fiber pathways, i.e., the MdLF, EC, UF, AF, SLF II, SLF III, and the ILF. EmC (shown in green) is located laterally to EC (shown in pink). These two fiber pathways are separated by the claustrum, which is colored in dark blue and marked by a red asterisk. The claustrum was derived using the segmentation method (Filipek et al. 1994). The UF (shown in white) remains ventral to the EmC, whereas the AF (shown in black), SLF II (shown in turquoise) and SLF III (shown in blue) are located in a dorsal and lateral position with respect to the EmC. The ILF (shown in red) is situated in a ventral location in relation to the EmC. b Four coronal sections (a–d) taken at two locations in the rostrocaudal dimension as indicated by arrows in a. The rostral arrow in a indicates the level of coronal sections a, b and c of b, whereas the caudal arrow in a indicates coronal d in b. The first three coronal sections, i.e., a, b and c, are the same coronal image shown at three different angles in order to visualize the different perspective of the individual fiber pathways. Abbreviations: AF arcuate fascicle; EC external capsule; EmC exreme capsule; ILF inferior longitudinal fascicle; SLF II and III superior longitudinal fascicles II and III; UF uncinate fascicle
Table 3.
Description of the volumetry of the seeds of AF, EC, ILF, MdLF, SLF II, SLF III and UF
| Measure | Number of coronal slices | Number of voxels | Volume (cm^3) | |||||
|---|---|---|---|---|---|---|---|---|
|
| ||||||||
| Side | Group mean | Group SD | Group mean | Group SD | Group mean | Group SD | ||
| Seed | AF | R | 1.6 | 0.9 | 6.2 | 3.3 | 0.05 | 0.03 |
| L | 1 | 0 | 11 | 2.6 | 0.09 | 0.02 | ||
| EC | R | 7.2 | 3.6 | 27.6 | 11.2 | 0.22 | 0.09 | |
| L | 3.6 | 2.2 | 12 | 6.2 | 0.10 | 0.05 | ||
| ILF | R | 1.2 | 0.5 | 11.4 | 5.9 | 0.09 | 0.05 | |
| L | 1.2 | 0.5 | 9.4 | 4.6 | 0.08 | 0.04 | ||
| MdLF | R | 2 | 1 | 20.4 | 12.8 | 0.16 | 0.10 | |
| L | 3 | 1 | 31.4 | 13.8 | 0.25 | 0.11 | ||
| SLF II | R | 1.2 | 0.4 | 22.2 | 6.1 | 0.18 | 0.05 | |
| L | 1.8 | 1.3 | 27 | 13.7 | 0.22 | 0.11 | ||
| SLF III | R | 1.4 | 0.9 | 9.4 | 7.7 | 0.08 | 0.06 | |
| L | 1 | 0 | 10.6 | 4.6 | 0.08 | 0.04 | ||
| UF | R | 1.4 | 0.6 | 9.6 | 6 | 0.08 | 0.05 | |
| L | 1.2 | 0.4 | 9.6 | 2.9 | 0.08 | 0.02 | ||
R right hemisphere, L left hemisphere, SD standard deviation, AF arcuate fascicle, EC external capsule, ILF inferior longitudinal fascicle, MdLF middle longitudinal fascicle, SLF II superior longitudinal fascicle II, SLF III superior longitudinal fascicle III, UF uncinate fascicle
Results
We delineated the EmC by carrying out fractional anisotropy (FA) and volume measurements and tracing its trajectory in five normal adult subjects using tractography (Table 1; Fig. 3). We then mapped the seeds used to generate the EmC in the Talairach coordinate space (Fig. 2; Table 2) and followed the tractographic renderings into the cortical origin and termination of EmC fibers using segmentation and cortical parcellation results (Fig. 4). Finally, we differentiated the EmC from adjacent fiber tracts such as the EC, UF, AF, SLF II and SLF III, and ILF (Fig. 5).
Table 1.
Description of the FA index, volumetry, and symmetry of the extreme capsule (EmC)
| Measure | Side | Subject 1 | Subject 2 | Subject 3 | Subject 4 | Subject 5 | Group mean | Group SD | Symmetry* | |
|---|---|---|---|---|---|---|---|---|---|---|
| Seed | Number of coronal slices | L | 10 | 8 | 13 | 14 | 7 | 10.4 | 3.0 | |
| R | 19 | 11 | 12 | 13 | 9 | 12.8 | 3.8 | |||
| Ave | 14.5 | 9.5 | 12.5 | 13.5 | 8 | 11.6 | 2.7 | |||
| Number of voxels | L | 47 | 30 | 50 | 90 | 71 | 57.6 | 23.2 | ||
| R | 78 | 59 | 46 | 51 | 40 | 54.8 | 14.7 | |||
| L+R | 125 | 89 | 96 | 141 | 111 | 112.4 | 21.2 | |||
| Volume (cm^3) | L | 0.38 | 0.24 | 0.4 | 0.72 | 0.57 | 0.46 | 0.19 | ||
| R | 0.62 | 0.47 | 0.37 | 0.41 | 0.32 | 0.44 | 0.12 | |||
| L+R | 1 | 0.71 | 0.77 | 1.13 | 0.89 | 0.9 | 0.17 | |||
| Fiber tract (including stem) | FA | L | 0.49 | 0.49 | 0.46 | 0.47 | 0.5 | 0.48 | 0.01 | 0.07 |
| R | 0.43 | 0.44 | 0.44 | 0.45 | 0.48 | 0.45 | 0.02 | |||
| Ave | 0.46 | 0.46 | 0.45 | 0.46 | 0.49 | 0.46 | 0.01 | |||
| Number of coronal slices | L | 81 | 74 | 74 | 79 | 77 | 77 | 3.1 | ||
| R | 63 | 79 | 76 | 63 | 67 | 69.6 | 7.5 | |||
| Ave | 72 | 76.5 | 75 | 71 | 72 | 73.3 | 2.3 | |||
| Number of voxels | L | 1,827 | 1,806 | 1,991 | 1,373 | 2,958 | 1,991 | 587 | −0.04 | |
| R | 1,902 | 2,719 | 1,844 | 1,897 | 1,804 | 2,033 | 385 | |||
| L+R | 3,729 | 4,525 | 3,835 | 3,270 | 4,762 | 4,024 | 610 | |||
| Volume (cm^3) | L | 14.6 | 14.4 | 15.9 | 11 | 23.7 | 15.9 | 4.7 | −0.04 | |
| R | 15.2 | 21.8 | 14.8 | 15.2 | 14.4 | 16.3 | 3.1 | |||
| L+R | 29.8 | 36.2 | 30.7 | 26.2 | 38.1 | 32.2 | 4.9 |
SD standard deviation; L left hemisphere; R right hemisphere; Ave = (L + R) × 1/2
Symmetry coefficient = (L − R)/[1/2 × (L + R)]. Positive value indicates leftward asymmetry
Table 2.
Talaraich coordinates of the extreme capsule (EmC) seed region of int
| Subject | Side | Center of mass
|
||
|---|---|---|---|---|
| X | Y | Z | ||
| Subject 1 | L | −32.22 | −6.13 | −5.65 |
| R | 35.42 | −11.69 | −1.86 | |
| Subject 2 | L | −34.72 | −2.08 | −6.47 |
| R | 34.92 | −2.61 | −5.38 | |
| Subject 3 | L | −33.66 | −15.55 | −3.34 |
| R | 36.14 | −16.14 | −1.54 | |
| Subject 4 | L | −33.81 | −4.59 | −3.78 |
| R | 33.56 | −1.65 | −3.70 | |
| Subject 5 | L | −36.13 | −6.19 | −5.76 |
| R | 34.51 | −1.71 | −4.08 | |
| Average | L | −34.11 | −6.91 | −5.00 |
| R | 34.91 | −6.76 | −3.31 | |
L left hemisphere, R right hemisphere
Tractographic observations
We used the DT-MRI tractographic technique to outline the location and course of the EmC and to elucidate its trajectory. The seed points of the EmC have been mapped in the Talairach coordinate space as shown in the sagittal, axial and coronal planes in Fig. 2. Based on these seed points we generated the extent of the EmC in the rostrocaudal dimension in a parasagittal plane in the 10 hemispheres (right and left in five subjects) as shown in Fig. 3 in green. Except for minor variation, the basic course of the EmC in all ten hemispheres appears to be equivalent. In general, the EmC fibers seem to extend from the inferior frontal gyrus to the superior temporal gyrus and reaching to the inferior parietal lobule. In Fig. 4, the trajectory of the EmC fibers and their connecting cortical regions are shown in a series of illustrations (Fig. 4a–h). The EmC appears to have three parts, namely a frontal, a temporal and a parietal part (Fig. 4a–c). As shown in Fig. 4a, b, the rostral or frontal, part of the EmC is located within the inferior frontal gyrus [inferior frontal gyrus, pars triangularis (F3t) and frontal operculum (FO)]. In Fig. 4f, the Broca’s area (i.e., F3t and FO) is highlighted to show the extension of the EmC fibers into these cortical regions. It should be pointed out that the location and definition of these cortical areas is derived by using the Center for Morphometric Analysis cortical parcellation method (Caviness et al. 1996). In Fig. 4e, g, the relations of the EmC with the orbital frontal region are highlighted. In Fig. 4c, the temporal part of the EmC is highlighted as its fibers course within the anterior-middle part of the STG (T1a in red). Figure 4h highlights further the relationship of EmC fibers with the T1a area of the superior temporal gyrus. Figure 4d shows the caudal, or parietal, part of the EmC within the inferior parietal lobule (angular gyrus or AG in light brown). Figure 4e shows the overall trajectory of the EmC in relationship to its connections with Broca’s area (F3t and FO), Wernicke’s area (T1a and middle superior temporal gyrus) and the angular gyrus. We also used tractography to differentiate the EmC from other neighboring long fiber tracts (Figs. 5, 6, 7). For instance, the SLF II (shown in turquoise) and SLF III (shown in blue) occupy a position dorsal to the EmC (green) as shown in Fig. 5. Likewise, EmC has also been differentiated from AF (shown in black), which courses in a dorsal, lateral and ventral location. Whereas SLF II and SLF III course primarily above the EmC and extend from the lateral prefrontal cortex to the parietal lobe, the fibers of the AF course from the dorsal lateral prefrontal cortex arching around the insula and reach the caudal part of the superior and middle temporal gyrus. Additionally, the EmC has been distinguished from MdLF (shown in yellow, Fig. 6).
Fig. 6.
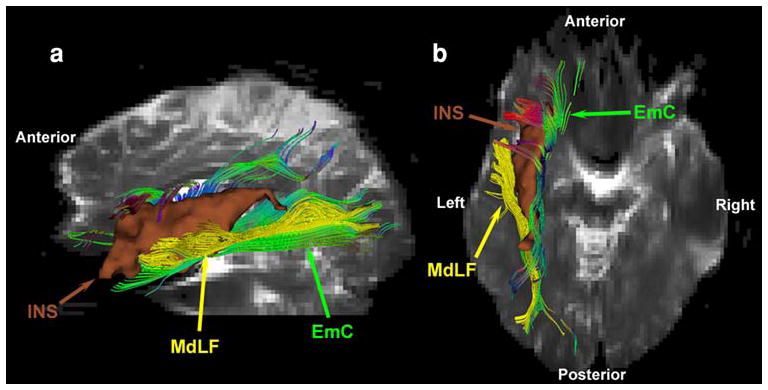
Comparative topographic anatomy of the extreme capsule (EmC), and the middle longitudinal fascicle (MdLF) (Makris et al. 2008) based on tractographic results of an exemplar EmC case (1L of Fig. 3) in three-dimensions. EmC fibers course caudally towards the inferior parietal lobule flanking the MdLF. Although these fiber tracts travel side by side within the caudal part of the superior temporal gyrus and the inferior parietal lobule white matter, they are well differentiated from one another as shown in b. Caudally, the fibers of EmC are located medially to the fibers of MdLF and more rostrally, the EmC fibers flank the medial wall of the insula (INS) to enter in the frontal lobe as shown in b. Another group of fibers of EmC run within the superior temporal gyrus ventral to the MdLF fibers as shown in a. Rostrally, the MdLF fibers course within the superior temporal gyrus heading to the temporal pole as shown in a and b
Fig. 7.
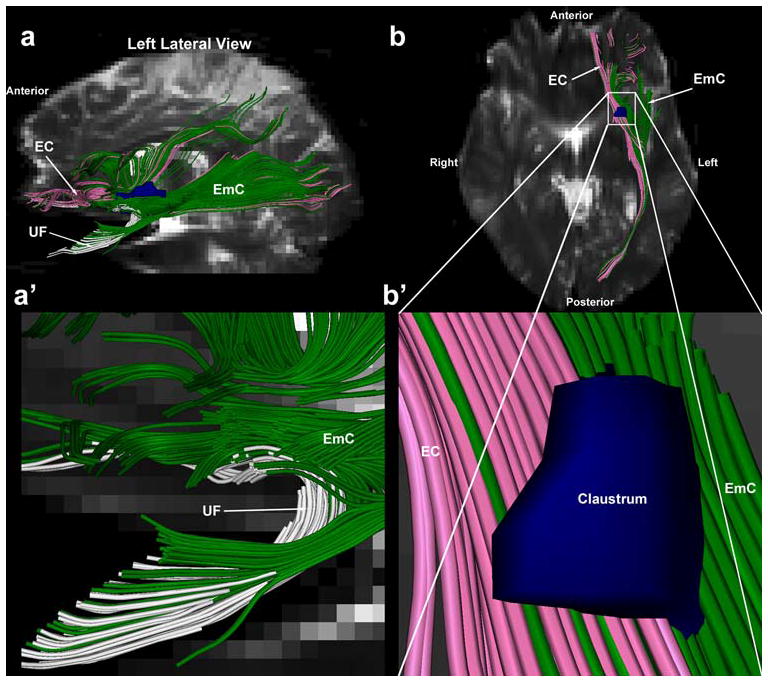
Comparative topography of the trajectories of the extreme capsule (EmC) (shown in green), the external capsule (EC) (shown in pink) and the uncinate fascicle (UF) (shown in white) based on tractographic results of an exemplar EmC case (1L of Fig. 3) in three-dimensions. The UF remains ventral to the EmC as shown in a and a′. Furthermore, as shown in an inferior axial view b, the EmC courses laterally to the EC. Furthermore, whereas the EmC is located laterally to the claustrum (shown in dark blue), the EC occupies a medial position to the claustrum as shown magnified in b′. The claustrum was derived using the segmentation method (Filipek et al. 1994). Abbreviations: AF arcuate fascicle; EC external capsule; EmC exreme capsule; UF uncinate fascicle
Although these two pathways run parallel to each other in the white matter of the superior temporal gyrus, they can be differentiated by their location and extent. Whereas the MdLF extends between the temporal pole and angular gyrus, the EmC is medially located and extends from the inferior and ventral prefrontal and superior temporal gyrus to the inferior parietal lobule. The EmC can be also differentiated from the ILF (shown in red), which courses from the temporal pole to the occipital lobe in the rostrocaudal dimension remaining ventral and lateral to the EmC and MdLF. Furthermore, as shown in Fig. 7, the EmC can be differentiated from the UF (shown in white). The UF is located in the temporopolar area and extends to the ventral prefrontal cortex (Fig. 7a, a′). It is located in a position medial to the EmC. Finally, the EmC can been differentiated from the EC (shown in pink) as shown in Fig. 7b, b′. The EC is located medial to the EmC as these two fiber tracts flank the claustrum (shown in blue and marked by an asterisk in Fig. 5) on its medial and lateral side, respectively, as shown in Fig. 7b, b′.
Quantitative analyses of the EmC
We derived measurements of the average fractional anisotropy (FA) values as well as the symmetry coefficient of FA and the volume for the EmC in five normal subjects (ten hemispheres), which are shown in detail in Table 1 for each individual subject as well as for the group. The group mean left/right value for the FA was 0.48/0.45, the total group mean value was 0.46 and the average symmetry of the FA is more leftward (7.3%). The FA measures may reflect biological properties of a fiber tract such as axonal density and orientation coherence as well as myelination (Beaulieu 2002). Reduced FA values have been reported in studies of stroke lesions, probably denoting axonal degeneration and gliosis (Werring et al. 2000; Pierpaoli et al. 2001), whereas increased FA values have been associated with the white matter around the stroke lesion where white matter reorganization occurs (Jiang et al. 2006; Ding et al. 2008). The group mean left/right volume of the EmC was 15.93/16.27 cm3 and the average symmetry is more rightward (4%). The seeds used to generate the EmC were on average 2.8% the size of the EmC.
Discussion
Previous experimental studies in the monkey using the Marchi method have outlined the trajectory of the extreme capsule (EmC) (Berke 1960; Krieg 1963). According to these studies, EmC is an association fiber tract that contains fibers stemming from the frontal, insular, temporal and parietal cortices. Using anterograde isotope tracers in the macaque monkey, it has been shown that EmC is a long association fiber pathway, which courses between the middle superior temporal gyrus and the ventral prefrontal cortex including the caudal orbitofrontal cortex (Petrides and Pandya 1988; Schmahmann and Pandya 2006). A significant portion of the EmC is located between the claustrum and the insula. Furthermore, the EmC has been delineated using diffusion imaging in a study comparing the results of isotope injections in monkeys with those of the diffusion spectrum imaging (DSI) technique (Schmahmann et al. 2007). Experimental studies also have shown that the EmC carries fibers connecting the middle and rostral parts of the superior temporal gyrus (areas paAlt, TAa, TS3) and the adjacent part of the cortex of the superior temporal sulcus (TPO), the medial part of the planum temporale, the rostral part of the insula, the rostral cingulate gyrus (areas 24/32), the caudal part of the ventrolateral prefrontal cortex (ventral area 9/46), the frontopolar cortex (area 10) and the caudal part of the orbitofrontal cortex and area 45 (Petrides and Pandya 1988; Schmahmann and Pandya 2006). It seems that the major portion of EmC fibers connects the middle portion of the superior temporal region (equivalent on architectonic grounds of human Wernicke’s area), with the prefrontal area 45 (equivalent on architectonic grounds of human Broca’s area). Thus, the EmC may be considered an important pathway for what Mesulam (1998) has called the language communication epicenter (Mesulam 1998; Schmahmann and Pandya 2006).
The course of the extreme capsule fibers in humans and its putative functional role remain uncertain. Dejerine (1895) reported that the extreme capsule contains association fibers as well as a set of fibers from the external capsule. According to Crosby and colleagues, the extreme capsule is a major association fascicle that “carries many association fibers between frontal and temporal, and parietal and temporal cortices and between these areas and the insular cortex” (Ariens-Kappers et al. 1936; Crosby and Schnizlein 1982, p. 614).
In the present study using DT-MRI in five human brains in vivo (ten hemispheres), we have discerned the extreme capsule (EmC) as a long association fiber pathway located between the insula and the claustrum and coursing between the middle part of the superior temporal region and the inferior frontal and orbitofrontal gyri (Fig. 3). It continues caudally toward the inferior parietal lobule flanking another fiber pathway within the white matter of the superior temporal gyrus, namely the MdLF (Makris et al. 2008) (Fig. 6). These MdLF fibers have been shown to connect the inferior parietal lobule (BA 39) with the rostral and middle parts of the superior temporal region (Wernicke’s area). Although the EmC and MdLF travel side by side within the caudal part of the superior temporal gyrus and the inferior parietal lobule white matter, these two fiber tracts are well differentiated from one another (Fig. 6). Caudally, the fibers of EmC are located medial to the fibers of MdLF. At the level of the posterior insula, the EmC fibers flank the medial wall of the insula to enter in the frontal lobe (Fig. 6). In contrast, the MdLF fibers remain within the superior temporal gyrus heading to the temporal pole (Fig. 6). We also were able to differentiate the EmC from other neighboring fiber pathways, i.e., the EC, UF, AF, SLF II, SLF III, and the ILF (Fig. 5). In particular, as shown in Fig. 7b and b′, whereas the EmC is located lateral to the claustrum, the EC occupies a position medial to the claustrum. The UF remains ventral to the EmC (Fig. 7a, a′), whereas the AF, SLF II and SLF III are located in a dorsal and lateral position with respect to the EmC (Fig. 5). The ILF is situated in a location ventral to the EmC (Fig. 5).
It seems that the EmC is a long association fiber pathway, which carries fibers connecting the middle part of the superior temporal gyrus (Wernicke’s area) with the inferior frontal region (Broca’s area) and thus could be related to language processing (Schmahmann and Pandya 2006; Petrides and Pandya 2008). This proposal seems to challenge traditional thinking about the pathways involved in language circuitry.
Rethinking of language circuitry
The arcuate fascicle was proposed by Wernicke to be the principal fiber pathway related to language function by virtue of interlinking Broca’s area and Wernicke’s area (Wernicke 1874). This postulate has remained the mainstay for understanding the genesis of language and for interpreting various aphasic disorders. In his classical work, Geschwind re-emphasized Wernicke’s notion regarding the role of the arcuate fascicle in language function (Geschwind 1965a, b). Geschwind also suggested the importance of the inferior parietal lobule (the angular gyrus in particular) for the elucidation of language disorders. In recent years, Catani et al. have detailed and further modified the trajectory of the fronto-parieto-temporal fiber pathway, specifically the arcuate fascicle using DT-MRI tractography (Catani et al. 2005). These authors agree in principle with the Wernicke–Geschwind schema. Based on their observations, they subdivided the fibers of the arcuate fascicle into three main subdivisions: a long segment connecting Broca’s territory in the frontal lobe with Wernicke’s territory in the temporal lobe; an anterior segment linking Broca’s area with the Geschwind’s territory (angular gyrus) in the parietal lobe; and a posterior segment connecting the angular gyrus with Wernicke’s area (see Catani et al. 2005, Fig. 3). In another DT-MRI study, the trajectory of the superior longitudinal fascicle-arcuate fascicle fiber system was further elaborated (Makris et al. 2005). According to this study, the superior longitudinal fascicle-arcuate fascicle pathway can be divided into four subcomponents. The dorsal fronto-parietal fibers are termed SLF I, the middle fronto-parietal fibers as SLF II, and the ventrorostral fibers as SLF III. A distinct frontotemporal fiber pathway was shown, which arched around the caudal portion of the insula and was termed as the arcuate fascicle (AF). By comparing these DT-MRI observations in humans with those of experimental studies in the monkey, it was suggested that the AF connects the caudal-dorsal prefrontal areas (areas 8 and 46) with the caudal part of the superior temporal gyrus (area Tpt) (Petrides and Pandya 1984; Makris et al. 2005). Experimental observations in monkeys (Leinonen et al. 1980; Benson et al. 1981; Petrides and Pandya 1988; Rauschecker 1995; Hackett et al. 1999, 2001; Kaas and Hackett 1999, 2000; Romanski et al. 1999a,b; Morosan et al. 2001; Schmahmann and Pandya 2006), clinical observations (Clarke et al. 2002; Clarke and Thiran 2004), and structural and functional imaging studies in humans (Martinkauppi et al. 2000; Rauschecker and Tian 2000) have suggested that whereas the caudal part of the superior temporal gyrus (area Tpt) is involved in the location of sound in space, the more rostral part of the superior temporal gyrus (areas PaAlt, TS3 and TS2) is involved in sound recognition (Schmahmann and Pandya 2006; Fullerton and Pandya 2007). Based on these notions as well as electrophysiological studies in humans (Ojemann et al. 1989, 2005), it has been thought that Wernicke’s area is located principally in the mid-portion of the superior temporal gyrus (STG) in humans rather than in the caudal part of STG. Thus, whether the arcuate fascicle fibers connect Broca’s area with Wernicke’s area in humans remains an open question. Unlike humans, in monkeys it has been shown that these fronto-temporal connections are conveyed by the extreme capsule bidirectionally (Berke 1960; Krieg 1963; Petrides and Pandya 1988, 2006).
This brings us to the question of the role of the EmC in language function. Catani et al. have suggested that connections between the angular gyrus (“Geshwind’s territory”) and the superior temporal gyrus (“Wernicke’s territory”) are conveyed by the posterior segment of the arcuate fascicle (Catani et al. 2005). They related this segment of the arcuate fascicle with language function as hypothesized by Geschwind (1965a and b). Alternatively, based on our recent observations, the angular gyrus is connected with the mid-portion of the superior temporal gyrus (Wernicke’s area) independently of the arcuate fascicle by a fiber pathway termed the MdLF (Makris et al. 2008). The MdLF is a distinct fiber bundle in humans rather than part of the SLF II-arcuate fascicle system. As mentioned above, experimental studies in monkeys have shown that the arcuate fascicle fibers connect the dorsocaudal prefrontal cortex with the caudal part of the superior temporal gyrus (area Tpt). Both of these areas have been shown to play a role in the localization of sound in space (Leinonen et al. 1980; Azuma and Suzuki 1984; Vaadia et al. 1986; Rauschecker 1995; Romanski et al. 1999b; Schmahmann and Pandya 2006). In contrast, the inferior prefrontal cortex, including area 45 in monkeys, appears to be connected via the extreme capsule with the mid-portion of the superior temporal gyrus and the cortex of the superior temporal sulcus (equivalent on architectonic grounds of human Wernicke’s area) (Petrides and Pandya 2006; Schmahmann and Pandya 2006; Schmahmann et al. 2007). Thus, whereas the arcuate fascicle may be involved preferentially in processing the location of sound in space, the EmC and MdLF may have a significant role in language.
Since the SLF-AF fiber systems are quite distinct from EmC and MdLF both in humans and monkeys, we would like to offer an alternative hypothesis for the language structures and fiber pathways. This is based on inferences from experimental observations in non-human primates. It has been shown in the monkey that area 45 (equivalent to pars triangularis in humans) is connected with the mid-part of the superior temporal gyrus (STG) and the cortex of the superior temporal sulcus (sts) via the extreme capsule bidirectionally (Petrides and Pandya 1988, 2006, 2008). These areas (STG and sts) are involved, respectively, in modality-specific auditory information (STG) and multimodal (sts) processing. The superior temporal gyrus and the cortex of the superior temporal sulcus, in turn, have been shown to be connected via the MdLF with parietal lobe area PG-Opt in monkeys (equivalent to angular gyrus in humans). Therefore, in the monkey a fronto-parietotemporal circuitry has been shown to be composed of three cortical centers (i.e., prefrontal area 45, mid-superior temporal region, and caudal-inferior parietal lobule), which are interconnected via two principal long association fiber pathways, i.e., the extreme capsule (fronto-temporal connection) and the MdLF (parieto-temporal connection). Thus it seems reasonable to propose language-related links in the human brain organized as follows: caudal inferior frontal gyrus (Broca’s area)<->extreme capsule<->STR (superior temporal region, i.e., STG and sts; Wernicke’s area) and angular gyrus<->MdLF<->STR (superior temporal region, i.e., STG and sts; Wernicke’s area). These interconnections may be involved in language expression (temporo-frontal connections or Wernicke’s area–Broca’s area connections via EmC) and language comprehension (temporo-parietal connections via MdLF). This proposed connectivity is supported by the observations using tractography in the present study as shown in Fig. 8a–d.
Fig. 8.
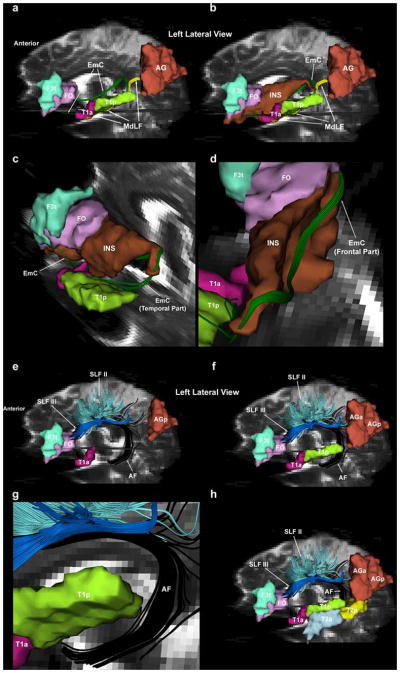
A fronto-parieto-temporal circuitry composed of three cortical centers (i.e., prefrontal area 45, mid-superior temporal region, and caudal-inferior parietal lobule), which are connected as a loop via two principal long association fiber pathways, i.e., the extreme capsule (EmC) (fronto-temporal connection) and the middle longitudinal fascicle (MdLF) (parieto-temporal connection) is shown in this figure. The link provided by the EmC (shown in green) is shown in panels a, b, c and d: caudal inferior frontal gyrus (F3t/FO: Broca’s area)<-> extreme capsule<->STR (superior temporal region, i.e., STG and sts; T1a/T1p: Wernicke’s area). The EmC fibers connecting the caudal inferior frontal gyrus and the superior temporal region form a loop around the insula as shown in c and d. The medial aspect of this loop of fibers (frontal segment of EmC) flanks the medial wall of the insula from the caudal inferior frontal region to the STR (d), whereas the lateral part of the loop of EmC fibers (temporal segment of EmC) enters the superior temporal gyrus at the caudal end of the insula and courses below and laterally to the inferior circular sulcus of the insula throughout the STR (c). The EmC fibers exit the superior temporal white matter at the limen insula to connect with the caudal inferior frontal region (a, c). The link provided by the MdLF (shown in yellow) is shown in a and b: angular gyrus<->middle longitudinal fascicle<->STR (superior temporal region, i.e., STG and sts; T1a/T1p: Wernicke’s area). The MdLF courses from the inferior parietal lobule (AG) within the white matter of the entire superior temporal gyrus to the temporal pole (Makris et al. 2008) (a, b). The frontoparieto-temporal circuitry shown here may be an alternative or complimentary to the traditional Wernicke-Geschwind schema of language, in which the principal connections are provided by the arcuate fascicle (AF) (see “Discussion” for details). The topographic relations between the caudal inferior frontal gyrus (F3t/FO: Broca’s area), STR (superior temporal region, i.e., STG and sts; T1a/T1p: Wernicke’s area), the AG and the AF-SLF II and III are shown in e–h. As shown in (g), the AF fibers arch around the caudal part of the posterior end of the superior temporal gyrus and enter in the middle temporal gyrus (T2a and T2p) (f, g, h). It has to be noted that panel g represents an oblique view, which shows in further detail the relative topography of the AF and the superior temporal gyrus (T1a/T1p). Abbreviations: AF arcuate fascicle, AG angular gyrus, AGa angular gyrus, anterior, AGp angular gyrus, posterior, F3t inferior frontal gyrus, pars triangularis, FO frontal operculum, FOC frontoorbital cortex, T1a superior temporal gyrus, anterior, T1p superior temporal gyrus, posterior, T2a middle temporal gyrus, anterior, T2p middle temporal gyrus, posterior, R right, L left
We would like to point out that the above notion is based on connectional observations in monkeys and the demonstration of EmC and MdLF in humans by DT-MRI and is, therefore, inferential and hypothetical. We realize that the present proposal regarding language circuitry should be tested further functionally and clinically to evaluate its validity. Moreover, given the functional and structural differences between monkeys and humans, there may be connectional differences as well. Thus, in humans, instead of EmC and MdLF being the principal language-related pathways as we are proposing herein, it may be that the arcuate fascicle is the principal connection of the language circuitry as has been accepted in traditional thinking on language organization. Another possibility could be that EmC and MdLF, as well as AF, contribute to language function.
A recent comparative study by Rilling et al. (2008) has shown that AF connects frontal cortical areas with the middle and inferior temporal gyri (i.e., areas situated to a ventral and anterior location in relation to the cortex usually considered on architectonic grounds as Wernicke’s area) and they have suggested that in humans, new connections have been possibly established between these temporal regions and Broca’s area, linking regions that are involved in lexical-semantic and syntactic processing. Furthermore, while the present paper was under review, two important studies have been published (Saur et al. 2008; Frey et al. 2008). The result of the study by Saur et al. (2008) using functional MRI indicated that EmC plays a significant role in language function. The data suggest that whereas the AF and SLF II play a role in sensory-motor functions in language, the EmC is involved in higher level language comprehension. These observations support the present findings and conclusions.
Quantitative analysis
We performed measurements of biophysical parameters for fractional anisotropy (FA) and of FA symmetry for the EmC. FA ranged from 0.45 to 0.49 on the left and from 0.43 to 0.45 on the right (Table 1). The FA values for EmC cannot be compared with other studies because these are not available in humans or in monkeys. The FA values, however, were similar to the FA reported in other studies of different fiber tracts in the normal human brain. Pierpaoli and Basser reported FA values of 0.46 in subcortical white matter (Pierpaoli and Basser 1996). Klingberg et al. showed mean unscaled FA values in temporoparietal white matter that ranged from 0.38 to 0.59 (Klingberg et al. 2000). In previous studies of the cingulum bundle (Makris et al. 2002), the superior longitudinal fascicle (Makris et al. 2005), the occipitofrontal fascicle (OFF) (Makris et al. 2007) and the MdLF (Makris et al. 2008) we have shown that FA values of the CB ranged from 0.45 to 0.54 (Makris et al. 2002), the overall FA for the SLF (all four subcomponents combined) was 0.44 (Makris et al. 2005), the FA for the OFF was 0.37 (Makris et al. 2007) and the FA for the MdLF was 0.34 (Makris et al. 2008). Thus, our results of FA for the EmC appear to be in general agreement with data on other fiber pathways in the human brain. The EmC also showed 7.33% FA leftward asymmetry. The overall volume of the EmC was approximately 16 cm3 in both sides of the cerebrum. This suggests that the EmC is a large association corticocortical fiber pathway comparable in size to the SLF II (Makris et al. 2005). The EmC also showed 4% volumetric rightward asymmetry. Given the small number of subjects in this report, however, we are unable to further interpret these FA and volumetric observations, which should be considered preliminary.
Conclusion
In the present study we delineated the trajectory of the extreme capsule and inferred its connections using DT-MRI tractography in humans in vivo. The extreme capsule is a long association fiber pathway, which seems to extend from the inferior frontal gyrus to the superior temporal gyrus and the inferior parietal lobule. We also differentiated the extreme capsule from other neighboring fiber pathways such as the external capsule, MdLF, uncinate fascicle, arcuate fascicle, superior longitudinal fascicles II and III, and the inferior longitudinal fascicle. Its central location within the language zone, linking the inferior frontal gyrus (Broca’s area), the middle part of the superior temporal gyrus (Wernicke’s area) and the inferior parietal lobule (angular gyrus), suggests that the extreme capsule may have a prominent role in language function. This study demonstrates a putatively alternative pathway for language circuitry, specifically involving the extreme capsule and the MdLF.
Acknowledgments
Preparation of this article was supported in part by grants from: the National Institutes of Health National Center for Complementary and Alternative Medicine (NCCAM) to Dr. Nikos Makris. The authors gratefully acknowledge Dr. Edward H. Yeterian, Dr. Larry Seidman, Jonathan Kaiser, Danielle Sliva, George Papadimitriou, Steve Hodge, Thomas Benner and Dr. Andre van der Kouwe for their valuable contributions to the preparation of this manuscript.
Footnotes
Human research statement: The experiments undertaken in this paper were performed with the understanding and written informed consent of each subject.
Offprints: Nikos Makris, M.D., Ph.D., Center for Morphometric Analysis, Massachusetts General Hospital, 149 13th St., Room 6017, Charlestown, MA.
Contributor Information
Nikos Makris, Departments of Psychiatry and Neurology, Harvard Medical School, Boston, MA 02129, USA. Department of Anatomy and Neurobiology, Boston University, School of Medicine, Boston, MA 02215, USA
Deepak N. Pandya, Department of Anatomy and Neurobiology, Boston University, School of Medicine, Boston, MA 02215, USA
References
- Ariens-Kappers CU, Huber GC, Crosby EC. The comparative anatomy of the nervous system of vertebrates including man. MacMillan; New York: 1936. [Google Scholar]
- Azuma M, Suzuki H. Properties and distribution of auditory neurons in the dorsolateral prefrontal cortex of the alert monkey. Brain Res. 1984;298(2):343–346. doi: 10.1016/0006-8993(84)91434-3. [DOI] [PubMed] [Google Scholar]
- Basser PJ, Pierpaoli C. Microstructural and physiological features of tissues elucidated by quantitative-diffusion-tensor MRI. J Magn Reson B. 1996;111:209–219. doi: 10.1006/jmrb.1996.0086. [DOI] [PubMed] [Google Scholar]
- Beaulieu C. The basis of anisotropic water diffusion in the nervous system—a technical review. NMR Biomed. 2002;15(7–8):435–455. doi: 10.1002/nbm.782. [DOI] [PubMed] [Google Scholar]
- Benson DA, Hienz RD, Goldstein MH., Jr Single-unit activity in the auditory cortex of monkeys actively localizing sound sources: spatial tuning and behavioral dependency. Brain Res. 1981;219(2):249–267. doi: 10.1016/0006-8993(81)90290-0. [DOI] [PubMed] [Google Scholar]
- Berke JJ. The claustrum, the external capsule and the extreme capsule of Macaca mulatto. J Comp Neurol. 1960;115(3):297–331. doi: 10.1002/cne.901150304. [DOI] [PubMed] [Google Scholar]
- Catani M, Howard RJ, Pajevic S, Jones DK. Virtual in vivo interactive dissection of white matter fasciculi in the human brain. Neuroimage. 2002;17(1):77–94. doi: 10.1006/nimg.2002.1136. [DOI] [PubMed] [Google Scholar]
- Catani M, Jones DK, ffytche DH. Perisylvian language networks of the human brain. Ann Neurol. 2005;57(1):8–16. doi: 10.1002/ana.20319. [DOI] [PubMed] [Google Scholar]
- Caviness VSJ, Makris N, Meyer J, Kennedy DN. MRI-based parcellation of human neocortex: an anatomically specified method with estimate of reliability. J Cogn Neurosci. 1996;8:566–588. doi: 10.1162/jocn.1996.8.6.566. [DOI] [PubMed] [Google Scholar]
- Clarke S, Bellmann Thiran A, Maeder P, Adriani M, Vernet O, Regli L, Cuisenaire O, Thiran JP. What and where in human audition: selective deficits following focal hemispheric lesions. Exp Brain Res. 2002;147(1):8–15. doi: 10.1007/s00221-002-1203-9. [DOI] [PubMed] [Google Scholar]
- Clarke S, Thiran AB. Auditory neglect: what and where in auditory space. Cortex. 2004;40(2):291–300. doi: 10.1016/S0010-9452(08)70124-2. [DOI] [PubMed] [Google Scholar]
- Crosby EC, Schnizlein HN. Comparative correlative neuroanatomy of the vertebrate telencephalon. Macmillan; New York: 1982. [Google Scholar]
- Dejerine J. Anatomie des Centres Nerveux Tome 1. Paris, France: Rueff et Cie; 1895. [Google Scholar]
- Dejerine J. Anatomie des Centres Nerveux Tome 2. Paris, France: Rueff et Cie; 1901. [Google Scholar]
- Ding G, Jiang Q, Li L, Zhang L, Zhang ZG, Ledbetter KA, Panda S, Davarani SP, Athiraman H, Li Q, Ewing JR, Chopp M. Magnetic resonance imaging investigation of axonal remodeling and angiogenesis after embolic stroke in sildenafil-treated rats. J Cereb Blood Flow Metab. 2008;28(8):1440–1448. doi: 10.1038/jcbfm.2008.33. [DOI] [PMC free article] [PubMed] [Google Scholar]
- Filipek PA, Richelme C, Kennedy DN, Caviness VS., Jr The young adult human brain: an MRI-based morphometric analysis. Cereb Cortex. 1994;4:344–360. doi: 10.1093/cercor/4.4.344. [DOI] [PubMed] [Google Scholar]
- Fullerton BC, Pandya DN. Architectonic analysis of theauditory-related areas of the superior temporal region in human brain. J Comp Neurol. 2007;504(5):470–498. doi: 10.1002/cne.21432. [DOI] [PubMed] [Google Scholar]
- Frey S, Campbell JS, Pike GB, Petrides M. Dissociating the human language pathways with high angular resolution diffusion fiber tractography. J Neurosci. 2008;28(45):11435–11444. doi: 10.1523/JNEUROSCI.2388-08.2008. [DOI] [PMC free article] [PubMed] [Google Scholar]
- Geschwind N. Disconnexion syndromes in animals and man. I. Brain. 1965a;88(2):237–294. doi: 10.1093/brain/88.2.237. [DOI] [PubMed] [Google Scholar]
- Geschwind N. Disconnexion syndromes in animals and man. II. Brain. 1965b;88(3):585–644. doi: 10.1093/brain/88.3.585. [DOI] [PubMed] [Google Scholar]
- Hackett TA, Preuss TM, Kaas JH. Architectonic identification of the core region in auditory cortex of macaques, chimpanzees, and humans. J Comp Neurol. 2001;441(3):197–222. doi: 10.1002/cne.1407. [DOI] [PubMed] [Google Scholar]
- Hackett TA, Stepniewska I, Kaas JH. Prefrontal connections of the parabelt auditory cortex in macaque monkeys. Brain Res. 1999;817(1–2):45–58. doi: 10.1016/S0006-8993(98)01182-2. [DOI] [PubMed] [Google Scholar]
- Jiang Q, Zhang ZG, Ding GL, Silver B, Zhang L, Meng H, Lu M, Pourabdillah-Nejed DS, Wang L, Savant-Bhonsale S, Li L, Bagher-Ebadian H, Hu J, Arbab AS, Vanguri P, Ewing JR, Ledbetter KA, Chopp M. MRI detects white matter reorganization after neural progenitor cell treatment of stroke. Neuroimage. 2006;32(3):1080–1089. doi: 10.1016/j.neuroimage.2006.05.025. [DOI] [PubMed] [Google Scholar]
- Kaas JH, Hackett TA. ‘What’ and ‘where’ processing in auditory cortex. Nat Neurosci. 1999;2(12):1045–1047. doi: 10.1038/15967. [DOI] [PubMed] [Google Scholar]
- Kaas JH, Hackett TA. Subdivisions of auditory cortex and processing streams in primates. Proc Natl Acad Sci USA. 2000;97(22):11793–11799. doi: 10.1073/pnas.97.22.11793. [DOI] [PMC free article] [PubMed] [Google Scholar]
- Klingberg T, Hedehus M, Temple E, Salz T, Gabrieli JD, Moseley ME, Poldrack RA. Microstructure of temporo-parietal white matter as a basis for reading ability: evidence from diffusion tensor magnetic resonance imaging. Neuron. 2000;25(2):493–500. doi: 10.1016/S0896-6273(00)80911-3. [DOI] [PubMed] [Google Scholar]
- Krieg WJS. Connections of the cerebral cortex. Brain Books; Evanston: 1963. [Google Scholar]
- Leinonen L, Hyvarinen J, Sovijarvi AR. Functional properties of neurons in the temporo-parietal association cortex of awake monkey. Exp Brain Res. 1980;39(2):203–215. doi: 10.1007/BF00237551. [DOI] [PubMed] [Google Scholar]
- Lori NF, Akbudak E, Shimony JS, Cull TS, Snyder AZ, Guillory RK, Conturo TE. Diffusion tensor fiber tracking of human brain connectivity: acquisition methods, reliability analysis and biological results. NMR Biomed. 2002;15(7–8):494–515. doi: 10.1002/nbm.779. [DOI] [PubMed] [Google Scholar]
- Makris N. Behavioral neuroscience. Boston University; Boston: 1999. Delineation of human association fiber pathways using histologic and magnetic resonance methodologies; p. 176. [Google Scholar]
- Makris N, Kennedy DN, McInerney S, Sorensen AG, Wang R, Caviness VS, Jr, Pandya DN. Segmentation of subcomponents within the superior longitudinal fascicle in humans: a quantitative, in vivo, DT-MRI study. Cereb Cortex. 2005;15(6):854–869. doi: 10.1093/cercor/bhh186. [DOI] [PubMed] [Google Scholar]
- Makris N, Pandya DN, Normandin JJ. Quantitative DT-MRI investigations of the human cingulum bundle. Cent Nerv Syst Spectrums. 2002;7(7):522–528. [Google Scholar]
- Makris N, Papadimitriou GM, Kaiser JR, Sorg S, Kennedy DN, Pandya DN. Delineation of the middle longitudinal fascicle in humans: a quantitative, in vivo, DT-MRI study. Cereb Cortex. 2008 doi: 10.1093/cercor/bhn124. (in press) [DOI] [PMC free article] [PubMed] [Google Scholar]
- Makris N, Papadimitriou GM, Sorg S, Kennedy DN, Caviness VS, Pandya DN. The occipitofrontal fascicle in humans: a quantitative, in vivo, DT-MRI study. Neuroimage. 2007;37(4):1100–1111. doi: 10.1016/j.neuroimage.2007.05.042. [DOI] [PMC free article] [PubMed] [Google Scholar]
- Makris N, Worth AJ, Sorensen AG, Papadimitriou GM, Wu O, Reese TG, Wedeen VJ, Davis TL, Stakes JW, Caviness VS, Kaplan E, Rosen BR, Pandya DN, Kennedy DN. Morphometry of in vivo human white matter association pathways with diffusionweighted magnetic resonance imaging. Ann Neurol. 1997;42(6):951–962. doi: 10.1002/ana.410420617. [DOI] [PubMed] [Google Scholar]
- Martinkauppi S, Rama P, Aronen HJ, Korvenoja A, Carlson S. Working memory of auditory localization. Cereb Cortex. 2000;10(9):889–898. doi: 10.1093/cercor/10.9.889. [DOI] [PubMed] [Google Scholar]
- Mesulam MM. From sensation to cognition. Brain. 1998;121(Pt6):1013–1052. doi: 10.1093/brain/121.6.1013. [DOI] [PubMed] [Google Scholar]
- Mori S, Crain BJ, Chacko VP, van Zijl PC. Three-dimensional tracking of axonal projections in the brain by magnetic resonance imaging. Ann Neurol. 1999;45(2):265–269. doi: 10.1002/1531-8249(199902)45:2\265::AID-ANA21[3.0.CO;2-3. [DOI] [PubMed] [Google Scholar]
- Morosan P, Rademacher J, Schleicher A, Amunts K, Schormann T, Zilles K. Human primary auditory cortex: cytoarchitectonic subdivisions and mapping into a spatial reference system. Neuroimage. 2001;13(4):684–701. doi: 10.1006/nimg.2000.0715. [DOI] [PubMed] [Google Scholar]
- Ojemann G, Ojemann J, Lettich E, Berger M. Cortical language localization in left, dominant hemisphere. An electrical stimulation mapping investigation in 117 patients. J Neurosurg. 1989;71(3):316–326. doi: 10.3171/jns.1989.71.3.0316. [DOI] [PubMed] [Google Scholar]
- Ojemann JG, McKinstry RC, Mukherjee P, Park TS, Burton H. Hand somatosensory cortex activity following selective dorsal rhizotomy: report of three cases with fMRI. Childs Nerv Syst. 2005;21(2):115–121. doi: 10.1007/s00381-004-1051-y. [DOI] [PubMed] [Google Scholar]
- Petrides M, Pandya DN. Projections to the frontal cortex from the posterior parietal region in the rhesus monkey. J Comp Neurol. 1984;228(1):105–116. doi: 10.1002/cne.902280110. [DOI] [PubMed] [Google Scholar]
- Petrides M, Pandya DN. Association fiber pathways to the frontal cortex from the superior temporal region in the rhesus monkey. J Comp Neurol. 1988;273(1):52–66. doi: 10.1002/cne.902730106. [DOI] [PubMed] [Google Scholar]
- Petrides M, Pandya DN. Efferent association pathways originating in the caudal prefrontal cortex in the macaque monkey. J Comp Neurol. 2006;498(2):227–251. doi: 10.1002/cne.21048. [DOI] [PubMed] [Google Scholar]
- Petrides M, Pandya DN. Efferent association pathways from the rostral prefrontal cortex in the macaque monkey. J Neurosci. 2007;27(43):11573–11586. doi: 10.1523/JNEUROSCI.2419-07.2007. [DOI] [PMC free article] [PubMed] [Google Scholar]
- Petrides M, Pandya DN. Neural circuitry underlying language. In: Marien P, Abutalebi J, editors. Neuropsychological research: a review. Psychology Press; London: 2008. pp. 22–60. [Google Scholar]
- Pierpaoli C, Barnett A, Pajevic S, Chen R, Penix LR, Virta A, Basser P. Water diffusion changes in Wallerian degeneration and their dependence on white matter architecture. Neuroimage. 2001;13(6Pt 1):1174–1185. doi: 10.1006/nimg.2001.0765. [DOI] [PubMed] [Google Scholar]
- Pierpaoli C, Basser PJ. Toward a quantitative assessment of diffusion anisotropy. Magn Reson Med. 1996;36(6):893–906. doi: 10.1002/mrm.1910360612. [DOI] [PubMed] [Google Scholar]
- Rademacher J, Galaburda AM, Kennedy DN, Filipek PA, Caviness Vsj. Human cerebral cortex: localization, parcellation, and morphometry with magnetic resonance imaging. J Cogn Neurosci. 1992;4(4):352–374. doi: 10.1162/jocn.1992.4.4.352. [DOI] [PubMed] [Google Scholar]
- Rauschecker J. Compensatory plasticity and sensory substitution in the cerebral cortex. Trends Neurosci. 1995;18:36–43. doi: 10.1016/0166-2236(95)93948-W. [DOI] [PubMed] [Google Scholar]
- Rauschecker JP, Tian B. Mechanisms and streams for processing of “what” and “where” in auditory cortex. Proc Natl Acad Sci USA. 2000;97(22):11800–11806. doi: 10.1073/pnas.97.22.11800. [DOI] [PMC free article] [PubMed] [Google Scholar]
- Rilling JK, Glasser MF, Preuss TM, Ma X, Zhao T, Hu X, Behrens TE. The evolution of the arcuate fasciculus revealed with comparative DTI. Nat Neurosci. 2008;11(4):426–428. doi: 10.1038/nn2072. [DOI] [PubMed] [Google Scholar]
- Romanski LM, Bates JF, Goldman-Rakic PS. Auditory belt and parabelt projections to the prefrontal cortex in the rhesus monkey. J Comp Neurol. 1999a;403(2):141–157. doi: 10.1002/(SICI)1096-9861(19990111)403:2\141::AID-CNE1[3.0.CO;2-V. [DOI] [PubMed] [Google Scholar]
- Romanski LM, Tian B, Fritz J, Mishkin M, Goldman-Rakic PS, Rauschecker JP. Dual streams of auditory afferents target multiple domains in the primate prefrontal cortex. Nat Neurosci. 1999b;2(12):1131–1136. doi: 10.1038/16056. [DOI] [PMC free article] [PubMed] [Google Scholar]
- Saur D, Kreher BW, Schnell S, Kummerer D, Kellmeyer P, Vry MS, Umarova R, Musso M, Glauche V, Abel S, Huber W, Rijntjes M, Hennig J, Weiller C. Ventral and dorsal pathways for language. Proc Natl Acad Sci USA. 2008;105(46):18035–18040. doi: 10.1073/pnas.0805234105. [DOI] [PMC free article] [PubMed] [Google Scholar]
- Schmahmann JD, Pandya DN. Fiber pathways of the brain. Oxford University Press; New York: 2006. [Google Scholar]
- Schmahmann JD, Pandya DN, Wang R, Dai G, D’Arceuil HE, de Crespigny AJ, Wedeen VJ. Association fibre pathways of the brain: parallel observations from diffusion spectrum imaging and autoradiography. Brain. 2007;130(Pt 3):630–653. doi: 10.1093/brain/awl359. [DOI] [PubMed] [Google Scholar]
- Seltzer B, Pandya DN. Further observations on parietotemporal connections in the rhesus monkey. Exp Brain Res. 1984;55(2):301–312. doi: 10.1007/BF00237280. [DOI] [PubMed] [Google Scholar]
- Talairach J, Tournoux P. Co-planar stereotaxic atlas of the human brain. Thieme Medical Publishers, Inc; New York: 1988. [Google Scholar]
- Vaadia E, Benson DA, Hienz RD, Goldstein MH., Jr Unit study of monkey frontal cortex: active localization of auditory and of visual stimuli. J Neurophysiol. 1986;56(4):934–952. doi: 10.1152/jn.1986.56.4.934. [DOI] [PubMed] [Google Scholar]
- Wernicke C. Der aphasiche Symptomenkomplex. Cohn und Weigert; Breslau: 1874. [Google Scholar]
- Werring DJ, Toosy AT, Clark CA, Parker GJ, Barker GJ, Miller DH, Thompson AJ. Diffusion tensor imaging can detect and quantify corticospinal tract degeneration after stroke. J Neurol Neurosurg Psychiatry. 2000;69(2):269–272. doi: 10.1136/jnnp.69.2.269. [DOI] [PMC free article] [PubMed] [Google Scholar]