

Abstract
Obsessive–compulsive disorder (OCD) is associated with dysfunctional brain activity in several regions which are also involved in the processing of motivational stimuli. Processing of reward and punishment appears to be of special importance to understand clinical symptoms. There is evidence for higher sensitivity to punishment in patients with OCD which raises the question how avoidance of punishment relates to activity within the brain's reward circuitry. We employed the monetary incentive delay task paradigm optimized for modeling the anticipation phase of immediate reward and punishment, in the context of a cross-sectional event-related FMRI study comparing OCD patients and healthy control participants (n = 19 in each group). While overall behavioral performance was similar in both groups, patients showed increased activation upon anticipated losses in a medial and superior frontal cortex region extending into the cingulate cortex, and decreased activation upon anticipated rewards. No evidence was found for altered activation of dorsal or ventral striatal regions. Patients also showed more delayed responses for anticipated rewards than for anticipated losses whereas the reverse was true in healthy participants. The medial prefrontal cortex has been shown to implement a domain-general process comprising negative affect, pain and cognitive control. This process uses information about punishment to control aversively motivated actions by integrating signals arriving from subcortical regions. Our results support the notion that OCD is associated with altered sensitivity to anticipated rewards and losses in a medial prefrontal region whereas there is no significant aberrant activation in ventral or dorsal striatal brain regions during processing of reinforcement anticipation.
Keywords: Brain imaging, Obsessive–compulsive disorder, Reward, Punishment, Cingulate gyrus, Medial frontal gyrus, Superior frontal gyrus, FMRI, Monetary incentive delay task
Highlights
► OCD associated with bias towards avoidance of aversive stimuli. ► Ventral/dorsal striatal brain activity during reward processing not altered in OCD. ► Medial prefrontal brain activity mediates avoidance of aversive stimuli in OCD. ► Medial prefrontal brain activity related to cortical processing of negative affect.
1. Introduction
Patients with obsessive–compulsive disorder (OCD) get stuck on a particular aversive thought or urge and just cannot let go compensatory behaviors like hand washing or controlling. Qualitatively similar thoughts or actions are common in everyday life but are usually terminated in time in non-OCD subjects. Empirically, there is strong evidence from resting state, symptom provocation as well as treatment studies that the disease is associated with dysfunctional brain structures including the basal ganglia, the thalamus, as well as frontal and parietal cortex structures (Menzies et al., 2008). Activation of these regions is provoked by cues associated with symptoms and appears to reflect processing of negative mood states (Heinz, 1999; Rotge et al., 2008). Brain regions implicated in OCD are also involved in tasks related to monetary reward and punishment. From a clinical perspective, responses to anticipated reward and punishment may be crucial for obsessive–compulsive behaviors. Compulsive behaviors are purported to reduce distress and anxiety (Salkovskis, 1999), that is they are experienced as immediate avoidance of punishment. There is also evidence for higher sensitivity to punishment in patients with OCD on the behavioral level (Fullana et al., 2004a). It is therefore a central question of OCD pathopsychology how avoidance of punishment relates to activity within the brain's reward circuitry.
So far, two studies challenged the reward circuitry in obsessive–compulsive disorder (Figee et al., 2011; Jung et al., 2011). While Jung et al. (2011) found no group differences, Figee et al. (2011) reported attenuated activity within the dorsal striatum of OCD patients during reward anticipation. Additionally, Jung et al. found decreased activity within the dorsal striatum in OCD upon loss receipt while Figee et al. did not analyze loss receipt (because they restricted their experimental design to stimuli indicating reward). Therefore, heterogeneity of these results may be due to distinct differences in experimental task design. Nevertheless, both studies showed for the first time evidence for altered brain activity in OCD in the context of monetary incentive delay tasks.
During the last decade the monetary incentive delay task paradigm (Knutson et al., 2001) was employed in numerous FMRI studies in health and disease (Juckel et al., 2006; Knutson et al., 2008; Schlagenhauf et al., 2008; Strohle et al., 2008; Wrase et al., 2007). The experimental paradigm in its original form is optimized for modeling the anticipation phase of immediate reward and punishment. In healthy participants anticipation of rewards and losses was repeatedly found to be associated with BOLD responses in thalamic, striatal and frontal brain structures in healthy subjects (Breiter et al., 2001; Kirsch et al., 2003; Knutson et al., 2000, 2001; Zink et al., 2004). More specifically, mesial prefrontal cortex (MPFC) activity preferentially tracks rewarding outcomes (Knutson et al., 2003). Activity of a caudate region during anticipation of both reward and punishment was shown to code for expected outcome magnitude whereas ventral striatal activity was associated with expected positive incentive valence (Knutson et al., 2001). Dopamine release from ventral tegmental area (VTA) neurons projecting to cortical and subcortical regions is increased during reward expectancy (Ikemoto and Panksepp, 1999), and hence drives activity in the ventral striatum and the MPFC. Further, serotonergic transmission in the forebrain regulates decision making and motivated choices about obtaining reinforcers (Crean et al., 2002; Dalley et al., 2004).
Following this line of research the aim of the present study was to elucidate neural correlates for the proposed hypersensitivity to punishment in OCD within the brain's reward circuitry using the monetary incentive delay task focusing on the anticipation phase of incentive processing. According to the literature we hypothesized that hemodynamic activity of the ventral and dorsal striatum, thalamus, cingulate and medial prefrontal cortex would be altered during anticipation of reward and punishment in OCD. Because of indecisive evidence with respect to increased or decreased brain activity in OCD patients relative to healthy controls we refrained from postulating directions of effects. We were additionally interested whether clinically assessed symptom severity and hemodynamic activity would be correlated.
2. Materials and methods
2.1. Participants
Patients (n = 19) were consecutively recruited from the OCD outpatient clinic at the Humboldt-Universität zu Berlin. They fulfilled DSM-IV criteria for obsessive–compulsive-disorder (300.3), and were currently or had recently been under treatment with cognitive-behavioral psychotherapy. The Structured Clinical Interview for DSM-IV (SCID; German version: Wittchen et al., 1997) was used by a trained clinical psychologist not involved in the study to confirm clinical axis I diagnoses. Severity of OCD symptoms was evaluated using the Yale-Brown Obsessive Compulsive Scale (Y-BOCS: Goodman et al., 1989). Patients with past or present psychotic symptoms, or with past or present substance dependence, and with known or self-reported head trauma or neurologic disease were excluded. Ten patients had comorbid diagnoses (affective disorder, n = 7; phobic disorders, n = 3; impulse control disorder, n = 1; personality disorder, n = 3). Three out of the 19 patients were taking antiobsessional drugs (one clomipramine 10 mg/d, one venlafaxine 75 mg/d, and one a combination of clomipramine 75 mg/d and paroxetine 30 mg/d). No patient took benzodiazepines within 4 weeks before the scanning session.
Additional information with respect to symptom profiles according to the Y-BOCS symptom-checklist for all available OCD patients (n = 17), which were summarized using a recently described method (Katerberg et al., 2010) is provided as supplementary material (Table S1a and b).
Participants of the control group (n = 19) were matched to the patients regarding gender, age, handedness, and verbal intelligence (Table 1). None of them had present signs or a history of psychiatric or neurologic disorder according to a SCID-I-based screening interview. They also reported to not having used psychoactive drugs during the past 3 months.
Table 1.
Demographic and psychometric data and total earnings in the MID task of OCD patients and matched healthy controls; comparisons are based on two-sample t tests.
| N = 19 vs. 19 | OCD (M ± SD) | Control | t (p value) |
|---|---|---|---|
| Sex [female (male)] | 11 (8) | 11 (8) | |
| Age | 34.8 (11.0) | 34.9 (11.8) | 0.03 (.98) |
| Intelligence (verbal) | 104 (10) | 107 (12) | − 1.07 (.29) |
| Handedness | 77 (55) | 67 (47) | 0.65 (.52) |
| STAI-X1 (state) | 54 (13) | 49 (6) | 1.61 (.12) |
| STAI-X2 (trait) | 61 (13) | 50 (6) | 3.32 (.002) |
| Earnings in € | 21.80 (7.80) | 22.00 (6.40) | − 0.07 (.95) |
| Y-BOCS (range 9–39) | 20.7 (7.9) | ||
| OCI-R (range 9–61) | 24 (14) | ||
| BDI (range 0–38) | 17 (11) | ||
| Medication (N) | 3 | ||
| Comorbidity (N) | 10 |
All participants had normal or corrected-to-normal vision. They completed a German vocabulary test (Wortschatztest, WST: Schmidt and Metzler, 1992), the Edinburgh Handedness Inventory (EHI: Oldfield, 1971), and the State-Trait Anxiety Inventory (STAI: Laux et al., 1981). OCD patients were additionally assessed using the Obsessive–Compulsive Inventory-Revised (OCI-R: Foa et al., 2002), and the Beck Depression Inventory (BDI: Beck et al., 1995). All participants gave written informed consent according to the institutional guidelines before enrollment. The study was approved by the local ethics committee.
2.2. Task
The task (Fig. 1) was adapted from the monetary incentive delay task (MID) as described by Knutson et al. (2001). There were seven different types of trials: three trial-types with the possibility of winning money on a correct (i.e. timely) button press (reward trials), three trial-types with the possibility to avoid losing money on a correct button press (loss-avoidance trials), and in the remaining trial-type there were no monetary consequences at all (neutral trials). At the beginning of each trial, one of seven different cues was shown to indicate trial type. Participants were asked to press a button as soon as the target stimulus (gray colored square) appeared. Depending on the performance (i.e. timely motor response) participants received feedback about winning or losing money. Each run consisted of 72 trials, i.e. 27 gain, 27 loss, and 18 neutral trials with each trial lasting for 11.6 s on average (see Fig. 1 for details). Subjects performed the task three times in succession. The first run was a training session while structural MR-sequences were obtained, and the remaining two runs were conducted subsequently. Task difficulty was continuously adapted to come up with a 66% success level in each subject across a task run. This was achieved by using individually tailored reaction times of the training session, and by adapting the response deadline as a result of the averaged reaction times in previous trials and the correctness of the immediately preceding trial during the test runs. Participants effectively received the money they had earned in the game. After the end of the session, they reported whether they had in fact believed in this announcement. From the two task sessions during which FMRI was done, one was selected for final analysis. This selection was made with the aim to match patient and control groups for global performance according to their success level, i.e. total earnings. Selection was carried out blind to FMRI results. The number of sessions selected from first and second runs was comparable in patients and controls (OCD 8/11; controls 9/10). Subsequently, both runs were included in an additional analysis in order to ensure whether FMRI findings remain constant.
Fig. 1.
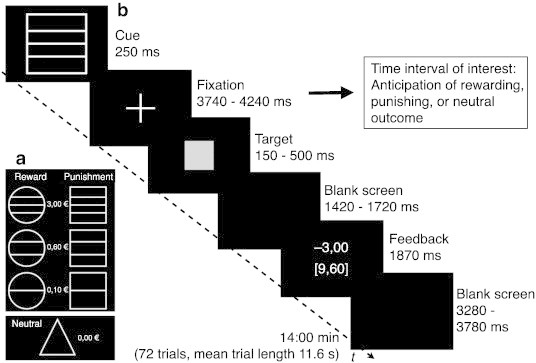
Monetary incentive delay task (MID). (a) the diagram shows the different trial types and (b) the course of one trial. In this example the subject did not respond in time and therefore was punished with a reduction of the total winning sum by 3 Euro (i.e. winnings were reduced from € 12.60 to € 9.60). Participants started with a credit of 5 Euro; the possible maximum sum of winnings was € 38.30.
2.3. FMRI acquisition
Data were acquired on a 1.5 T MR scanner equipped with a circular-polarized headcoil (Siemens Sonata, Erlangen, Germany) with an T2*-weighted single-shot gradient echo planar imaging sequence: 33 slices, 3 × 3 × 3.5 mm resolution, TE = 40 ms, TR = 1.87 s, flip angle = 90°, interleaved acquisition (from bottom to top), 450 AC-PC oriented images for each run. A vacuum head cushion was used to immobilize the participants' heads and necks in order to reduce movement artifacts. Earplugs were provided to attenuate background noise and additional headphones were used to communicate with subjects. Stimuli were generated using Presentation (Neurobehavioral Systems) and were projected by means of a mirror system attached to the head coil. Anatomical high-resolution T1-weighted scans (spatial resolution 1 × 1 × 1 mm, TR = 12.24 ms, TE = 3.56 ms, flip angle = 23°, 256 × 224 matrix) (Deichmann, 2005) were acquired during the training session of the MID task.
2.4. Statistical analysis
T tests for independent samples were computed to compare the samples for age, verbal intelligence, handedness, sum of earnings in the MID task, and STAI-X1 and X2 test scores. Behavioral data were analyzed with repeated measures ANOVAs (reaction times: group (2) × cue (7)); proportion of delayed responses: group (2) × condition (reward, neutral, loss-avoidance). FMRI data were analyzed with SPM8 (www.fil.ion.ucl.ac.uk/spm). First, the original data files were converted from Dicom to Nifti file format. The first four volumes of each functional time series were discarded in order to avoid non-steady state effects caused by T1 saturation. After slice time correction, all volumes were realigned to the first volume in order to correct for between-scan movements and to remove signals correlated with head motion. Motion correction estimation revealed that no subjects showed more than 2 mm head movement and more than one degree of rotation during one run. The anatomical data set was coregistered with the mean T2* image, and T1-weighted images were segmented into gray matter, white matter, and cerebrospinal fluid. The gray matter of the coregistered structural image was spatially normalized to the standard template provided by the Montreal Neurological Institute (MNI template) using an automated spatial transformation. The resulting transformation matrix was subsequently applied to the T2* data, and a resampling to a resolution of 3 × 3 × 3 mm voxel size was performed. Finally, the normalized images were smoothed with a Gaussian kernel (full width at half maximum) of 8 mm to create a locally weighted average of the surrounding voxels. FMRI data were then analyzed in the context of the general linear model (Friston et al., 1995) by convolving the regressors with a canonical hemodynamic response function as implemented in SPM8. Data analysis was performed by modeling the different cue conditions. Changes in the BOLD response were assessed using linear combinations of the estimated GLM parameters (beta values) and are contained in the individual contrast images for the anticipation of monetary reward versus no consequence, and the anticipation of loss-avoidance versus no consequence, resulting in a t statistic for each voxel. To detect differences in BOLD responses, individual contrast images (i.e. the BOLD response differences) of all subjects in each group were included in a second-level random effects analysis with a group (2) × condition (2; anticipation of reward versus loss avoidance) × amount of consequence (3; low vs. medium vs. high) ANOVA model. All presented results relate to random effects analyses and thus include a group by subject response interaction term. In order to ensure valid statistics on the group level we employed an approach with partitioned error terms as implemented with GLMFlex (extension to SPM8: GLM Flex, http://nmr.mgh.harvard.edu/harvardagingbrain/People/AaronSchultz/Aarons_Scripts.html) and two-sample T tests (which are not prone to false between-subjects statistics within SPM). Because between-subjects effects are overestimated within SPM8 for group model statistics, additional interaction terms for between-subjects error and within-factor error are included into second-level model analysis. Statistical significance for the main effects of condition was set to p < .05 (family wise error rate [FWE] whole-brain corrected for multiple measurements) for gain or loss > neutral; p < .05 (false discovery rate [FDR] whole-brain corrected for multiple measurements) for gain > loss, and to p < .01 (corrected with a cluster-size based correction for multiple comparisons) for group effects: By using a combination of probability thresholding and cluster thresholding the power of the statistical test is maximized while holding the likelihood of false positives to a minimum. The Alphasim program (http://afni.nimh.nih.gov/pub/dist/doc/program_help/AlphaSim.html) as implemented in Resting-State fMRI Data Analysis Toolkit V1.5 (http://www.restfmri.net) was used to determine the cluster threshold. The program is provided with the number of voxels in the group map, the spatial correlation of voxels, and the voxelwise threshold (in this study, t > 3.66, p < .001). A series of Monte Carlo simulations (10,000 iterations for our study) was then carried out to determine the frequency of each conforming cluster size produced purely by chance. From this frequency distribution, the cluster size (1701 microliter given our parameters) that occurs < 1% of the time by chance could be selected, to give a threshold of p < .01 (corrected). Transformation from MNI to Talairach coordinates was performed according to Lancaster et al. (2007). For the correlation of BOLD contrasts in regions of interest with clinically assessed OCD symptom severity, Y-BOCS ratings were used.
3. Results
3.1. Total earnings
Mean earnings (± SD) amounted to € 21.80 ± 7.80 in the OCD group and € 22.00 ± 6.40 in the control group. Success rates were held close to 66% in each subject due to an adaptive procedure (see Materials and methods section).
3.2. Types of responses
We classified responses as correct, delayed or omitted. Omitted responses, i.e. no response or a response with a reaction time of more than 1000 ms, were rare with less than 2% in each group. Delayed responses, i.e. responses after the individually defined deadline but within 1 s, occurred with an overall rate of 31.6%. For delayed responses, there was no main effect of group, F(1,36) = 0.514, p = 0.48, and no main effect of condition (reward, neutral or loss-avoidance), F(2,35) = 0.11, p = 0.74, but a significant interaction of condition with group (F(2,35) = 4.098, p = 0.05). This interaction reflects that the OCD group showed fewer delayed responses in loss-avoidance trials (26.9%) than in reward trials (33.1%), whereas the opposite was true in the control group (29.6% vs. 25.1%, respectively, see Fig. 2).
Fig. 2.
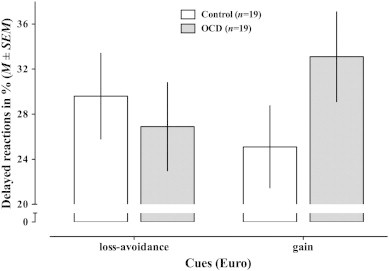
Delayed reactions. The bargraph visualizes the proportion of delayed responses for each group and condition, and shows the significant interaction of group × condition (F(2,35) = 4.098, p = 0.050). Different magnitudes of rewards and losses are collapsed.
3.3. Response times
Response times are depicted in Fig. 3. Mean response time was similar in the OCD group (222 ms ± 36 SD) and the control group (218 ± 43), the main effect of group being non-significant (F(1,36) = .22, p = 0.64). There was a significant main effect of cue (F(6,31) = 22.25, p ≤ 0.001), but no interaction of cue with group (F(6,31) = 1.285, p = 0.293). Post hoc tests showed no differences between groups for any cue (all p > 0.13).
Fig. 3.
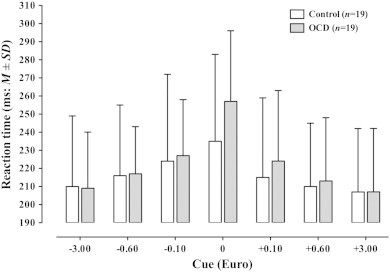
Mean response times for each group and cue. Post hoc tests showed no differences between groups for any cue (all p > .05; for neutral condition: t[36] = 1.54, p = .132, two-sided t test).
3.4. BOLD results
3.4.1. Condition effects
The BOLD responses contrasting anticipation of reward or loss-avoidance with anticipation of the neutral condition revealed several active brain regions (Fig. S2 and Table S2) including bilateral cerebellum, (pre-) cuneus, midbrain, thalamus, dorsal striatum, ventral striatum, cingulate cortex, medial frontal cortex, precentral gyrus, insula, and parietal regions. In general, the pattern of activation was similar for both types of anticipated consequences but less pronounced for anticipation of potential loss. Significantly more activation in the reward than in the loss-avoidance condition was found in the striatum (dorsal and ventral) and the medial prefrontal cortex/cingulate gyrus (p FDR corrected at 0.05). No region was more activated in the loss-avoidance than in the reward condition at this threshold. In addition, we also found magnitude effects for the different cues (data not shown) similar to those previously reported by Knutson et al. (2001).
3.4.2. Group effects
There was no main effect of group in the hypothesized brain regions of the reward circuitry, i.e. thalamic, dorsal and ventral striatal, cingulate, and medial frontal regions. To illustrate this finding, Fig. 4 shows BOLD contrast estimates for the head of the caudate nucleus and the ventral striatum. For the caudate nucleus, there were cue effects (F(6,31) = 10.81, p ≤ .01) but no group differences (F(1,36) = 0.83, p = .42), and also no interactions of group × cue (F(6,31) = 0.71, p = .64); similarly, for the ventral striatum cue effects (F(6,31) = 5.43, p ≤ .01), but no group differences (F(1,36) = 0.91, p = .37), and no interactions of group × cue (F(6,31) = 1.04, p = .29) were found. In order to corroborate these null findings we included both runs, disregarding overall behavioral performance. Again we did not find evidence for group differences in dorsal or ventral striatal regions even with a more liberal statistical threshold of p = .005 (uncorrected).
Fig. 4.
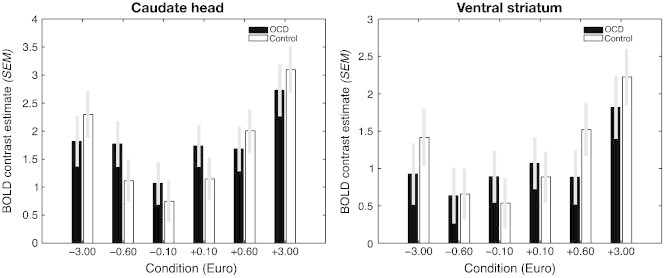
BOLD contrast estimates (mean ± SEM) for each cue relative to the neutral cue for the head of the caudate nucleus (left) and the ventral striatum (right). Estimates of patients (black) and controls (white) are depicted with different bars. Note the parametric effect of cue in both regions (see Results section).
An interaction of group by condition (reward vs. loss-avoidance) was found in a medial prefrontal/cingulate region (Fig. 5 and Table 2) indicating differential activation patterns during anticipation of reward versus loss in OCD and control samples. This interaction was also observed at the same statistical threshold in an additional analysis controlling for trait anxiety. Trait anxiety was measured with the STAI-X2, and patients reported higher anxiety levels. We noted no other significant interactions of group with condition even at a more liberal threshold of p < .001, uncorrected. A supplementary analysis of a subgroup of patients without comorbid major depression and their matched healthy controls (n = 12 vs. 12) revealed similar results (Fig. S3).
Fig. 5.
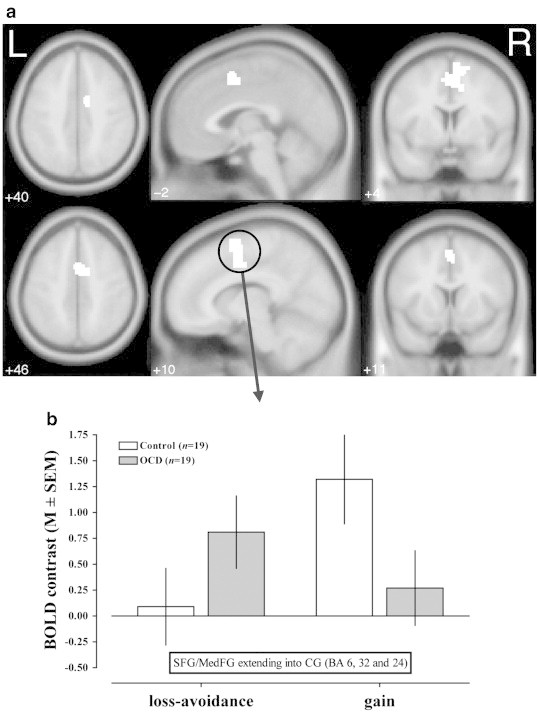
The diagram shows two perspectives on the interaction group by condition (reward or loss-avoidance). (a) Statistical parametric maps are projected onto a brain template in MNI space (p < .01 corrected with a cluster-size based correction for multiple comparisons). The axial, sagittal and coronal slices show the interaction in medial frontal/cingulate regions. (b) BOLD contrasts in the region comprising superior/medial frontal and cingulate voxels show significantly more activation in OCD patients under loss-avoidance conditions but less activation under reward conditions (loss-avoidance: t(36) = − 2.489, p = .018, gain: t(36) = 2.906, p = .006).
Table 2.
Location of activated clusters in MNI stereotactic space for the interaction group × type of consequence (p < .01 corrected with a cluster-size based correction for multiple comparisons).
| Anatomical region (Brodmann area) |
Hemisphere | Z value | x | y | z |
|---|---|---|---|---|---|
| Superior frontal gyrus (6) | R | 3.6 | 9 | 3 | 63 |
| L | 3.45 | − 2 | 6 | 53 | |
| Cingulate gyrus (24) | R | 3.57 | 12 | 0 | 45 |
| R | 3.49 | 6 | 0 | 45 | |
| Medial frontal gyrus (32) | R | 3.51 | 3 | 6 | 48 |
Both runs were included in an additional analysis in order to ensure whether FMRI findings including all patients and controls remain constant. The interaction of group by condition diminished but remained at a more liberal threshold of p < .005, not corrected for multiple measurements (data not shown).
3.4.3. Correlations of BOLD responses and symptoms
After extracting volumes of the ROIs, which were defined by the clusters showing significant group x condition interaction (Table 2), individual contrast parameters (gain and loss versus neutral) were computed and correlated with Y-BOCS ratings. Y-BOCS ratings did not correlate significantly with BOLD responses.
4. Discussion
4.1. Behavioral performance
Both groups showed comparable behavioral performance. Reaction times varied as a function of monetary value, i.e. decreased with increasing magnitude of the consequence. A two-thirds success level was established using an individual adaptation procedure for response deadlines. This was done because the reward system is best stimulated by rewards which have moderate predictability (Schultz, 2000): The effort a person expends on obtaining an object signaling reward (or avoiding loss), is highest for surprising rewards (Berns et al., 2001) and decreases for random or continuously occurring reinforcement. Magnitude of reward expectation is therefore critical for maintaining a functional level of reward-directed behavior, which itself is associated with phasic dopaminergic release (Fuente-Fernandez et al., 2002; Zald et al., 2004). Likewise, in the MID task used in the present experiment anticipation of monetary gains or losses is assumed to motivate subjects to expend efforts in responding as quick as possible (Knutson et al., 2000). Because overall reaction times were not different between groups OCD is not associated with general slowing of motor responses, nor with any alteration of the global motivational level.
4.1.1. Bias towards avoidance of aversive stimuli in OCD
Patients with OCD showed a relative decrease of delayed responses after loss-indicating cues compared to cues indicative for reward. This suggests that anticipated losses might have higher motivational significance than anticipated rewards. The effect size of the interaction was small which is comprehensible as groups were matched according to their general performance thus reducing possible effects. This finding fits well into clinical symptom descriptions (Carr, 1974), and was recently described more formally in patients with hoarding symptoms as well as subjects with subclinical obsessive–compulsive states (Fullana et al., 2004a, 2004b). Cognitive models of obsessive–compulsive psychopathology state that patients overestimate the probability of negative events in unpleasant or threatening situations (Carr, 1974; Obsessive Compulsive Working Group, 2005). Accordingly, patients should be more motivated by loss-avoidance than by direct reward which is supported by our data. It is tempting to speculate that certain dimensions of OCD psychopathology show different sensitivity to reward and punishment. This would be clinically important because therapeutic strategies should then be adapted to such differential reinforcement sensitivity. Obsessive–compulsive symptom dimensions have been shown to be underpinned by partly distinct cortical and subcortical brain activities (Mataix-Cols et al., 2004; van den Heuvel et al., 2009). Further research is needed to compare larger patient samples with variance in their symptom dimensions (Katerberg et al., 2010) regarding sensitivity to reward and punishment.
4.2. BOLD results
BOLD responses for anticipation of potentially motivating consequences revealed activation patterns which were similar to those described in several previous studies (Breiter et al., 2001; Kirsch et al., 2003; Knutson et al., 2000, 2001, 2003; Zink et al., 2004). Activations were found in key regions of the reward circuitry including the ventral striatum and the caudate nucleus, demonstrating that the experimental paradigm revealed expected results thus enabling us to test the hypothesis that OCD patients show altered neuronal responses during anticipation of secondary reinforcers.
4.2.1. Similar subcortical brain activity during anticipation of reinforcement in OCD
We observed no overall increase or decrease of brain activity in basal ganglia structures in OCD patients. Notably, key regions of the reward circuitry as the ventral striatum and the caudate nucleus showed similar activity in both groups during reward and loss anticipation. These results let us conclude that there is no global or trait-like hyper- or hypoactivity of the basal ganglia and connected cortical regions during anticipation of reinforcement. This finding is in agreement with Jung et al. (2011), who also did not find altered striatal brain activity in OCD patients during anticipation of secondary reinforcers.
4.2.2. Discrepant findings in the literature
But contrary to Jung et al. and our results Figee et al. (2011) observed attenuated BOLD activity of the caudate nucleus during anticipation of reward in patients with OCD. Note, however, that the authors labeled their reported MNI coordinates as nucleus accumbens, although a Talairach based localization (Lancaster et al., 2000; Talairach and Tornoux, 1988) would better indicate a region in the dorsal striatum for these coordinates.
Studies of the human striatal architecture distinguishing the ventral striatum from dorsal caudate also show that the localization of Figee et al.'s results correspond to a caudate brain region (Di Martino et al., 2008; Harrison et al., 2009). This inconsistency might be of importance in this context because conclusions based on nucleus accumbens or caudate nucleus would differ regarding the involved mesolimbic or nigrostriatal pathways (Arias-Carrion et al., 2010). It was shown that dorsal striatum codes for expected outcome magnitude whereas ventral striatal activity codes more for expected positive incentive valence (Knutson et al., 2001).
Also, study and task design differ in several important aspects: Symptom severity was higher in the patient sample of Figee et al. (2011). In addition, they presented rewarding consequences only but no loss trials. Further, a slow paced version of the task was used with the aim to disentangle anticipation and delivery of reward. Finally, the authors used a reward probability of 50% during rewarding trials to maximize reward uncertainty whereas we employed a reward probability of 66% with lower reward uncertainty. Regarding the differences in symptom severity it cannot be excluded that attenuated hemodynamic activity in OCD during reward anticipation in the dorsal striatum is restricted to patients with severe symptoms. It has been described that so-called punishers induce negative emotional states of anger or fear. Because of the different rewarding scheme used by Figee et al. without any loss trials triggers for negative emotional states were not present (Schultz, 2000). Consequently, participants of our study were in need of differentiating motivational valence of consequences. This might have some impact both on the behavioral and hemoynamic level.
Both, Figee et al.'s and our study, employed reward probabilities which ensured reward-directed behavior associated with phasic dopaminergic activity (Fuente-Fernandez et al., 2002; Zald et al., 2004). Figee et al. additionally maximized reward uncertainty which was shown to be associated with an increase of tonic dopaminergic activity in ventral midbrain areas until the time of reward delivery (Fiorillo et al., 2003). The dopaminergic coding of uncertainty was interpreted to correspond to attention-based learning. Therefore, it might be speculated that the differences between our and Figee et al.'s findings trace back to a nonselective form of attention or arousal designed to aid the learning of predictive stimuli and actions (Fiorillo et al., 2003), which was triggered in Figee et al.'s task design and attenuated in patients. Although we found no evidence for decreased BOLD activity in the dorsal or ventral striatum our patients showed more delayed responses for gain stimuli as indicated by the significant group by reinforcement interaction. On the behavioral level, this is in some accordance with Figee et al.'s finding showing significantly slower responses of patients during reward anticipation.
Our results are not in agreement with those of Jung et al. (2011) insofar as they reported reduced activation in the lateral prefrontal cortex and increased activity in the anterior insula of the patient group during loss anticipation. As the authors did not report response times broken down by conditions it is difficult to fully evaluate their findings, because the possibility of differences in the neutral condition between patients and controls cannot be ruled out. Taken together, evidence is not conclusive so far as to whether the ventral and the dorsal striatum show aberrant activations during anticipation of reinforcement. The present study showed no evidence for disease-related activation changes in the striatum during reinforcement learning.
4.2.3. Medial prefrontal brain activation to anticipated reward and loss
We observed a group by condition (anticipation of gain versus loss) interaction localized in a medial frontal/cingulate region. Patients showed less BOLD activity in this region during anticipation of reward and more after loss-indicating cues. Thus, the mentioned region appears to be involved in disorder-related changes of sensitivity for reward and punishment. The medial frontal region partly corresponds to the supplementary motor area (SMA-proper) and the pre-SMA, respectively (Roland and Zilles, 1996). The pre-SMA lies rostral to the SMA-proper and is sometimes considered as being part of the anterior cingulate cortex (Knutson et al., 2000). The SMA is implicated in specific motor events (Tanji, 1994) but has also been shown to mediate the sense of an impending movement without any overt motor event (Fried et al., 1991). The pre-SMA is involved in the preparation of actions and has tight connections to dorsolateral prefrontal, anterior cingulate and inferior parietal regions (Luppino and Rizzolatti, 2000). Thereby, it also underpins cognitive-affective processes.
We showed previously in a study of cardiovascular arousal and interoceptive awareness that negative feelings correlate with the BOLD response in the dorsal cingulate gyrus extending into the dorsomedial prefrontal cortex in healthy subjects (Pollatos et al., 2007). That region is virtually identical with respect to Talairach coordinates to the region implicated here. Also, other groups described associations of medial frontal and cingulate areas with negative emotions, threat appraisal, response conflict, and detection of unfavorable outcomes, especially in relation to the self (Baliki et al., 2006; Fiddick, 2011; Phan et al., 2005; Shackman et al., 2011). In an extensive review including a quantitative coordinate-based meta-analysis of cingulate cortex findings Shackman et al. (2011) report evidence that the anterior midcingulate cortex (aMCC) implements a domain-general process that is integral to negative affect, pain and cognitive control. The aMCC corresponds closely to our observed cluster involved in the regulation of sensitivity for reward and punishment. According to the adaptive control hypothesis proposed by Shackman et al. (2011) the aMCC uses information about punishment to control aversively motivated actions by integrating signals arriving form subcortical regions (amygdala, striatum) and insula. Accordingly, our results might indicate altered frontostriatothalamic circuitry signaling in OCD patients.
4.2.4. Different processing of motivating consequences in OCD
Although our patients did not report to consciously focus attention away from reward-indicating to loss-indicating cues, they appear to employ a different processing routine. Evaluation of situations implicating the possibility of gaining or losing a reinforcer appears to be associated with activity in the medial frontal/cingulate brain region. It is tempting to speculate that processing of motivating consequences is different in patients: adopting a pessimistic view, possibly reinforcing events may be perceived as indicating threat because patients with OCD overestimate the probability of loss (Obsessive Compulsive Working Group, 2005). Such cognitions might then coactivate brain regions more relevant for threat processing and negative affect. In a sense, there seems to be medial prefrontal involvement for providing additional computing recources, which may partly account for the altered sensitivity for reward. This finding may then represent a top-down mechanism involved in an effort to compensate for inadequate representation of negative feelings, rather than being due to a dysfunctional reward circuitry related bottom-up process. Hence, a different processing scheme of negative feelings could relate to the pessimistic view in patients with OCD concerning the overestimation of the probability of not being rewarded or being able to avoid loss even in overall rewarding situations.
There was no significant correlation with symptom severity within the patient group. Further empirical corroboration is needed because correlations are not sufficiently robust with relatively small sample sizes as used in our study as well as in most current FMRI studies.
4.3. Conclusions
Limitations of this study include the sample size, which does not allow to analyze symptom dimensions with reasonable statistical power. Another limitation is that we analyzed local activations only, without considering connectivity between regions, e.g. of the frontostriatothalamic and limbic circuitry. Therefore, we cannot definitely conclude about possible connectivity alterations during reinforcement learning. Further research should include functional and effective connectivity analyses. Also, studies should systematically vary reward uncertainty and probability, positive and negative incentive valence, and outcome magnitude.
Strengths of the present study are the use of the MID task which is an accepted means to challenge reward circuitry, and the well matched samples including matched behavioral performance.
Altogether, the main findings of this study are
-
a)
increased delayed reactions after gain-indicating and less delayed reactions after loss-indicating cues in patients with OCD, suggesting a bias towards avoidance of aversive stimuli;
-
b)
no significant differences in dorsal and ventral striatal BOLD response during gain or loss anticipation, and
-
c)
a role of the medial frontal/cingulate region mediating altered sensitivity of patients with OCD for the anticipation of money gains or impending money losses. This alteration might be related to cortical processing of negative affect.
Acknowledgements
We are grateful to Eva Kischkel and Rüdiger Spielberg for support with patients recruitment, and to Rainer Kniesche for technical assistance. The authors report no biomedical financial interests or potential conflicts of interests.
Footnotes
This is an open-access article distributed under the terms of the Creative Commons Attribution-NonCommercial-ShareAlike License, which permits non-commercial use, distribution, and reproduction in any medium, provided the original author and source are credited.
Contributor Information
C. Kaufmann, Email: christian.kaufmann@hu-berlin.de.
F. Preuße, Email: franziska.preusse@web.de.
T. Endrass, Email: endrass@hu-berlin.de.
F. Schlagenhauf, Email: schlagenhauf@charite.de.
A. Heinz, Email: andreas.heinz@charite.de.
G. Juckel, Email: georg.juckel@wkp-lwl.org.
N. Kathmann, Email: kathmann@hu-berlin.de.
Appendix A. Supplementary data
Fig. S1: Masks of analyzed voxels.
Fig. S2: BOLD main effects of the MID task for each group separately.
Fig. S3: Interaction of group by condition without patients with comorbid major depression.
Table S1a and b: Yale-Brown Obsessive Compulsive Checklist data.
Table S2: Location of activated clusters for gain and loss versus neutral, and gain versus loss for each group (Fig. S2).
References
- Arias-Carrion O., Stamelou M., Murillo-Rodriguez E., Menendez-Gonzalez M., Poppel E. Dopaminergic reward system: a short integrative review. International Archives of Medicine. 2010;3:24. doi: 10.1186/1755-7682-3-24. [DOI] [PMC free article] [PubMed] [Google Scholar]
- Baliki M.N., Chialvo D.R., Geha P.Y., Levy R.M., Harden R.N., Parrish T.B., Apkarian A.V. Chronic pain and the emotional brain: specific brain activity associated with spontaneous fluctuations of intensity of chronic back pain. The Journal of Neuroscience. 2006;26:12165–12173. doi: 10.1523/JNEUROSCI.3576-06.2006. [DOI] [PMC free article] [PubMed] [Google Scholar]
- Beck A.T., Hautzinger M., Steer R.A. Huber; Bern: 1995. Beck-Depressions-Inventar (BDI) [Google Scholar]
- Berns G.S., McClure S.M., Pagnoni G., Montague P.R. Predictability modulates human brain response to reward. The Journal of Neuroscience. 2001;21:2793. doi: 10.1523/JNEUROSCI.21-08-02793.2001. [DOI] [PMC free article] [PubMed] [Google Scholar]
- Breiter H.C., Aharon I., Kahneman D., Dale A., Shizgal P. Functional imaging of neural responses to expectancy and experience of monetary gains and losses. Neuron. 2001;30:619. doi: 10.1016/s0896-6273(01)00303-8. [DOI] [PubMed] [Google Scholar]
- Carr A.T. Compulsive neurosis: a review of the literature. Psychological Bulletin. 1974;81:311–318. doi: 10.1037/h0036473. [DOI] [PubMed] [Google Scholar]
- Crean J., Richards J.B., de Wit H. Effect of tryptophan depletion on impulsive behavior in men with or without a family history of alcoholism. Behavioural Brain Research. 2002;136:349–357. doi: 10.1016/s0166-4328(02)00132-8. [DOI] [PubMed] [Google Scholar]
- Dalley J.W., Cardinal R.N., Robbins T.W. Prefrontal executive and cognitive functions in rodents: neural and neurochemical substrates. Neuroscience and Biobehavioral Reviews. 2004;28:771–784. doi: 10.1016/j.neubiorev.2004.09.006. [DOI] [PubMed] [Google Scholar]
- Deichmann R. Optimized RF excitation for anatomical brain imaging of the occipital lobe using the 3D MDEFT sequence and a surface transmit coil. Magnetic Resonance in Medicine. 2005;53:1212–1216. doi: 10.1002/mrm.20421. [DOI] [PubMed] [Google Scholar]
- Di Martino A., Scheres A., Margulies D.S., Kelly A.M., Uddin L.Q., Shehzad Z., Biswal B., Walters J.R., Castellanos F.X., Milham M.P. Functional connectivity of human striatum: a resting state FMRI study. Cerebral Cortex. 2008;18:2735–2747. doi: 10.1093/cercor/bhn041. [DOI] [PubMed] [Google Scholar]
- Fiddick L. There is more than the amygdala: potential threat assessment in the cingulate cortex. Neuroscience and Biobehavioral Reviews. 2011;35:1007–1018. doi: 10.1016/j.neubiorev.2010.09.014. [DOI] [PubMed] [Google Scholar]
- Figee M., Vink M., de Geus F., Vulink N., Veltman D.J., Westenberg H., Denys D. Dysfunctional reward circuitry in obsessive–compulsive disorder. Biological Psychiatry. 2011;69:867–874. doi: 10.1016/j.biopsych.2010.12.003. [DOI] [PubMed] [Google Scholar]
- Fiorillo C.D., Tobler P.N., Schultz W. Discrete coding of reward probability and uncertainty by dopamine neurons. Science. 2003;299:1898–1902. doi: 10.1126/science.1077349. [DOI] [PubMed] [Google Scholar]
- Foa E.B., Huppert J.D., Leiberg S., Langner R., Kichic R., Hajcak G., Salkovskis P.M. The obsessive–compulsive inventory: development and validation of a short version. Psychological Assessment. 2002;14:485–496. [PubMed] [Google Scholar]
- Fried I., Katz A., McCarthy G., Sass K.J., Williamson P., Spencer S.S., Spencer D.D. Functional organization of human supplementary motor cortex studied by electrical stimulation. The Journal of Neuroscience. 1991;11:3656–3666. doi: 10.1523/JNEUROSCI.11-11-03656.1991. [DOI] [PMC free article] [PubMed] [Google Scholar]
- Friston K.J., Holmes A.P., Worsley K.J., Poline J.B., Frith C.D., Frackowiak R.S.J. Statisticial parametric maps in functional imaging: a general linear approach. Human Brain Mapping. 1995;2:189–210. [Google Scholar]
- Fuente-Fernandez R., Phillips A.G., Zamburlini M., Sossi V., Calne D.B., Ruth T.J., Stoessl A.J. Dopamine release in human ventral striatum and expectation of reward. Behavioural Brain Research. 2002;136:359. doi: 10.1016/s0166-4328(02)00130-4. [DOI] [PubMed] [Google Scholar]
- Fullana M.A., Mataix-Cols D., Caseras X., Alonso P., Manuel M.J., Vallejo J., Torrubia R. High sensitivity to punishment and low impulsivity in obsessive–compulsive patients with hoarding symptoms. Psychiatry Research. 2004;129:21. doi: 10.1016/j.psychres.2004.02.017. [DOI] [PubMed] [Google Scholar]
- Fullana M.A., Mataix-Cols D., Trujillo J.L., Caseras X., Serrano F., Alonso P., Menchon J.M., Vallejo J., Torrubia R. Personality characteristics in obsessive–compulsive disorder and individuals with subclinical obsessive–compulsive problems. The British Journal of Clinical Psychology. 2004;43:387. doi: 10.1348/0144665042388937. [DOI] [PubMed] [Google Scholar]
- Goodman W.K., Price L.H., Rasmussen S.A., Mazure C., Fleischmann R.L., Hill C.L., Heninger G.R., Charney D.S. The Yale-Brown Obsessive Compulsive Scale. I. Development, use, and reliability. Archives of General Psychiatry. 1989;46:1006–1011. doi: 10.1001/archpsyc.1989.01810110048007. [DOI] [PubMed] [Google Scholar]
- Harrison B.J., Soriano-Mas C., Pujol J., Ortiz H., Lopez-Sola M., Hernandez-Ribas R., Deus J., Alonso P., Yucel M., Pantelis C., Menchon J.M., Cardoner N. Altered corticostriatal functional connectivity in obsessive–compulsive disorder. Archives of General Psychiatry. 2009;66:1189–1200. doi: 10.1001/archgenpsychiatry.2009.152. [DOI] [PubMed] [Google Scholar]
- Heinz A. Neurobiological and anthropological aspects of compulsions and rituals. Pharmacopsychiatry. 1999;32:223–229. doi: 10.1055/s-1999-7959. [DOI] [PubMed] [Google Scholar]
- Ikemoto S., Panksepp J. The role of nucleus accumbens dopamine in motivated behavior: a unifying interpretation with special reference to reward-seeking. Brain Research. Brain Research Reviews. 1999;31:6–41. doi: 10.1016/s0165-0173(99)00023-5. [DOI] [PubMed] [Google Scholar]
- Juckel G., Schlagenhauf F., Koslowski M., Filonov D., Wustenberg T., Villringer A., Knutson B., Kienast T., Gallinat J., Wrase J., Heinz A. Dysfunction of ventral striatal reward prediction in schizophrenic patients treated with typical, not atypical, neuroleptics. Psychopharmacology. 2006;187:222–228. doi: 10.1007/s00213-006-0405-4. [DOI] [PubMed] [Google Scholar]
- Jung W.H., Kang D.H., Han J.Y., Jang J.H., Gu B.M., Choi J.S., Jung M.H., Choi C.H., Kwon J.S. Aberrant ventral striatal responses during incentive processing in unmedicated patients with obsessive–compulsive disorder. Acta Psychiatrica Scandinavica. 2011;123:376–386. doi: 10.1111/j.1600-0447.2010.01659.x. [DOI] [PubMed] [Google Scholar]
- Katerberg H., Delucchi K.L., Stewart S.E., Lochner C., Denys D.A., Stack D.E., Andresen J.M., Grant J.E., Kim S.W., Williams K.A., den Boer J.A., van Balkom A.J., Smit J.H., van Oppen P., Polman A., Jenike M.A., Stein D.J., Mathews C.A., Cath D.C. Symptom dimensions in OCD: item-level factor analysis and heritability estimates. Behavior Genetics. 2010;40:505–517. doi: 10.1007/s10519-010-9339-z. [DOI] [PMC free article] [PubMed] [Google Scholar]
- Kirsch P., Schienle A., Stark R., Sammer G., Blecker C., Walter B., Ott U., Burkart J., Vaitl D. Anticipation of reward in a nonaversive differential conditioning paradigm and the brain reward system: an event-related fMRI study. NeuroImage. 2003;20:1086. doi: 10.1016/S1053-8119(03)00381-1. [DOI] [PubMed] [Google Scholar]
- Knutson B., Westdorp A., Kaiser E., Hommer D. FMRI visualization of brain activity during a monetary incentive delay task. NeuroImage. 2000;12:20–27. doi: 10.1006/nimg.2000.0593. [DOI] [PubMed] [Google Scholar]
- Knutson B., Adams C.M., Fong G.W., Hommer D. Anticipation of increasing monetary reward selectively recruits nucleus accumbens. The Journal of Neuroscience. 2001;21:1–5. doi: 10.1523/JNEUROSCI.21-16-j0002.2001. [DOI] [PMC free article] [PubMed] [Google Scholar]
- Knutson B., Fong G.W., Bennett S.M., Adams C.M., Hommer D. A region of mesial prefrontal cortex tracks monetarily rewarding outcomes: characterization with rapid event-related fMRI. NeuroImage. 2003;18:263–272. doi: 10.1016/s1053-8119(02)00057-5. [DOI] [PubMed] [Google Scholar]
- Knutson B., Bhanji J.P., Cooney R.E., Atlas L.Y., Gotlib I.H. Neural responses to monetary incentives in major depression. Biological Psychiatry. 2008;63:686–692. doi: 10.1016/j.biopsych.2007.07.023. [DOI] [PMC free article] [PubMed] [Google Scholar]
- Lancaster J.L., Woldorff M.G., Parsons L.M., Liotti M., Freitas C.S., Rainey L., Kochunov P.V., Nickerson D., Mikiten S.A., Fox P.T. Automated Talairach atlas labels for functional brain mapping. Human Brain Mapping. 2000;10:120–131. doi: 10.1002/1097-0193(200007)10:3<120::AID-HBM30>3.0.CO;2-8. [DOI] [PMC free article] [PubMed] [Google Scholar]
- Lancaster J.L., Tordesillas-Gutierrez D., Martinez M., Salinas F., Evans A., Zilles K., Mazziotta J.C., Fox P.T. Bias between MNI and Talairach coordinates analyzed using the ICBM-152 brain template. Human Brain Mapping. 2007;28:1194–1205. doi: 10.1002/hbm.20345. [DOI] [PMC free article] [PubMed] [Google Scholar]
- Laux L.G., Schaffner P., Spielberger C.D. Beltz; Weinheim: 1981. Das State-Trait-Angstinventar STAI. [Google Scholar]
- Luppino G., Rizzolatti G. The organization of the Frontal Motor Cortex. News in Physiological Sciences. 2000;15:219–224. doi: 10.1152/physiologyonline.2000.15.5.219. [DOI] [PubMed] [Google Scholar]
- Mataix-Cols D., Wooderson S., Lawrence N., Brammer M.J., Speckens A., Phillips M.L. Distinct neural correlates of washing, checking, and hoarding symptom dimensions in obsessive–compulsive disorder. Archives of General Psychiatry. 2004;61:564–576. doi: 10.1001/archpsyc.61.6.564. [DOI] [PubMed] [Google Scholar]
- Menzies L., Chamberlain S.R., Laird A.R., Thelen S.M., Sahakian B.J., Bullmore E.T. Integrating evidence from neuroimaging and neuropsychological studies of obsessive–compulsive disorder: the orbitofronto-striatal model revisited. Neuroscience and Biobehavioral Reviews. 2008;32:525–549. doi: 10.1016/j.neubiorev.2007.09.005. [DOI] [PMC free article] [PubMed] [Google Scholar]
- Obsessive Compulsive Working Group Psychometric validation of the obsessive belief questionnaire and interpretation of intrusions inventory — Part 2: Factor analyses and testing of a brief version. Behaviour Research and Therapy. 2005:1527–1542. doi: 10.1016/j.brat.2004.07.010. [DOI] [PubMed] [Google Scholar]
- Oldfield R.C. The assessment and analysis of handedness: the Edinburgh inventory. Neuropsychologia. 1971;9:97–113. doi: 10.1016/0028-3932(71)90067-4. [DOI] [PubMed] [Google Scholar]
- Phan K.L., Fitzgerald D.A., Nathan P.J., Moore G.J., Uhde T.W., Tancer M.E. Neural substrates for voluntary suppression of negative affect: a functional magnetic resonance imaging study. Biological Psychiatry. 2005;57:210–219. doi: 10.1016/j.biopsych.2004.10.030. [DOI] [PubMed] [Google Scholar]
- Pollatos O., Schandry R., Auer D.P., Kaufmann C. Brain structures mediating cardiovascular arousal and interoceptive awareness. Brain Research. 2007;1141:178–187. doi: 10.1016/j.brainres.2007.01.026. [DOI] [PubMed] [Google Scholar]
- Roland P.E., Zilles K. Functions and structures of the motor cortices in humans. Current Opinion in Neurobiology. 1996;6:773–781. doi: 10.1016/s0959-4388(96)80027-4. [DOI] [PubMed] [Google Scholar]
- Rotge J.Y., Guehl D., Dilharreguy B., Cuny E., Tignol J., Bioulac B., Allard M., Burbaud P., Aouizerate B. Provocation of obsessive–compulsive symptoms: a quantitative voxel-based meta-analysis of functional neuroimaging studies. Journal of psychiatry & neuroscience: JPN. 2008;33:405–412. [PMC free article] [PubMed] [Google Scholar]
- Salkovskis P.M. Understanding and treating obsessive–compulsive disorder. Behaviour Research and Therapy. 1999;37(Suppl. 1):S29–S52. [PubMed] [Google Scholar]
- Schlagenhauf F., Juckel G., Koslowski M., Kahnt T., Knutson B., Dembler T., Kienast T., Gallinat J., Wrase J., Heinz A. Reward system activation in schizophrenic patients switched from typical neuroleptics to olanzapine. Psychopharmacology. 2008;196:673–684. doi: 10.1007/s00213-007-1016-4. [DOI] [PubMed] [Google Scholar]
- Schmidt K.-H., Metzler P. 1992. Wortschatztest (WST) [Google Scholar]
- Schultz W. Multiple reward signals in the brain. Nature Reviews. Neuroscience. 2000;1:199–207. doi: 10.1038/35044563. [DOI] [PubMed] [Google Scholar]
- Shackman A.J., Salomons T.V., Slagter H.A., Fox A.S., Winter J.J., Davidson R.J. The integration of negative affect, pain and cognitive control in the cingulate cortex. Nature Reviews. Neuroscience. 2011;12:154–167. doi: 10.1038/nrn2994. [DOI] [PMC free article] [PubMed] [Google Scholar]
- Strohle A., Stoy M., Wrase J., Schwarzer S., Schlagenhauf F., Huss M., Hein J., Nedderhut A., Neumann B., Gregor A., Juckel G., Knutson B., Lehmkuhl U., Bauer M., Heinz A. Reward anticipation and outcomes in adult males with attention-deficit/hyperactivity disorder. NeuroImage. 2008;39:966–972. doi: 10.1016/j.neuroimage.2007.09.044. [DOI] [PubMed] [Google Scholar]
- Talairach J., Tornoux P. Georg Thieme; Stuttgart: 1988. Co-planar Stereotaxic Atlas of the Human Brain: 3-Dimensional Proportional System: An Approach to Cerebral Imaging. [Google Scholar]
- Tanji J. The supplementary motor area in the cerebral cortex. Neuroscience Research. 1994;19:251–268. doi: 10.1016/0168-0102(94)90038-8. [DOI] [PubMed] [Google Scholar]
- van den Heuvel O.A., Remijnse P.L., Mataix-Cols D., Vrenken H., Groenewegen H.J., Uylings H.B.M., van Balkom A.J.L.M., Veltman D.J. The major symptom dimensions of obsessive–compulsive disorder are mediated by partially distinct neural systems. Brain. 2009;132:853–868. doi: 10.1093/brain/awn267. [DOI] [PubMed] [Google Scholar]
- Wittchen H.-U., Zaudig M., Fydrich T. Hogrefe; 1997. Strukturiertes Klinisches Interview fuer DSM-IV. [Google Scholar]
- Wrase J., Schlagenhauf F., Kienast T., Wustenberg T., Bermpohl F., Kahnt T., Beck A., Strohle A., Juckel G., Knutson B., Heinz A. Dysfunction of reward processing correlates with alcohol craving in detoxified alcoholics. NeuroImage. 2007;35:787–794. doi: 10.1016/j.neuroimage.2006.11.043. [DOI] [PubMed] [Google Scholar]
- Zald D.H., Boileau I., El-Dearedy W., Gunn R., McGlone F., Dichter G.S., Dagher A. Dopamine transmission in the human striatum during monetary reward tasks. The Journal of Neuroscience. 2004;24:4105–4112. doi: 10.1523/JNEUROSCI.4643-03.2004. [DOI] [PMC free article] [PubMed] [Google Scholar]
- Zink C.F., Pagnoni G., Martin-Skurski M.E., Chappelow J.C., Berns G.S. Human striatal responses to monetary reward depend on saliency. Neuron. 2004;42:509–517. doi: 10.1016/s0896-6273(04)00183-7. [DOI] [PubMed] [Google Scholar]
Associated Data
This section collects any data citations, data availability statements, or supplementary materials included in this article.
Supplementary Materials
Fig. S1: Masks of analyzed voxels.
Fig. S2: BOLD main effects of the MID task for each group separately.
Fig. S3: Interaction of group by condition without patients with comorbid major depression.
Table S1a and b: Yale-Brown Obsessive Compulsive Checklist data.
Table S2: Location of activated clusters for gain and loss versus neutral, and gain versus loss for each group (Fig. S2).