Abstract
Contemporary models of perimetric sensitivity assume probability summation of retinal ganglion cell sensitivities, ignoring cortical processing. To assess the role of cortical processing in perimetric spatial summation, we used a common form of multiple-mechanism spatial vision model in which the stimulus is sampled by receptive fields analogous to those of simple cells in primary visual cortex. Psychophysical threshold was computed by probability summation across the receptive fields. When the receptive fields were nonoriented (like ganglion cells), the spatial summation function had a large nonmonotonic transitional region that was inconsistent with perimetric spatial summation data. When the receptive fields were orientation tuned (like cortical cells), the model was able to give good fits to perimetric spatial summation data. The predictions of the model were evaluated with a masking study, in which noise masks either enlarged the critical area or changed the shape of the spatial summation functions. We conclude that cortical pooling by multiple spatial mechanisms can account for perimetric spatial summation, whereas probability summation across ganglion cells cannot.
Keywords: spatial summation, contrast sensitivity, perimetry, glaucoma, color vision, spatial vision
Introduction
Automated static perimetry is one of the most frequently performed psychophysical tests, in that it is one of the primary diagnostic tools for glaucoma, a major blinding eye disease. Clinical perimetry adopted standardized stimuli 60 years ago: circular luminance increments presented on a uniform photopic background (Goldmann, 1999). Since then, basic vision research has moved on to more complex sinusoidal stimuli produced on computer-controlled displays. Over the past 25 years, basic spatial vision researchers have developed a wide range of models for visual thresholds, which, in general, agree on common features: detection is mediated by cortical processes that vary in spatial and orientation tuning and whose outputs are combined with a nonlinear summation process (Graham, 1989). However, the insights from the past 25 years of basic vision research have not yet been applied to perimetric studies. Models of sensitivity to perimetric stimuli to date have only considered ganglion cell responses (Gardiner, Demirel, & Johnson, 2006; Harwerth et al., 2004). As a result, clinical researchers have expressed great uncertainty about how to compare sensitivities for traditional stimuli versus more complex spatial stimuli and have based comparisons on the dynamic ranges of different devices rather than on visual processing of the stimuli (Spry, Johnson, McKendrick, & Turpin, 2001).
Contemporary perimetric theories analyze effects of varying stimulus size in two different ways. One approach (Garway-Heath, Caprioli, Fitzke, & Hitchings, 2000; Harwerth et al., 2004) uses an empirical equation with a “summation exponent” k, which varies with eccentricity: Sensitivity = cGk, where G is the number of ganglion cell bodies in the region being tested and c and k are free parameters. The other approach (Inui, Mimura, & Kani, 1981; Wilson, 1970) uses Ricco's law for small stimuli (threshold is inversely related to stimulus area) and characterizes the effects of eccentricity in terms of increase in critical diameter (the largest stimulus for which Ricco's law holds). For the first approach, the empirical parameters have no straightforward theoretical interpretation and can vary dramatically depending on how the data are analyzed. For the second approach, there is no standard way of describing the effects of stimulus size for stimuli larger than the critical diameter. Both approaches assume that detection is mediated by ganglion cells, with little role for cortical processing (Gardiner et al., 2006; Glezer, 1965).
The ganglion-cell-based perimetric theories have limited utility for design of improved perimetric stimuli. In earlier studies, we have demonstrated several advantages of using low spatial frequency sinusoids for perimetric testing, including decreased variability without loss of ability to detect glaucomatous defect (Pan, Swanson, & Dul, 2006; Sun, Dul, & Swanson, 2006). These results cannot be explained by models based on detection by retinal ganglion cells. A recent review concluded that the field of perimetry would benefit greatly from better theoretical underpinnings (Anderson, 2006). At this point, a bridge is needed to connect the gap between the ganglion-cell-based approach that perimetric researchers use and the cortical-processing approach that has been used in basic spatial vision for decades.
The purpose of this study was to provide improved theoretical underpinnings through quantitative modeling of spatial summation for conventional perimetric stimuli—circular luminance increments. Our results are consistent with the critical diameter being determined by the peak spatial frequency of the cortical processes mediating detection rather than by the ganglion cell receptive field centers. The summation exponent is interpreted as reflecting the difference between stimulus size and peak spatial frequency, rather than as a pooling exponent for ganglion cell number. The results of the model provide a good description for normative spatial summation data from a wide range of perimetric studies. A masking experiment showed an example of revealing responses to perimetric types of stimuli by mechanisms tuned to low spatial frequencies.
Part I. A model of spatial summation for circular increments
Methods
The model is a typical form of multiple-mechanism model for spatial vision (Graham, 1989), which assumes that the stimulus is sampled by an ensemble of spatial filters that are each characterized by their receptive field structure. A single filter is an array of filter-elements that all have the same receptive field structure (the “filter kernel”) and are centered at different locations in visual space. The model simulation was for retinal regions outside the fovea; thus, it was assumed that nearby filter-elements have similar spatial and temporal features. Sensitivity of a spatial mechanism was then computed with probability summation across spatial filters that are tuned to different orientations but to the same spatial frequency. In a degenerate form of spatial vision model, a single spatial mechanism with circularly symmetric filters was used to represent a ganglion-cell-based model.
Stimulus
Circular stimuli were used, with stimulus area that varied from –3.0 to +2.0 log deg2 (0.025° to 5.64° in diameter) in steps of 0.1 log unit.
Spatial filters and filter-elements
The filter-elements are analogous to populations of cortical neurons, and the sensitivity of each filter-element was computed by multiplying the stimulus by the receptive field.
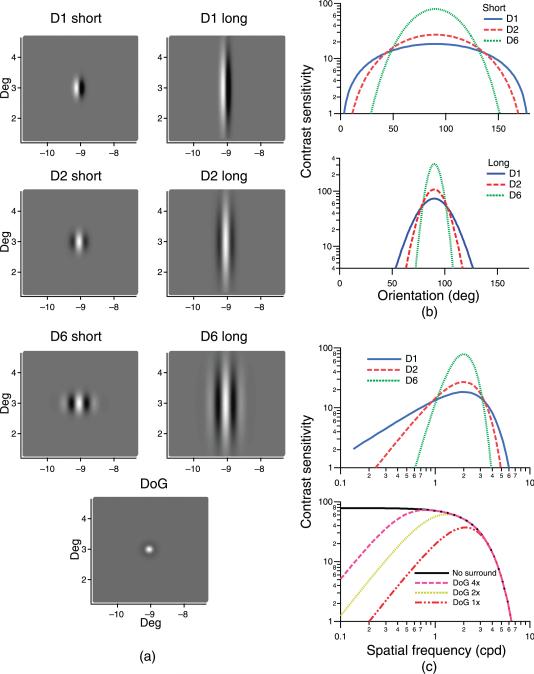
The filters were distinguished in terms of peak spatial frequency, spatial phase, spatial bandwidth, and orientation tuning of their receptive fields. Figure 1 shows receptive fields of the various types of spatial filters used in the model, together with their spatial-tuning and orientation-tuning functions. Bandwidths are summarized in Table 1.
Figure 1.
(a) Two-dimensional images of the receptive fields for the different spatial filters. (b) Orientation-tuning functions for the weakly orientation-tuned (upper) and the strongly orientation-tuned (lower) filter-elements. (c). Spatial-tuning functions for the DN filter-elements (upper) and the DoG filter-elements with a range of surround strengths (lower).
Table 1.
Spatial filter characteristics and the spatial summation parameters from the predicted spatial summation functions for different spatial filters.
| Spatial filters | Spatial bandwidth (octaves) | Orientation bandwidth (deg) | Space constant of the orthogonal Gaussian (deg) | Log critical area (log deg2)/critical diameter (deg) | Extended slope |
|---|---|---|---|---|---|
| D1 long | 2.6 | 34 | 0.11 | –1.6/0.18 | 0.15 |
| D1 short | 2.6 | 120 | 0.45 | –1.6/0.18 | 0.13 |
| D2 long | 1.8 | 24 | 0.16 | –1.5/0.19 | 0.19 |
| D2 short | 1.8 | 90 | 0.64 | –1.6/0.18 | 0.13 |
| D6 long | 1.0 | 14 | 0.28 | –1.4/0.23 | 0.24 |
| D6 short | 1.0 | 54 | 1.10 | –1.5/0.20 | 0.15 |
| DoG 4× | 1.9 | – | – | –1.6/0.18 | 0.13 |
| DoG 2× | 2.4 | – | – | –1.7/0.16 | 0.11 |
| DoG 1× | 3.2 | – | – | –1.7/0.16 | 0.11 |
| Gaussian no surround | Low pass | – | – | –1.6/0.18 | 0.27 |
Two main classes of filters were used. The ganglion-cell-based model used circularly symmetric Differences of Gaussians (DoG) filters. The width of the inhibitory surround of the DoG filters was varied to produce filters with four different spatial bandwidths ranging from low pass (no inhibitory surround) to 1.9 octaves. Cortical filters were represented by DN filters: Nth derivatives of Gaussian windowed by an orthogonal Gaussian, which provide both sine-phase and cosine-phase filters that integrate to zero and have a small number of zero crossings (and, therefore, only a few excitatory and inhibitory regions). The DN filters were orientation selective. More details on the choice of spatial filters can be found in Swanson, Felius, and Pan (2004). Quantitative expression for DN filter kernels is given in Swanson, Wilson, and Giese (1984).
For a given filter, the filter-element locations were arranged in hexagonal arrays centered on the stimulus. We have justified the use of a single-filter orientation in the Appendix. Generally speaking, because the stimuli were circular and the grid of filters was centered on the stimulus, increasing the number of filter orientations shifted the predicted spatial summation function vertically but had minimal impact on the shape of the function. Primary calculations were for filters with a peak spatial frequency of 2 cycles per degree (cpd), and filter-element center-to-center spacing was 0.125° (i.e., the centers of the six nearest filter-elements were 0.125° from the center of a given filter-element) to yield four filter-elements per spatial cycle. Secondary calculations showed that further decrease in spacing of the filter-elements had minimal effect on the results. When modeling responses of mechanisms tuned to other spatial frequencies, filter-element spacing was also set to four filter-elements per spatial cycle.
Spatial probability summation
Psychophysical sensitivity of a filter was computed by probability summation across the sensitivities of the filter-elements, using Minkowski (vector) summation with an exponent of 4.0. This exponent was originally suggested by Quick (1974), consistent with contrast sensitivity increasing as the fourth root of stimulus area for gratings outside the parafovea (Robson & Graham, 1981) as well as for varying numbers of Gabors at different locations (Meese & Williams, 2000). An exponent of 4 is also consistent with effects of channel uncertainty for a fixed attentional field and minimal multiplicative noise (Tyler & Chen, 2000). Perimetric stimuli are presented throughout the central visual field; hence, the attentional field is greater than 1,500 deg2. Multiplicative noise from eye movements should be minimal because the stimuli are briefly flashed.
Analysis
Spatial summation functions for different spatial filters were characterized in terms of three aspects: critical area, transitional region, and extended slope. Critical area was defined as the largest stimulus area for which sensitivity remained within 0.1 log unit of Ricco's law (sensitivity increases linearly with stimulus area). Extended slope was defined as the slope of the best fit line for stimuli with areas at least 1 log unit larger than the critical area. The transitional region was the section of the function between the critical area and the extended slope.
The model was implemented with Igor Pro software (versions 4.01 through 5.02, Wavemetrics, Inc., Lake Oswego, OR) on Macintosh G4 and G5 computers (Apple Computers, Cupertino, CA).
Results
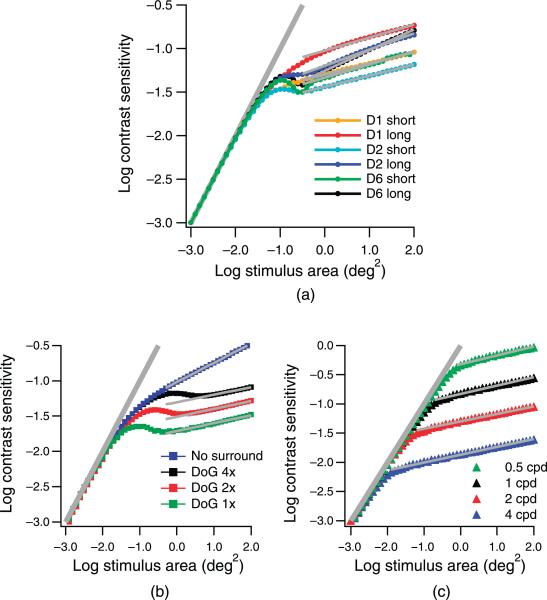
Figure 2 shows predicted spatial summation functions for the different spatial filters whose receptive fields are represented in Figure 1 for primary calculations with a peak spatial frequency of 2.0 cpd (Figures 2a and 2b) and for secondary calculations with a 3-octave range of peak spatial frequencies (Figure 2c). Critical area and extended slope are listed in Table 1. Sensitivities were normalized to be equal at the smallest stimulus area to compare the shapes of different spatial summation functions. For all mechanisms, Ricco's law was obtained for small stimuli (line with a slope of 1). For the primary calculations, the critical area was similar for many different filters having the same peak spatial frequency, varying from –1.6 to –1.7 log deg2 for the DoG filters and from –1.4 to –1.6 log deg2 for the DN filters. Critical area increased systematically as peak spatial frequency was decreased, as shown in Figure 2c. The critical area increased by 1.8 log unit as peak spatial frequency decreased from 4.0 to 0.5 cpd, corresponding to a linear relation between peak spatial frequency and square root of the critical area. The extended slope varied from 0.11 to 0.13 for DoG filters and from 0.13 to 0.24 for DN filters. Critical area and extended slope were greatest for the mechanism whose filter-elements had the narrowest orientation and spatial frequency bandwidths (long D6 receptive fields).
Figure 2.
Simulated spatial summation functions for single spatial mechanisms with the 2 cpd DN filters (a), 2 cpd DoG filters (b), and the weakly orientation-tuned D1 filters with four different peak spatial frequencies (c). Sensitivities for the smallest stimulus were normalized to –3.0. The functions could be described by a line with a slope of 1 for small stimuli and with lines of varying slopes for large stimuli.
For most of the primary calculations, the transitional region was nonmonotonic, in that sensitivity reached a local maximum near the critical area and then showed a moderate decline before increasing again with the extended slope. The only monotonic functions were for the D1 filters (whose receptive field has a single zero crossing) and the Gaussian filters with no inhibitory surround.
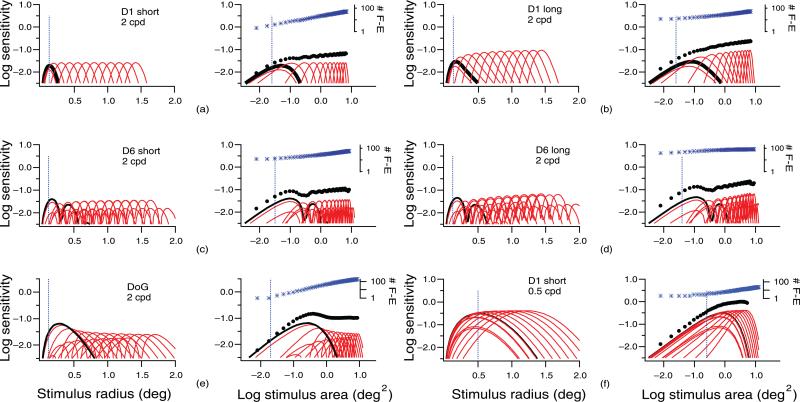
To interpret the predicted spatial summation functions, we show tuning functions for individual filter-elements as log sensitivity versus stimulus radius in the left column in each panel of Figure 3. For stimuli smaller than the critical area (thin vertical line), the filter-elements with the highest sensitivity were centered on the stimulus, whereas for large stimuli, the filter-elements with the highest sensitivity were centered near the edge of the stimulus. The right column in each panel of Figure 3 shows the tuning functions from the left panel replotted as log sensitivity versus log stimulus area, with each tuning function scaled vertically to incorporate the effects of probability summation across multiple filter-elements at the same offset. At the top of each graph, the number of filter-elements contributing to detection is shown, which is defined as the smallest number of filter-elements over which probability summation produced sensitivity within 0.01 log unit of the sensitivity obtained when all filter-elements were included. The number of filter-elements mediating detection increased with stimulus size, with greater rate of increase for filters with broader orientation and spatial bandwidths. The greatest rate of increase was with the circular DoG filters.
Figure 3.
The left column in each panel shows log sensitivity versus stimulus radius for individual filter-elements at different offsets from the stimulus center. The black curve shows the tuning function for the filter-element centered on the stimulus. The dashed vertical line indicates the stimulus radius corresponding to 1/2 cycle of the peak spatial frequency. The right column in each panel shows reconstructed spatial summation functions for single mechanisms with filter-element (F-E) tuning functions scaled vertically to represent effects of probability summation; at the top of each figure, the asterisks show the number of filter-elements responding to each stimulus size. The filled circles are the probabilistic sums of the sensitivities of the filter-elements. The black curve shows the function for the filter-element centered on the stimulus. The dashed vertical line indicates the critical area. See text for details.
The effects of filter characteristics on spatial summation functions (illustrated in Figure 2 and Table 1) can be readily interpreted in terms of the effects of filter location on the heights of the tuning curves and on the numbers of filter-elements mediating detection (illustrated in Figure 3). Ricco's law reflects detection by filter-elements centered on stimuli with diameters smaller than the width of the receptive field center, and the critical area reflects the stimulus size at which the response of these filter-elements stops increasing linearly. The extended slope reflects detection by filter-elements centered near the edge of the stimulus, where probability summation results in sensitivity increasing with the fourth root of the number of filter-elements mediating detection. The transitional region represents the transition to sensitivity being mediated by filter-elements offset from stimulus center. The heights of the tuning functions for these filter-elements are usually lower than those for the filter-elements centered on the stimulus, except for filter-elements with a single zero crossing (D1). Therefore, in the transitional region, the sensitivity of a filter usually shows a slight decline until the increase in number of filter-elements offsets the decline in peak of the tuning functions.
Empirical template
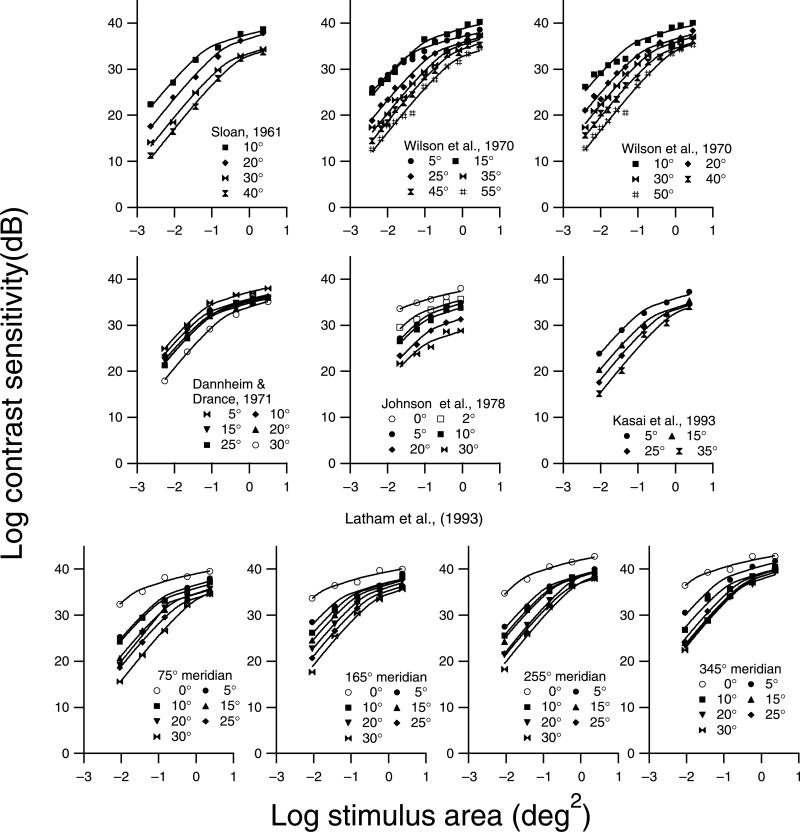
The strongly oriented D1 filters yielded spatial summation functions similar to perimetric data. Therefore, we used this spatial summation function as an empirical template for analyzing perimetric spatial summation data, scaling it horizontally by varying critical area and scaling it vertically by varying sensitivity at the critical area. For a given spatial summation function, the template was derived from filter-elements that were identical in sensitivity and in spatial and orientation tuning. Across different spatial summation functions, the only two parameters that varied were the peak spatial frequency and the peak sensitivity of the filter. The suitability of the template was evaluated by fitting 59 data sets from six classic perimetric studies of spatial summation in normal eyes (Dannheim & Drance, 1971; Johnson, Keltner, & Balestrery, 1978; Kasai, Takahashi, Koyama, & Kitahara, 1993; Latham, Whitaker, Wild, & Elliott, 1993; Sloan, 1961; Wilson, 1970), as shown in Figure 4. We used decibel rather than log units in this figure to be consistent with the units used in perimetry, where 1 dB is equal to 0.1 log unit. For each data set, the two parameters were varied independently. The empirical template accounted for at least 97% of the variance in perimetric sensitivity for 50 of the data sets and at least 90% in the remaining data sets.
Figure 4.
Spatial summation data from the literature, fit with the empirical template. Data gathered at different retinal eccentricities are represented with different symbols. Parameters for the fits are shown in Figure 9.
Ganglion cells versus cortical pooling
The predictions in Figures 2 and 3 are for single spatial mechanisms, where all filter-elements have the same peak spatial frequency and where the shape of the spatial summation function is determined by the properties of the receptive field (e.g., orientation and spatial bandwidths, number of zero crossings). Unlike most of the computed spatial summation functions, perimetric spatial summation functions appear to have a monotonic transitional region and an extended slope of 0.25. Only the strongly oriented D1 filters yielded similar properties. The DoG filters and the rest of the DN filters all yielded nonmonotonic transitional regions and shallow extended slopes and are not consistent with perimetric data. Therefore, these initial comparisons between single-mechanism models and perimetric data are consistent with a cortical-processing approach but not with ganglion-cell-based models.
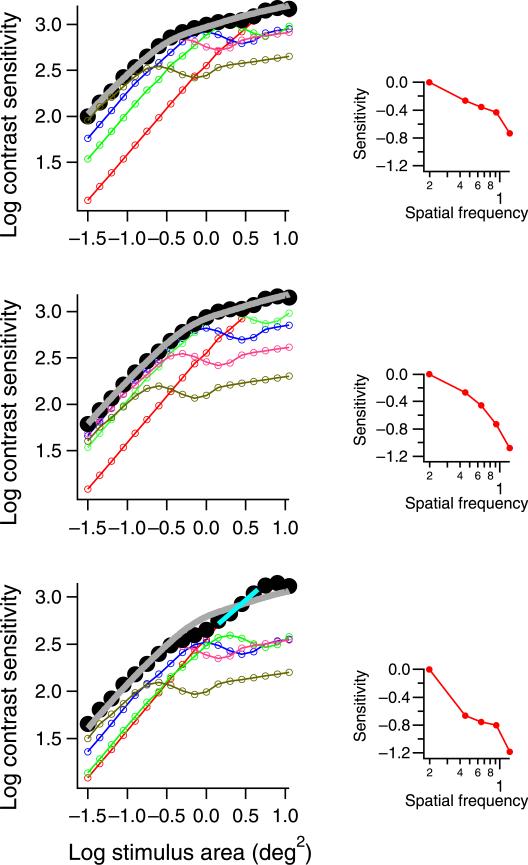
If we assume that detection is mediated by multiple mechanisms tuned to different spatial frequencies, then perimetric spatial summation data are consistent with a wide range of spatial and orientation bandwidths for the filter-elements. Figure 5 shows examples of this approach, where the shape of the spatial summation function is determined by the relative sensitivities of the spatial filters rather than by the form used for the receptive fields. In this example, there are five different spatial filters, with peak spatial frequencies from 0.2 to 1.25 cpd (insets). As with the single-mechanism predictions, Ricco's law for small stimuli is found when the most sensitive filter-elements are those with peaks near the center of the stimulus, and shallower extended slopes for large stimuli are found when detection is mediated by filter-elements centered near the edge of the stimulus.
Figure 5.
Examples of multiple-mechanism models. The colored curves show spatial summation functions for individual spatial mechanisms. The inset shows the peak sensitivity for each of the five spatial mechanisms used in each figure. The filled circles represent psychophysical spatial summation, which is the probabilistic sum of the five underlying spatial mechanisms and is fit with the empirical template. A short blue line in the bottom panel marks complete summation for a mechanism tuned to low spatial frequencies, which is revealed due to reduction in sensitivity of mechanisms tuned to higher spatial frequencies. This example shows results for mechanisms whose filter-elements have identical phase (cosine), spatial bandwidth (1.0 octave), and orientation tuning and vary only in peak spatial frequency (0.20, 0.45, 0.65, 0.9, and 1.25 cpd) and relative sensitivity (insets).
The top graph shows a good reproduction of the empirical function, with a small critical area. The middle graph shows a good reproduction of the empirical function, with a 0.3 log unit larger critical area achieved by a 0.3 log unit decrease in sensitivity of the two mechanisms tuned to the highest spatial frequencies and a 0.1 log unit decrease in sensitivity of a mechanism tuned to intermediate spatial frequencies. The lower graph shows failure to reproduce the empirical function, with a second region of complete summation beyond the critical area, produced by a 0.4 log unit decrease in sensitivity of all mechanisms except for the mechanism tuned to the lowest spatial frequencies. These graphs illustrate how masking could increase the critical area and/or change the shape of the spatial summation by reducing sensitivities of the spatial filters tuned to higher spatial frequencies.
Minkowski exponent
The primary calculations used an exponent of 4.0 for the vector sum. Some researchers have obtained values of 2 to 3 for the Minkowski exponent in the fovea, where sensitivity can decrease rapidly with offset from fixation and where models can assume that the subject has a small attentional aperture (Watson & Ahumada, 2005). The use of a foveal aperture is inappropriate for perimetry, where the attentional field is large and primarily outside the fovea. Nonetheless, to demonstrate the role of the Minkowski exponent, we performed secondary calculations using Minkowski exponents of 2 and 3.
We found that reducing the Minkowski exponent had little impact on the results and had effects that were similar to increasing the spatial bandwidth or the decreasing orientation bandwidth: larger critical diameter, smoother transitional region, and steeper extended slope. With a Minkowski exponent of 2, the empirical template was obtained with a D1 filter having an orientation bandwidth of 54° rather than 14°.
Evaluation
Classical perimetric spatial summation data for circular increments can be described well by an empirical template, with only vertical and horizontal scaling. The empirical template is compatible with detection by multiple mechanisms tuned to different spatial frequencies as well as with detection by a single mechanism composed of highly oriented filters with only one zero crossing. However, the template is not compatible with contemporary perimetric models that ignore cortical processing and assume probability summation of ganglion cell responses (Gardiner et al., 2006; Harwerth et al., 2004).
Classic perimetric spatial summation functions cannot distinguish whether detection is mediated by more than one mechanism. In the following experiment, we used masking to look for evidence of multiple mechanisms. If detection is mediated by a single mechanism, then the mask should shift the spatial summation functions vertically, decreasing sensitivity equally for all stimulus sizes. In contrast, when multiple spatial mechanisms mediate detection, then spatial masks have the potential to also shift the functions horizontally (change the critical area) and/or to change the shape of the spatial summation function, as demonstrated in Figure 5. Detection of perimetric stimuli by multiple spatial mechanisms is consistent with visual processing at the level of the cortex rather than at the level of the retinal ganglion cells.
Part II. Effects of masks on spatial summation for luminance and chromatic increments
Methods
Subjects
Two experienced psychophysical observers (the authors) participated in this experiment. The observers were free of known eye disease and had corrected visual acuity of 20/20 or better, as well as normal performance on monocular testing with the Ishihara and SPP-II plate tests under standard illuminant C. The study was approved by the SUNY State College of Optometry Institutional Review Board.
Apparatus
Stimuli were displayed on a 21-in. SONY Trinitron F500 CRT monitor driven by a VSG2/5 video controller (Cambridge Research Systems, Cambridge, UK). The resolution of the monitor was set to 800 × 600 pixels, with a 150-Hz frame rate. Each phosphor was controlled with 15-bit precision, and gamma correction was obtained with the OptiCal system provided by Cambridge Research Systems. The monitor image subtended 27° × 20° at a viewing distance of 85 cm.
The spectral profiles of the phosphors were measured with a Photo Research PR-704 spectroradiometer (Photo Research Inc., Chatsworth, CA) and used to compute cone contrasts for chromatic increments. Cone contrast calculations were performed with the Smith–Pokorny cone fundamentals with macular pigment removed (DeMarco, Pokorny, & Smith, 1992; Smith & Pokorny, 1975), as was determination of equal energy white (EEW) for the background. The calculations accounted for the difference in V(λ) functions used by the spectroradiometer (CIE 1931) and by Smith and Pokorny cone fundamentals (Judd, revised 1951).
Stimulus
Circular stimuli were presented as luminance or chromatic increments of 500 ms duration, with diameters ranging from 0.25° to 5.7° in half-octave or quarter-octave steps. Stimuli were increments from an EEW point in cone excitation space (Smith & Pokorny, 1996), along either the luminance axis or the equiluminant L–M chromatic axis (where L and M represent spectral sensitivities of the long- and middle-wavelength cone photopigments, respectively).
Data were gathered either on a uniform background or on a background filled with a two-dimensional static noise mask. The mask was composed of fine adjoining squares. For the luminance stimuli, the squares of the mask were 2 arcmin on a side and were randomly assigned to either 74 or 26 cd/m2 along the luminance axis to give a luminance contrast of 48%. For the chromatic stimuli, the squares of the mask were modulated along the equiluminant L–M axis. The chromaticity of each square was set to either (0.59, 2.08) or (0.70, 2.08) in the Boynton–Kambe cone excitation space (computed without macular pigment) to give a mean equal to the EEW (0.64, 2.08) and an L-cone contrast of 17%. The squares of the chromatic mask were 6 arcmin on a side because smaller squares produced minimal threshold elevation; this is consistent with the L–M chromatic mechanisms being less sensitive to higher spatial frequencies (Anderson, Mullen, & Hess, 1991; Kelly, 1983; Losada & Mullen, 1994). In all cases, the mean chromaticity was EEW and the mean luminance was 50 cd/m2.
Procedures
Subjects were asked to look at a fixation point at the (–9°, 3°) location relative to the center of the monitor and to respond to a stimulus presented at the center of the monitor (9.5° eccentricity). This testing location was selected because it is used in conventional perimetric testing, it is far enough from the fovea that spatial scale should have minimal change over a small area, and it is close enough to the fovea that foveal refractive correction should be adequate. A temporal two-alternative forced-choice paradigm was used to measure thresholds. In each trial, the stimulus appeared randomly in one of two temporal intervals each signaled by a tone. The subject's task was to indicate in which interval the target appeared. Each threshold was determined with a two-down, one-up staircase (Wetherill & Levitt, 1965) that terminated after 12 reversals. The increment was varied in steps of 0.3 log unit for the first two reversals and thereafter in steps of 0.15 log unit. Thresholds were estimated with a maximum-likelihood method (Swanson & Birch, 1992). Data were discarded if the false-negative rate was greater than 0.04 or if the difference between thresholds determined by the maximum-likelihood method and by the mean of the last 10 reversals was greater than 0.15 log unit. Each threshold was measured two or more times on different days. If the difference between the first two estimates was less than 0.15 log unit, the average of the two estimates was used for data analysis. Otherwise, two to three more thresholds were measured and the median of all the estimates was used for data analysis. To evaluate the effectiveness of this approach, we computed the standard error of the mean of reversals by pooling all but the first two reversals in all staircases for each condition. The SEMs of reversals were always smaller than 0.06 log unit, and symbol size for all figures is greater than ±1 SEM.
Data analysis
We tested the hypothesis that masking effects would decline as stimulus size increased. For both overlay and surround masking, suppression is greater when test and mask have similar spatial and orientation properties (Legge & Foley, 1980; Petrov, Carandini, & McKee, 2005). The masks had a fixed visual extent of 540 deg2 and were composed of fine square pixels so that the mask would primarily stimulate filter-elements tuned to high spatial frequencies. A filter-element with a peak spatial frequency of 0.5 cpd would have a receptive field as wide as at least 60 squares of the luminance mask, which is a sampling density sufficient enough that each filter-element would give a response similar to that for a uniform field. In contrast, a filter-element with a peak spatial frequency of 5 cpd could have a width of as few as 6 squares, which is a low-enough sampling that many of the filter-elements would have responses substantially different from that for a uniform field. Because substantial masking can still occur across spatial frequencies (Meese & Hess, 2004), we tested the simple hypothesis that masking effects would decrease with stimulus size to avoid any artifact from a generalized masking effect.
The first analysis was linear regression on threshold elevation versus stimulus size. Threshold elevation was defined as the difference in log contrast sensitivities on the uniform background and in the presence of the mask. A one-tailed test was used to determine the probability that the slope was less than zero. The primary prediction was that linear regression would yield negative slopes for all four data sets. A probability value of .01 for this prediction corresponds to a p value of .316 for any individual regression, which corresponds to a z score of –0.48. The secondary prediction was that some of the data sets would have negative slopes, whereas others would not, which could occur if not all masks had the same effect. Including a Bonferonni correction for four tests, we required a significance of p < .0125 for each slope.
The second analysis was on the fits of the empirical template to the spatial summation functions with and without the masks. If only a single filter mediated detection for all stimulus sizes, then the masks could shift the template vertically but would not change the critical area. If detection was mediated by multiple mechanisms, then the masks could increase the critical area, as illustrated in Figure 5. Therefore, the critical areas with and without the mask were compared in terms of the confidence limits for the fit of the empirical template, using a one-tailed test to determine whether critical area was larger when the mask was present. As with the evaluation of threshold elevations, the primary prediction was that all four data sets would show increased critical area (z score greater than 0.48) and the secondary prediction was that only some of the data sets would show increased critical areas (at p < .0125).
Detection by multiple spatial mechanisms can also lead to the shape of the spatial summation function deviating systematically from the empirical template, as illustrated in Figure 5. To further evaluate this possibility, we examined the residuals of the fits of the empirical function for spatial summation data with and without the mask.
Results
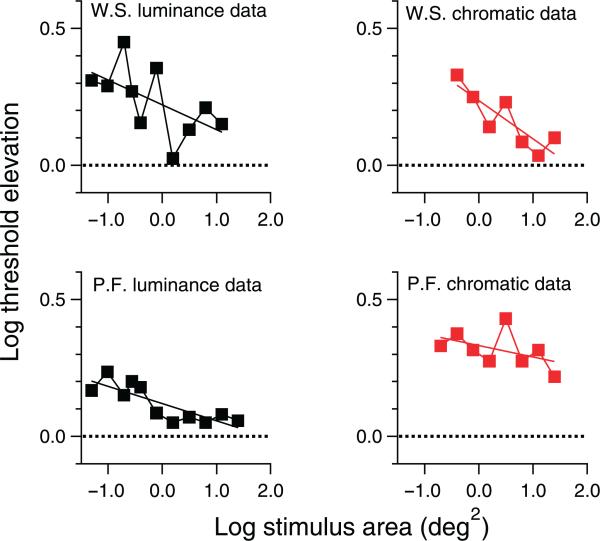
Threshold elevation curves are shown in Figure 6. Linear regression confirmed the primary prediction of negative slopes for all four data sets (z < –1.3, p < .0001), and for secondary predictions, slopes for two of the data sets reached statistical significance (chromatic data for subject W.S. and luminance data for subject P.F.).
Figure 6.
Threshold elevation functions and results of linear regression.
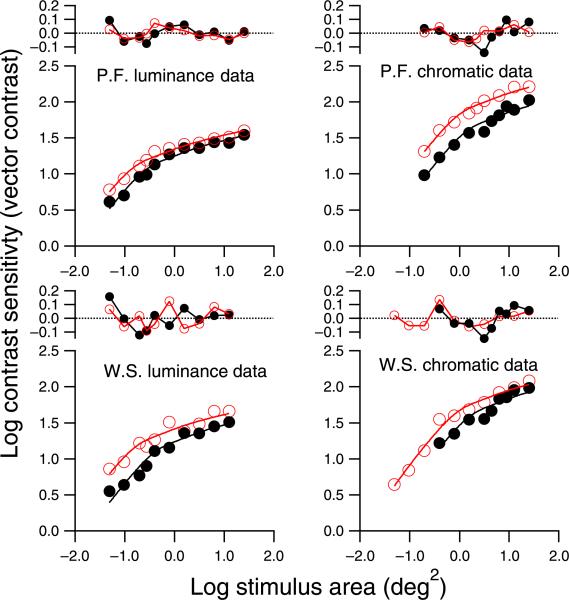
The spatial summation data from which threshold elevations were derived are shown in Figure 7, along with fits of the empirical template; critical areas from these fits are given in Table 2. For all four conditions, critical area increased by more than 1 SD of the parameter estimate when the mask was present, confirming the primary prediction. The amount of increase ranged from 0.15 log unit to 0.38 log unit, and for secondary predictions (increase by more than 2.24 SD), the increase in critical area only reached statistical significance for the luminance data (both subjects).
Figure 7.
Spatial summation functions in Part II, fit with the empirical template. Black curves and filled circles show data with the mask; red curves and open circles show data with the uniform background. The function at the top of each spatial summation figure shows residuals for the fit.
Table 2.
Critical areas estimated for the psychophysical spatial summation data gathered in Part II. For all four conditions, critical areas were larger when the noise mask was present.
| W.S., critical area (log deg2)/diameter (deg) | P.F., critical area (log deg2)/diameter (deg) | |
|---|---|---|
| Luminance | –1.21/0.28 | –1.24/0.27 |
| Luminance with mask | –0.85/0.42 | –1.00/0.35 |
| Difference | 0.36/0.14 | 0.24/0.08 |
| Chromatic | –0.53/0.61 | –0.43/0.69 |
| Chromatic with mask | –0.24/0.86 | –0.28/0.81 |
| Difference | 0.29/0.25 | 0.15/0.12 |
Figure 7 also shows the residuals for the fits of the empirical template. The residuals appear to be random variations for most of the data sets. However, for the chromatic stimuli with the mask present, the residual functions for both subjects show a similar trend: The fitting functions tend to overestimate sensitivity at intermediate stimulus sizes and underestimate sensitivity at large stimulus sizes.
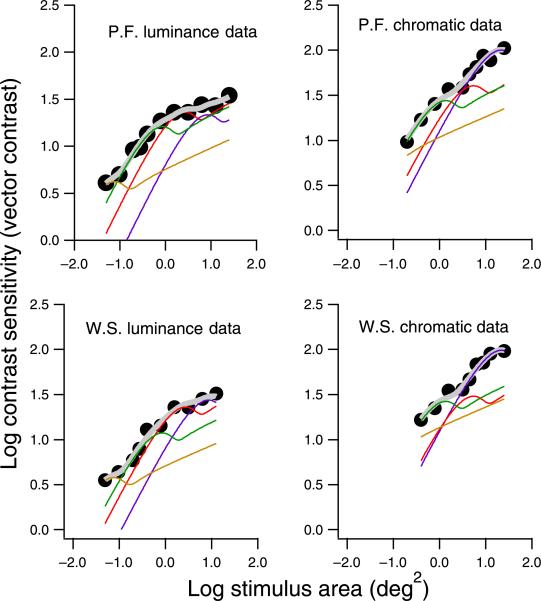
The negative slopes for the threshold elevation functions, the larger critical areas when the masks were present, and the systematic deviations from the best fit for chromatic stimuli in the presence of the mask are all inconsistent with a single mechanism mediating detection at all stimulus sizes. To illustrate how multiple mechanisms can account for the effects of spatial masks, we used a four-mechanism model to fit the data gathered in the presence of the mask, as shown in Figure 8. The spatial summation functions for individual mechanisms (thin colored curves) were derived using spatial mechanisms similar to those used in Figure 5. The thick curves show results of probability summation across the four underlying mechanisms. This example uses mechanisms whose spatial summation functions have nonmonotonic transitional regions, yet it produces monotonic increases in sensitivity because if one mechanism begins to decline in sensitivity, then a mechanism tuned to lower spatial frequencies mediates detection. The systematic deviations from the best fit for the chromatic stimuli can be accounted for by suppression of mechanisms tuned to intermediate spatial frequencies and a region of complete summation beyond Ricco's area that represents detection by a mechanism tuned to low spatial frequencies.
Figure 8.
The spatial summation data in the presence of the mask (from Figure 7), refit with multiple mechanisms to illustrate how change of the relative sensitivities of individual spatial mechanisms can contribute to the change of the experimental data. The filled circles are experimental data. The thin colored functions are spatial summation functions for individual mechanisms. The thick curves show results of probability summation across the four underlying mechanisms, as fits to the experimental data.
Discussion
This study analyzed sensitivity to conventional perimetric stimuli with a typical form of model for spatial vision in which the stimulus is sampled by multiple spatial mechanisms tuned to a range of spatial frequencies. A ganglion-cell-based model was also used as a degenerate form of spatial vision model, where there was a single spatial mechanism and where the receptive field of the filter-elements was circularly symmetric. We showed that the ganglion-cell-based model was not consistent with perimetric spatial summation data. We found that the model could fit perimetric data only under two conditions: using either a single mechanism with filter-elements that had just one zero crossing, which was highly oriented, or multiple mechanisms with no constraints on orientation or on number of zero crossings.
The analysis was extended to chromatic stimuli and evaluated the effects of spatial masks on spatial summation. The effects of the masks were to increase the critical area and/or alter the shape of the transitional region, consistent with cortically mediated detection by multiple spatial mechanisms.
The primary motivation for this study was the need for an improved understanding of the responses of the visual system to perimetric stimuli. Our analysis provides a basis for understanding empirical findings about the effect of stimulus size on perimetric sensitivity. When stimulus size is smaller than the critical area, threshold is mediated by receptive fields centered on the stimulus and sensitivity increases linearly with stimulus size. For large stimuli, threshold is mediated by receptive fields centered near the edge of the stimulus and sensitivity increases more slowly with increase in stimulus size. The critical area is determined by the peak spatial frequency of the mechanism mediating the detection of small stimuli.
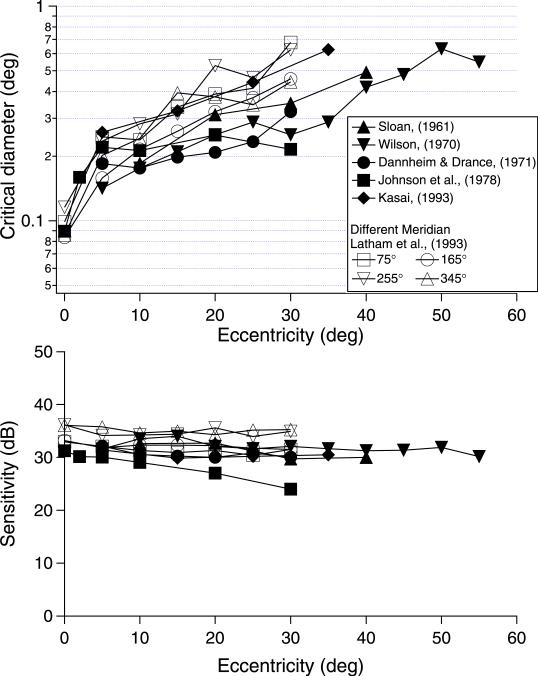
It is well known that the spatial scale of psychophysical mechanisms varies with eccentricity (Watson, 1987); hence, the critical area should increase with eccentricity. To illustrate the effect of change in spatial scale with eccentricity, we show, in the upper panel of Figure 9, critical diameters for fits to perimetric spatial summation data in Figure 4, as well as the perimetric sensitivity at the critical area in the lower panel. For all but one study, critical diameter increased with eccentricity, whereas sensitivity at the critical area showed little change. This is consistent with the primary effect of eccentricity being a change in spatial scale of the mechanisms mediating detection, which is equivalent to spatial summation functions being shifted horizontally with little change in shape or sensitivity.
Figure 9.
Spatial summation parameters for the fits in Figure 4 to classic data from perimetric literature; 1 dB equals 0.1 log unit.
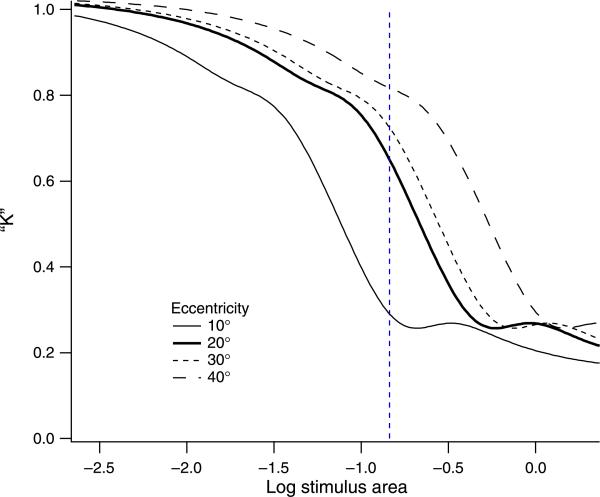
In clinical perimetry, only five stimulus sizes are available, and instead of critical area, the analysis of spatial summation has typically been estimated with a summation coefficient, reported as the slope of a line fit to data (on log–log axes) for a subset of stimulus sizes (Goldmann, 1999; Sloan, 1961). When the summation coefficient is derived from sensitivities for stimulus diameters near the diameter of the standard perimetric stimulus (Goldman Size III, 0.43° diameter), its value increases from 0.2–0.4 in the fovea to 0.6–0.9 at 50° eccentricity (Garway-Heath et al., 2000). Figure 10 shows the summation coefficient derived as the derivatives of the spatial summation functions fit to the data from the classic study of Sloan (1961). For stimulus areas equal to the standard Size III stimulus (vertical dashed line), the summation coefficients in Figure 10 increased from 0.28 at 10° eccentricity to 0.82 at 40° eccentricity. This illustrates that the effect of eccentricity on the empirical summation coefficient can be interpreted as reflecting the use of a fixed stimulus size in the presence of changes in spatial scale of the mechanisms mediating detection.
Figure 10.
Summation coefficients derived from the derivatives of the spatial summation functions in Figure 4, from the classic study by Sloan (1961). The vertical dashed line shows the area of the standard Size III stimulus.
The response of spatial mechanisms in the model was determined by multiplying the stimulus by the receptive fields of spatial filter-elements, representing populations of cortical neurons. This is a common simplification, which does not include the initial stage of retinal processing. We have recently presented a two-stage neural model for detection of perimetric stimuli (Swanson et al., 2004), in which the stimulus is multiplied by ganglion cell receptive fields to compute responses of a ganglion cell array and wherein, thereafter, spatial filter-elements operate on the output of the ganglion cell array. We used this model to recompute the spatial summation functions in Figure 2, and we found minimal change in the functions except when the peak spatial frequency of the spatial filters was very high relative to ganglion cell density that the filter's receptive field was undersampled.
In conclusion, this study showed that cortical pooling by multiple spatial mechanisms can account for perimetric spatial summation, whereas probability summation across ganglion cells cannot.
Acknowledgments
This research was supported by the Graduate Studies Program in Vision Science at SUNY State College of Optometry and NIH Grant EY007716 (Swanson).
Appendix: Effect of filter orientations on the spatial summation functions
When the stimulus is small, the prediction is that detection will be mediated by filter-elements centered on the stimulus, for which orientation has minimal effect on sensitivity. Therefore, probability summation across N filter-elements tuned to different orientations would yield an increase in log sensitivity by log(N)/4, where N is the number of orientations used.
When the stimulus is large, the prediction is that detection will be mediated by filter-elements centered near the edge of the stimulus. For these filter-elements, sensitivity will be greatest when orientation is tangent to the vector from the stimulus center to filter location and will be minimal when orientation is the same as the vector. A single-filter orientation will yield greater sensitivity at some filter-element locations than others, although the offset distance is the same because sensitivity is determined by filter orientation relative to the offset vector. The effect of increasing the number of orientations is that the number of filter-elements with near-optimal orientations is increased. For N different orientations, we would expect log sensitivity to be increased by log(N)/4.
We tested the above analysis by setting N = 4; that is, there were four filters with 45° orientation steps. The test was performed for the whole range of stimulus sizes for the 2 cpd spatial mechanism. For the weakly orientation-tuned D1 and D4 filters, the increase in sensitivity was within 0.007 log unit of the predicted amount of increase. For the strongly orientation-tuned D1 and D4 filters, the increase in sensitivity was within 0.003 log unit. These results validate the use of a single orientation in the model.
Footnotes
Commercial relationships: none.
Contributor Information
Fei Pan, Glaucoma Institute, State University of New York, State College of Optometry, New York, NY, USA.
William H. Swanson, Glaucoma Institute, State University of New York, State College of Optometry, New York, NY, USA
References
- Anderson RS. The psychophysics of glaucoma: Improving the structure/function relationship. Progress in Retinal and Eye Research. 2006;25:79–97. doi: 10.1016/j.preteyeres.2005.06.001. [PubMed] [DOI] [PubMed] [Google Scholar]
- Anderson SJ, Mullen KT, Hess RF. Human peripheral spatial resolution for achromatic and chromatic stimuli: Limits imposed by optical and retinal factors. The Journal of Physiology. 1991;442:47–64. doi: 10.1113/jphysiol.1991.sp018781. [PubMed] [Article] [DOI] [PMC free article] [PubMed] [Google Scholar]
- Dannheim F, Drance SM. Studies of spatial summation of central retinal areas in normal people of all ages. Canadian Journal of Ophthalmology. 1971;6:311–319. [PubMed] [PubMed] [Google Scholar]
- DeMarco P, Pokorny J, Smith VC. Full-spectrum cone sensitivity functions for X-chromosome-linked anomalous trichromats. Journal of the Optical Society of America A, Optics and Image Science. 1992;9:1465–1476. doi: 10.1364/josaa.9.001465. [PubMed] [DOI] [PubMed] [Google Scholar]
- Gardiner SK, Demirel S, Johnson CA. Modeling the sensitivity to variability relationship in perimetry. Vision Research. 2006;46:1732–1745. doi: 10.1016/j.visres.2005.11.019. [PubMed] [DOI] [PubMed] [Google Scholar]
- Garway-Heath DF, Caprioli J, Fitzke FW, Hitchings RA. Scaling the hill of vision: The physiological relationship between light sensitivity and ganglion cell numbers. Investigative Ophthalmology & Visual Science. 2000;41:1774–1782. [PubMed] [Article] [PubMed] [Google Scholar]
- Glezer VD. The receptive fields of the retina. Vision Research. 1965;5:497–525. doi: 10.1016/0042-6989(65)90084-2. [PubMed] [DOI] [PubMed] [Google Scholar]
- Goldmann H. Fundamentals of exact perimetry. Optometry and Vision Science. 1999;1945;76:599–604. doi: 10.1097/00006324-199908000-00030. [PubMed] [DOI] [PubMed] [Google Scholar]
- Graham N. Visual pattern analyzers. Oxford University Press; New York: 1989. [Google Scholar]
- Harwerth RS, Carter-Dawson L, Smith EL, III, Barnes G, Holt WF, Crawford ML. Neural losses correlated with visual losses in clinical perimetry. Investigative Ophthalmology & Visual Science. 2004;45:3152–3160. doi: 10.1167/iovs.04-0227. [PubMed] [Article] [DOI] [PubMed] [Google Scholar]
- Inui T, Mimura O, Kani K. Retinal sensitivity and spatial summation in the foveal and parafoveal regions. Journal of the Optical Society of America. 1981;71:151–163. doi: 10.1364/josa.71.000151. [PubMed] [DOI] [PubMed] [Google Scholar]
- Johnson CA, Keltner JL, Balestrery F. Effects of target size and eccentricity on visual detection and resolution. Vision Research. 1978;18:1217–1222. doi: 10.1016/0042-6989(78)90106-2. [PubMed] [DOI] [PubMed] [Google Scholar]
- Kasai N, Takahashi G, Koyama N, Kitahara K. An analysis of spatial summation using a Humphrey Field Analyzer. In: Mills RP, editor. Perimetry update. Kugler Publications; Amsterdam/New York: 1993. pp. 557–565. [Google Scholar]
- Kelly DH. Spatiotemporal variation of chromatic and achromatic contrast thresholds. Journal of the Optical Society of America. 1983;73:742–750. doi: 10.1364/josa.73.000742. [PubMed] [DOI] [PubMed] [Google Scholar]
- Latham K, Whitaker D, Wild JM, Elliott DB. Magnification perimetry. Investigative Ophthalmology & Visual Science. 1993;34:1691–1701. [PubMed] [PubMed] [Google Scholar]
- Legge GE, Foley JM. Contrast masking in human vision. Journal of the Optical Society of America. 1980;70:1458–1471. doi: 10.1364/josa.70.001458. [PubMed] [DOI] [PubMed] [Google Scholar]
- Losada MA, Mullen KT. The spatial tuning of chromatic mechanisms identified by simultaneous masking. Vision Research. 1994;34:331–341. doi: 10.1016/0042-6989(94)90091-4. [PubMed] [DOI] [PubMed] [Google Scholar]
- Meese TS, Hess RF. Low spatial frequencies are suppressively masked across spatial scale, orientation, field position, and eye of origin. Journal of Vision. 2004;4(10):843–859. doi: 10.1167/4.10.2. http://journalofvision.org/4/10/2/, doi:10.1167/4.10.2. [PubMed] [Article. [DOI] [PubMed] [Google Scholar]
- Meese TS, Williams CB. Probability summation for multiple patches of luminance modulation. Vision Research. 2000;40:2101–2113. doi: 10.1016/s0042-6989(00)00074-2. [PubMed] [DOI] [PubMed] [Google Scholar]
- Pan F, Swanson WH, Dul MW. Evaluation of a two-stage neural model of glaucomatous defect: An approach to reduce test–retest variability. Optometry and Vision Science. 2006;83:499–511. doi: 10.1097/01.opx.0000225091.60457.f4. [PubMed] [DOI] [PMC free article] [PubMed] [Google Scholar]
- Petrov Y, Carandini M, McKee S. Two distinct mechanisms of suppression in human vision. The Journal of Neuroscience. 2005;25:8704–8707. doi: 10.1523/JNEUROSCI.2871-05.2005. [PubMed] [Article] [DOI] [PMC free article] [PubMed] [Google Scholar]
- Quick RF., Jr. A vector-magnitude model of contrast detection. Kybernetik. 1974;16:65–67. doi: 10.1007/BF00271628. [PubMed] [DOI] [PubMed] [Google Scholar]
- Robson JG, Graham N. Probability summation and regional variation in contrast sensitivity across the visual field. Vision Research. 1981;21:409–418. doi: 10.1016/0042-6989(81)90169-3. [PubMed] [DOI] [PubMed] [Google Scholar]
- Sloan LL. Area and luminance of test object as variables in examination of the visual field by projection perimetry. Vision Research. 1961;1:121–138. [Google Scholar]
- Smith VC, Pokorny J. The design and use of a cone chromaticity space: A tutorial. Color Research and Application. 1996;21:375–383. [Google Scholar]
- Smith VC, Pokorny J. Spectral sensitivity of the foveal cone photopigments between 400 and 500 nm. Vision Research. 1975;15:161–171. doi: 10.1016/0042-6989(75)90203-5. [PubMed] [DOI] [PubMed] [Google Scholar]
- Spry PG, Johnson CA, McKendrick AM, Turpin A. Variability components of standard automated perimetry and frequency-doubling technology perimetry. Investigative Ophthalmology & Visual Science. 2001;42:1404–1410. [PubMed] [Article] [PubMed] [Google Scholar]
- Sun H, Dul MW, Swanson WH. Linearity can account for the similarity among conventional, frequency-doubling, and gabor-based perimetric tests in the glaucomatous macula. Optometry and Vision Science. 2006;83:455–465. doi: 10.1097/01.opx.0000225103.18087.5d. [PubMed] [DOI] [PMC free article] [PubMed] [Google Scholar]
- Swanson WH, Birch EE. Extracting thresholds from noisy psychophysical data. Perception & Psychophysics. 1992;51:409–422. doi: 10.3758/bf03211637. [PubMed] [DOI] [PubMed] [Google Scholar]
- Swanson WH, Felius J, Pan F. Perimetric defects and ganglion cell damage: Interpreting linear relations using a two-stage neural model. Investigative Ophthalmology & Visual Science. 2004;45:466–472. doi: 10.1167/iovs.03-0374. [PubMed] [Article] [DOI] [PubMed] [Google Scholar]
- Swanson WH, Wilson HR, Giese SC. Contrast matching data predicted from contrast increment thresholds. Vision Research. 1984;24:63–75. doi: 10.1016/0042-6989(84)90145-7. [PubMed] [DOI] [PubMed] [Google Scholar]
- Tyler CW, Chen CC. Signal detection theory in the 2AFC paradigm: Attention, channel uncertainty and probability summation. Vision Research. 2000;40:3121–3144. doi: 10.1016/s0042-6989(00)00157-7. [PubMed] [DOI] [PubMed] [Google Scholar]
- Watson AB. Estimation of local spatial scale. Journal of the Optical Society of America A, Optics and Image Science. 1987;4:1579–1582. doi: 10.1364/josaa.4.001579. [PubMed] [DOI] [PubMed] [Google Scholar]
- Watson AB, Ahumada AJ., Jr. A standard model for foveal detection of spatial contrast. Journal of Vision. 2005;5(9):717–740. doi: 10.1167/5.9.6. http://journalofvision.org/5/9/6/, doi:10.1167/5.9.6. [PubMed] [Article] [DOI] [PubMed] [Google Scholar]
- Wetherill GB, Levitt H. Sequential estimation of points on a psychometric function. The British Journal of Mathematical and Statistical Psychology. 1965;18:1–10. doi: 10.1111/j.2044-8317.1965.tb00689.x. [PubMed] [DOI] [PubMed] [Google Scholar]
- Wilson ME. Invariant features of spatial summation with changing locus in the visual field. The Journal of Physiology. 1970;207:611–622. doi: 10.1113/jphysiol.1970.sp009083. [PubMed ] [Article] [DOI] [PMC free article] [PubMed] [Google Scholar]


