

Abstract
Glycosylation is a common protein modification with a significant role in many vital cellular processes and human diseases, making the characterization of protein-attached glycan structures important for understanding cell biology and disease processes. Direct analysis of protein N-glycosylation by tandem mass spectrometry of glycopeptides promises site-specific elucidation of N-glycan microheterogeneity, something which detached N-glycan and de-glycosylated peptide analyses cannot provide. However, successful implementation of direct N-glycopeptide analysis by tandem mass spectrometry remains a challenge. In this work, we consider algorithmic techniques for the analysis of LC-MS/MS data acquired from glycopeptide-enriched fractions of enzymatic digests of purified proteins. We implement a computational strategy which takes advantage of the properties of CID fragmentation spectra of N-glycopeptides, matching the MS/MS spectra to peptide-glycan pairs from protein sequences and glycan structure databases. Significantly, we also propose a novel false-discovery-rate estimation technique to estimate and manage the number of false identifications. We use a human glycoprotein standard, haptoglobin, digested with trypsin and GluC, enriched for glycopeptides using HILIC chromatography, and analyzed by LC-MS/MS to demonstrate our algorithmic strategy and evaluate its performance. Our software, GlycoPeptideSearch (GPS), assigned glycopeptide identifications to 246 of the spectra at false-discovery-rate 5.58%, identifying 42 distinct haptoglobin peptide-glycan pairs at each of the four haptoglobin N-linked glycosylation sites. We further demonstrate the effectiveness of this approach by analyzing plasma-derived haptoglobin, identifying 136 N-linked glycopeptide spectra at false-discovery-rate 0.4%, representing 15 distinct glycopeptides on at least three of the four N-linked glycosylation sites. The software, GlycoPeptideSearch, is available for download from http://edwardslab.bmcb.georgetown.edu/GPS.
Introduction
Protein glycosylation – including both co- and post-translational addition of oligosaccharides to proteins – is one of the most abundant and diverse protein modifications in Eukarya1. Many eukaryotic proteins, including the majority of cell-surface and secreted proteins, are believed to be glycosylated2,3. Glycosylation of protein residues is characterized as either N-glycosylation, in which oligosaccharides are covalently linked to proteins via N-glycosidic linkages on Asn residues4,5, or O-glycosylation, in which oligosaccharides are linked to proteins via O-glycosidic linkages on Ser and Thr residues. This study focuses on the characterization of protein N-glycosylation, which primarily occurs on the Asparagine residues of the motif Asn-Xxx-Ser/Thr6.
The enzymatic machinery of N-glycosylation production and processing results in a rich heterogeneity of glycan structures7 impacting many biological outcomes. N-glycosylation is influenced by tissue-specific8,9 and disease-perturbed expression of glycosyltransferases10,11. The diversity of N-glycan structures, each of which may occupy one or more of a protein's glycosylation sites with some frequency, makes the study of glycoproteins and glycopeptides complex. Despite the difficulties, the study of N-glycoproteins informs many areas of medical science, offering insight into normal physiological function as well as pathologies ranging from congenital disorders of glycosylation12 to viral infection and immune system evasion13, rheumatoid arthritis10, and cancer14.
N-glycan microheterogeneity – the diversity of N-glycans occupying a protein's glycosylation sites – complicates the analysis of glycoproteins, as even simple protein mixtures may contain proteins with numerous different attached glycan structures. The direct analysis of glycopeptides by (tandem) mass spectrometry shows significant promise15–17, but glycopeptides with specific glycan structures may be so low in abundance that they are hard to observe in competition with other, more abundant or more readily ionized analytes, such as (non-glycosylated) peptides. Thus, the detection and identification of glycoproteins' many and varied minor glycoforms is a significant challenge, but vitally important for glycoprotein analysis.
Tandem mass spectrometry (MS/MS) of glycoproteins' proteolytic digests provides a direct, site-specific analysis of protein glycosylation, facilitating unbiased, high-throughput, discovery-mode glycoproteomics. In this workflow, glycoproteins are first digested to glycopeptides and the glycopeptides analyzed by LC-MS/MS. Intact (peptide and glycopeptide) ions are first measured in a survey scan and precursor ions are selected for fragmentation, with the fragments measured in subsequent product ion scans. This workflow has the advantage that it provides direct information about intact glycopeptides, but it presents new challenges as it produces large datasets of MS/MS spectra that can be time-consuming to interpret manually.
The biological importance of glycosylation and the time-consuming nature of manual interpretation of glycoproteomic data necessitate the development of automated tools for data interpretation. Tools for interpretation of glycomic data, such as GlycoWorkbench18, Cartoonist19 and SimGlycan20, are used for assignment of detached glycan composition with great success. While glycopeptide datasets present different challenges, some of the lessons learned from glycomics software can be applied to the development of glycopeptide interpretation software. Tools including GlycoMod21, Peptoonist22, Branch-and-Bound23, GlycoSpectrumScan24, GlyDB25, Medicel N-glycopeptide library26, GlycoQuest27 and other software have made strides in interpretation of N-glycopeptide datasets. In a recent review, Dallas et al.28 discuss the strengths and challenges facing current glycomic and glycoproteomic software tools. Some of these tools are designed to analyze a single glycopeptide spectrum at a time, and are therefore ill-suited for large glycopeptide datasets. Others can handle larger datasets but fail to take advantage of the biological knowledge collected in publicly available glycan structure databases. In designing GPS, we sought to build on the strengths of these tools while harnessing the power of available glycan structure databases and applying a target-decoy strategy for estimation of the false discovery rate. We stress than in this work, we focus on the analysis of tandem mass spectra resulting from collision-induced dissociation (CID) of N-linked glycopeptides.
We demonstrate our approach on human haptoglobin, a common standard for glycoproteomic research, with the analysis of commercially available haptoglobin standard and plasma-derived haptoglobin isolated via affinity chromatography. The analysis of plasma-derived haptoglobin demonstrates the applicability of this workflow for the analysis of purified glycoprotein samples isolated in a laboratory setting. To address the issue of low glycopeptide abundance and to minimize ionization competition with peptides, the protein digests are first separated by hydrophilic (HILIC) chromatography and the glycopeptide-containing fractions analyzed by reversed-phase chromatography interfaced online with a Q-TOF mass-spectrometer. Tandem mass spectra were collected in data-dependent mode. Throughout we denote N-glycans using the N-glycan composition abbreviations of GlycoBase29, as documented in the Oxford notation guide for abbreviations from http://glycobase.nibrt.ie.
CID Fragmentation of N-Glycopeptides
The interpretation of tandem mass spectra of glycopeptides fragmented by collision-induced dissociation (CID) requires an understanding of their specific spectral characteristics. CID fragmentation of N-glycopeptides tends to cleave specific glycosidic linkages30. Figure 1 shows a typical CID MS/MS spectrum from our human haptoglobin dataset; it is a spectrum of the haptoglobin peptide VVLHP241NYSQVDIGLIK with glycan A2G2S2 attached at the241N glycosylation site, observed experimentally as the precursor ion m/z 800.78 with charge-state 5+. We point out fragment ions, as described elsewhere31–33, consistently observed in our CID MS/MS spectra of N-glycopeptides, including glycan oxonium ions; intact-peptide ions with a small number of monosaccharide residues from the N-linked glycan core attached (which we distinguish from the broader category of Y-ions because of their specific use in the GPS algorithm); glycan B-ions, representing multi-monosaccharide fragments of the non-reducing termini of the attached glycan; and additional glycopeptide Y-ions consisting of the intact peptide with a partially fragmented glycan moiety attached. Notably, peptide b- and y-ions are not reliably observed nor sufficiently abundant in CID glycopeptide spectra.31,32,34
Figure 1.

Glycopeptide CID MS/MS spectrum of glycopeptide VVLHPNYSQVDIGLIK with glycan A2G2S2 (precursor m/z 800.78, 5+) from haptoglobin standard dataset. Glycan structures generated using GlycanBuilder49.
Oxonium Ions
Glycan oxonium ions – singly-protonated mono- and oligosaccharide ions resulting from fragmentation of glycans and glycopeptides – are highly sensitive markers of glycopeptide fragmentation in CID MS/MS spectra. Huddleston, et al.31 and Conboy and Henion33 were among the first to describe glycopeptide CID fragmentation and observe glycan oxonium ions in CID MS/MS spectra of glycoprotein digests. These groups observed that Hex+ (m/z 163), HexNAc+ (m/z 204), and HexNAc-Hex+ (m/z 366) oxonium ions were prevalent in glycopeptide fragmentation spectra31–34.
Intact-Peptide Ions and Glycopeptide Y-Ions
Glycopeptide fragment ions resulting from partial fragmentation of the glycan, called Y-ions, can also be observed in CID glycopeptide spectra30. These high-mass ions retain the peptide substrate intact. N-glycopeptides' CID spectra often display a specific set of Y ions consisting of the intact peptide substrate either alone or with attached GlcNAc, GlcNAc-GlcNAc, and GlcNAc-GlcNAc-Man, respectively, from the N-glycan core. We call these intact-peptide fragment ions30 and we use this specific set of Y ions to identify the peptide substrate in glycopeptide CID spectra. In Figure 1, the peaks at m/z 1000.06, 1101.13, and 1182.16 represent doubly-charged intact-peptide fragment ions for the peptide VVLHP241NYSQVDIGLIK. The peak of the doubly charged peptide ion is also visible in the spectrum. These ions can be readily identified in CID glycopeptide spectra for a given peptide substrate, as they have the same m/z value regardless of the attached N-glycan. We note that these ions are often doubly or triply charged.
Glycan B-Ions
Glycan B-ions, representing singly-protonated fragments from the non-reducing end(s) of the glycan, are often quite abundant in CID glycopeptide fragmentation spectra30, and can provide evidence for a specific glycan motif or the presence of a specific monosaccharide. One such B-ion can be seen in Figure 1 at m/z 657, representing GlcNAc-Gal-Neu5Ac, suggesting that the attached glycan has the sialylated N-acetyllactosamine motif. With suitable care to consider the possible rearrangement of monosaccharides in CID35,36 these fragments can assist in glycopeptide analysis. However, we point out that these ions provide little insight as to the specific details of the glycan structure, such as the number or linkage of non-reducing glycan arms with the N-acetyllactosamine motif.
We take particular advantage of the specific characteristics of glycopeptide CID fragment spectra in our analysis strategy, especially the oxonium ions, used to recognize N-glycopeptide fragmentation spectra, and the intact-peptide fragmentation ions, to infer the mass of the peptide substrate of the glycopeptide. While these characteristic ions have been reported previously, we demonstrate that an analysis strategy based around these ions is suitable for large-scale analysis of high-throughput CID LC-MS/MS glycopeptide datasets.
Our software, called GlycoPeptideSearch (GPS), characterizes glycopeptide microheterogeneity at multiple N-linked motif sites of glycoproteins, matching tandem mass spectra to motif-containing peptide sequences paired with glycan structures from glycan structure databases. GPS identifies glycopeptides from mixed peptide and glycopeptide CID tandem mass spectra by using glycan specific oxonium ions to distinguish glycopeptide CID spectra from non-glycopeptide spectra; using intact-peptide fragment ions to determine the mass of the peptide substrate, and by subtraction, the putative glycan mass; by examining the correspondence between the theoretical glycopeptide isotope cluster and the precursor's MS spectrum; and by using additional glycan clues in the MS/MS spectrum, given a putative peptide sequence and glycan structure (Figure 2). Significantly, GPS does more than match peptide-glycan pairs with tandem mass spectra; it also estimates the false-discovery rate (FDR) of its matches, making it possible to tune the sensitivity and specificity of the identification process.
Figure 2.

Schema of GlycoPeptideSearch algorithm.
Experimental Methods
Sample Preparation and MS/MS Analysis
The sample preparation and MS/MS analysis protocol are as described previously17,37. Briefly, plasma-derived haptoglobin was purified from healthy individuals (n = 5) by hemoglobin-Sepharose affinity followed by reverse phase chromatography. All individuals were enrolled under protocols approved by the Georgetown University Institutional Review Board. A twenty microgram aliquot of commercially available haptoglobin (Sigma-Aldrich, St. Louis, MO) and a 2.5 ug aliquot of plasma-derived haptoglobin were digested with Trypsin-Gold (Promega, Madison, WI) using a barocycler (Pressure Biosciences Inc, South Easton, MA). The 20 ug aliquot of commercial haptoglobin underwent a second digestion step with endoproteinase GluC (Roche, Indianapolis, IN). The resulting peptides were fractionated using a HILIC XBridge column (5μm particles, ID 2.1 × 100mm, Waters, Milford, MA) with a 35 minute linear gradient from 90% to 40% solvent B (0.01% TFA in Acetonitrile) at 40°C (Solvent A: 0.01% TFA in water). HILIC fractions from each sample showing evidence of enrichment of glycopeptides were selected for further analysis. Each fraction was suspended in 20 μL of 2% acetonitrile with 0.1% formic acid and 2 μL injected for nanoLC-ESI-MS/MS analysis using reversed phase C18 chromatography (1.7μm particles, 75 μm ID × 150mm) coupled online to a QStar Elite mass spectrometer (Applied Biosystems, Foster City, CA) with the following gradient: 0 min 99% A, 2 min 90% A, 14 min 55% A, 15 min 1% A, 17 min 1% A, 18 min 99% A, 30 min 99% A (Solvent A: 0.1% formic acid in 2% acetonitrile; Solvent B: 0.1% formic acid in 98% acetonitrile). The mass spectrometer was operated in data dependent mode with the four most intense ions selected for collision-induced dissociation. Collision energy and MS/MS accumulation time were set automatically by the instrument software. Collision energy was adjusted automatically based on the mass and charge of the precursor, using a linear equation optimized on haptoglobin glycoforms as described in Sanda et al38. MS/MS spectra were recorded from m/z 150 to 2000, with dynamic exclusion set for 20 seconds, as previously reported17.
Conversion of MS/MS Spectra to Open Data Format
Eleven LC-MS/MS spectra data files (.wiff) representing 3288 MS/MS spectra from the commercially available haptoglobin sample and 8 data files representing 2704 MS/MS spectra from the plasma-derived haptoglobin sample were subject to peak detection and output in mzXML format using the msconvert tool from the ProteoWizard project.48
Proteomic Analysis of MS/MS Spectra
Tandem mass-spectra in mzXML format were uploaded to the PepArML53 meta-search engine for proteomic analysis. The PepArML meta-search engine automatically conducts target and decoy peptide identification searches using seven search engines, including Mascot; OMSSA; Tandem with native, K-score and S-score pluggable scoring functions; MyriMatch; and Inspect with MS-GF spectral probability scoring. PepArML combines the search results using an unsupervised machine-learning strategy and estimates peptide identification false discovery rates using identifications from reversed decoy searches. Typically, this approach makes a significant number of additional peptide-spectral assignments, compared to the number of identifications from the individual search engines, with no loss of peptide identification specificity.
Haptoglobin standard and plasma-derived haptoglobin MS/MS spectra were searched against the UniProt human reference proteome, including enumerated isoforms. The search engines were automatically configured to carry out searches of semi-specific tryptic peptides with up to one missed cleavage, precursor mass-tolerance of 2.0 Da, fragment mass-tolerance of 0.2 Da, fixed carbamidomethylation modification on Cys, variable oxidation of Met and so-called Pyro modifications on N-terminal Glu, Gln, and Cys. The peptide identifications were combined using machine learning techniques and q-values estimated for all peptide identifications, as previously described53, to permit spectral-FDR based filtering of the peptide assignments.
Glycan Databases
GlycomeDB was downloaded from www.glycome-db.org39,40. GlycomeDB contains N- and O-glycan structures from a wide variety of data-sources, including Carbbank41, the Consortium for Functional Glycomics42, EUROCarbDB43, GLYCOSCIENCES.de44 and KEGG45, in a common GlycoCT data-format46, annotated by source database and organism. The human subset of GlycomeDB glycan structures, in GlycoCT-condensed format46, was extracted and indexed by mass, monosaccharide composition, and presence/absence of the N-linked glycan-core motif. Some of the GlycomeDB database structures are annotated to indicate membership in GlycO47, which identifies GlycomeDB glycan structures that are consistent with mammalian glycosyltranferase and glycosidase enzymes. We extracted the subset of glycans from GlycomeDB that are both members of GlycO and are annotated as human glycans for indexing and searching.
Glycan Composition Notation
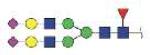
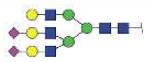
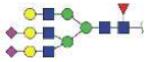
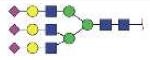
We briefly describe the Oxford glycan composition abbreviations from the GlycoBase web-site “Oxford notation guide”, which may be accessed without registering for an account (http://glycobase.nibrt.ie/glycobase/documents/abbreviations.pdf). This notation is designed for high mannose and common complex N-linked glycan structures.
In this notation, high mannose glycans are denoted Mx, where x is the number of mannose monosaccharides. The N-linked glycan core is denoted M3. Complex N-linked glycan structures are denoted based on the number y of antennae by Ay. Core fucose is indicated with the prefix F, and bisecting N-acetylglucosamine denoted with a B suffix. Next, the number z of galactose monosaccharides on the antennae are indicated by Gz, and the number w of sialic acids attached to Gal are indicated by Sw. The number v of fucose on antennae N-acetylglucosamines is indicated by Fv immediately after the antennae specification. The most common complex N-glycan we observe is A2G2S2, the bi-antenary di-sialated complex N-glycan.
Peptide Sequences
In silico digest by trypsin (for plasma-derived haptoglobin dataset) and trypsin and endoproteinase GluC (for commercially available haptoglobin standard dataset) was applied to the human haptoglobin sequence from UniProt (P00738). Peptides with molecular weight between 400 and 2500 Da and at most two missed cleavage sites were retained. Cysteines were considered carbamidomethylated. In the standard analysis, we require both the N- and C-terminus of the peptide be consistent with the expected protease activity (specific digest). The semi-specific analysis requires only one terminus be consistent with the protease(s). Peptides containing canonical N-glycosylation motif(s) are considered putative glycopeptide substrates, with the remainder designated as decoy peptides (see false-discovery rate description below). Of the 133 trypsin and GluC specific haptoglobin peptides satisfying these constraints, 14 contain one of the four canonical-motif N-glycosylation sites. For trypsin and GluC semi-specific peptides, 124 of the 1015 peptides contain one of the four canonical-motif N-glycosylation sites. For trypsin-only cleavage of haptoglobin, we extend the molecular weight range to 3500 Da. Of the 88 trypsin-cleavage only peptides satisfying these constrains, 10 contain a canonical N-glycosylation motif.
GlycoPeptideSearch Algorithm
Selection of Glycopeptide Spectra
Each MS/MS spectrum is checked for the presence of (singly charged) glycosylation oxonium ions m/z 204 (representing the HexNAc monosaccharides: GlcNAc and GalNAc), and m/z 366 (HexNAc-Hex) using a mass tolerance of 0.2 Da. By default, we require at least one oxonium ion, with relative intensity 10% of the base peak (defined as the most abundant peak in the spectrum), to consider the glycopeptide fragmentation spectrum further.
Intact-Peptide Fragment Ion Matching
Each MS/MS spectrum is next checked for intact-peptide fragment ions according to the mass of each putative glycopeptide substrate. Intact peptide fragments corresponding to the intact peptide alone, and the peptide plus one, two, or three of the monosaccharide residues from the reducing end of the N-glycan core (GlcNAc, GlcNAc-GlcNAc, and GlcNAc-GlcNAc-Man) are checked at m/z values corresponding to charge-states +1, +2, and +3. By default, at least two such fragment ions are required at mass tolerance 0.2 Da, with relative intensity at least 5%, to consider the glycopeptide spectrum further.
Glycan Structure Retrieval
After the intact-peptide fragments are matched, the putative peptide substrate mass is subtracted from the precursor ion mass to determine the mass of the attached glycan. At this stage of the algorithm, we can also enumerate over the possibility that the reported precursor ion m/z represents a non-monoisotopic peak of the glycopeptide isotope cluster and the potential for one or more sodium adducts on the precursor. In the standard version of the analysis, we consider only that the precursor may represent either the monoisotopic or the first or second non-monoisotopic peak of the isotope cluster with no sodium adducts. All N-linked glycan structures corresponding to a proposed glycan mass are then retrieved by molecular weight from the indexed glycan structure database.
Evaluation of Spectrum to Peptide-Glycan Matches
Each peptide-glycan pair matched by molecular weight to a spectrum's precursor is then evaluated to determine the quality of the match. The spectrum is checked for matches to additional oxonium ions including m/z 147 (Fuc) and m/z 292 (Neu5Ac), and glycopeptide fragment ions – peptide b- and y-ions with or without the intact glycan mass, depending on the glycan attachment site, and glycan B- and Y-ions with the intact peptide mass added to the Y-ions. These fragment ions serve as supporting evidence of peptide-glycan matches and may favor or exclude specific glycan structures. The mass-delta between the glycopeptide mass determined from the precursor ion m/z and the putative mass of the peptide-glycan pair is also reported. Lastly, we evaluate the observed isotope cluster in the MS scan – extracting the isotope cluster peak intensities and comparing them to the theoretical isotope cluster computed from the elemental composition of the proposed peptide-glycan pair. We use a χ2 test to evaluate the fit of the observed peak intensities to the theoretical isotope cluster and report −10log10(χ2 p-value) as the isotope-cluster score (ICScore). By default, peptide-glycan matches with ICScore greater than 20 are eliminated from further consideration.
Estimation of Glycopeptide False Discovery Rate
While a number of the peptides from haptoglobin contain an N-linked glycosylation site, many of the in silico digest peptides do not. We include these non-motif peptides in the analysis above as decoys – peptides which should never be matched to a glycopeptide fragmentation spectrum as part of a peptide-glycan pair. Each spectrum's matching peptide-glycan pairs are evaluated to count matches with target and decoy glycopeptides. Since the number of decoy peptides does not, in general, match the number of target peptides, we cannot use the number of spectra with decoy matches without correcting the number of decoy matches appropriately. We denote the total number of spectra in the dataset by N, the number of decoy peptides by PD and the number of spectra matched to each decoy peptide d by Sd. We estimate the probability that a randomly chosen spectrum will be matched by a randomly chosen decoy peptides' glycopeptides as
the mean number of spectra matched to decoy peptides' glycopeptides divided by the number of spectra. We now compute the expected number of spectra that would be matched by the PT target peptides, assuming that the target peptides behave the same as decoys. The probability that no target peptides' glycopeptides randomly match to a spectrum is
so the expected number of spectra with false matches to target peptides is
Finally, we compute the false-discovery rate as the expected number of false matches divided by the number of spectra matched to at least one target glycopeptide (T) as
Results
Our algorithm, implemented in the software program GlycoPeptideSearch (GPS), is designed to search glycopeptide CID MS/MS datasets and identify glycan-peptide pairs consistent with each spectrum – we call these glycopeptide-spectrum matches (GPSMs). The algorithm takes advantage of the characteristics of CID glycopeptide fragmentation spectra, as described in the introduction. We use a HILIC enriched trypsin-GluC digest of a commercially available human haptoglobin standard, analyzed in 11 fractions and resulting in 3,288 tandem mass spectra, to demonstrate how GPS matches glycopeptides to spectra in large-scale datasets and how GPS estimates the false-discovery-rate (FDR) of the GPSMs it generates. Furthermore, we explore the role of characteristic glycopeptide fragment ions in eliminating non-glycopeptide spectra from consideration and in improving the FDR of identified glycopeptides. Finally, we explore the effect of contracting or expanding the search space of glycans or peptides on the set of identified glycopeptides and the resulting FDR. Finally, we analyze a serum-derived human haptoglobin sample, in order to demonstrate that this analytical workflow, coupled with GPS, can successfully be applied to purified protein samples without making a significant number of false-positive glycopeptide identifications.
Identified Haptoglobin Glycopeptides
To analyze the CID spectra of enriched haptoglobin glycopeptides, we use the following GPS search parameters: in silico trypsin and GluC digest of UniProt's human haptoglobin (P00738) protein sequence with at most two missed proteolytic cleavages, N- and C-terminus consistent with either trypsin or GluC, and molecular weight between 400 and 2500 Da; human GlycomeDB N-linked glycan structures composed of Hex, HexNAc, Fuc, and Neu5Ac monosaccharides with an explicit monosaccharide topology; precursor and fragment mass match tolerance of 0.2 Da; at least one oxonium ion of at least 10% intensity, relative to the base-peak; at least two intact-peptide fragment ions of at least 5% intensity, relative to the base-peak; and maximum isotope-cluster score (ICScore) of 20. These represent the GPS default settings (Table 1, Search #1).
Table 1.
GlycoPeptideSearch parameters and results for haptoglobin standard dataset.
| # | Search | Peptides | Glycans | Precursor Tolerance | Oxonium Ions | Intact-Peptide Ions | Max. ICScore | Matched Spectra | FDR |
|---|---|---|---|---|---|---|---|---|---|
| 1 | Default | Specific | Glycome-DB | 0.2 Da | 1 | 2 | 20 | 246 | 5.58% |
| 2 | No filter | Specific | Glycome-DB | 0.2 Da | 0 | 0 | - | 1736 | 100.00% |
| 3 | ICScore-5 | Specific | Glycome-DB | 0.2 Da | 1 | 2 | 5 | 165 | 4.63% |
| 4 | ICScore-10 | Specific | Glycome-DB | 0.2 Da | 1 | 2 | 10 | 218 | 4.96% |
| 5 | ICScore-20 | Specific | Glycome-DB | 0.2 Da | 1 | 2 | 20 | 246 | 5.58% |
| 6 | ICScore-50 | Specific | Glycome-DB | 0.2 Da | 1 | 2 | 50 | 268 | 5.91% |
| 7 | ICScore-100 | Specific | Glycome-DB | 0.2 Da | 1 | 2 | 100 | 278 | 6.33% |
| 8 | ICScore-200 | Specific | Glycome-DB | 0.2 Da | 1 | 2 | 200 | 300 | 8.91% |
| 9 | ICScore-500 | Specific | Glycome-DB | 0.2 Da | 1 | 2 | 500 | 314 | 12.37% |
| 10 | ICScore-10000 | Specific | Glycome-DB | 0.2 Da | 1 | 2 | 10,000 | 315 | 14.32% |
| 11 | GlycO | Specific | GlycO | 0.2 Da | 1 | 2 | 20 | 238 | 1.73% |
| 12 | Complex | Specific | Complex | 0.2 Da | 1 | 2 | 20 | 238 | 2.21% |
| 13 | High-Mannose | Specific | High-Mannose | 0.2 Da | 1 | 2 | 20 | 2 | 5.88% |
| 14 | Semi-Specific | Semi-specific | Glycome-DB | 0.2 Da | 1 | 2 | 20 | 385 | 31.72% |
| 15 | High Quality Semi-Specific | Semi-specific | GlycO | 0.1 Da | 1 | 2 | 10 | 236 | 10.40% |
| 16 | High Quality Specific | Specific | GlycO | 0.1 Da | 1 | 2 | 10 | 177 | 0.73% |
Using these parameters, fourteen haptoglobin peptides containing the N-linked glycan motif (representing four distinct N-glycosylation sites) were considered. The GlycomeDB subset analyzed consists of 1001 glycan structures, representing 276 topologically distinct glycans and 159 distinct molecular weights. Of the 3,288 MS/MS spectra, GPS matched peptide-glycan pairs to 246 spectra, which we categorize based on the number and variety of their glycopeptide hits. Fifty-six percent (138) of the matched spectra matched to a single glycopeptide after topologically equivalent glycans were eliminated. A further 43% (107) of the matched spectra were associated with more than one glycopeptide (after topologically equivalent glycans were eliminated), but all glycopeptides shared the same peptide substrate. Just 1 spectrum matched two or more glycopeptides with more than one peptide substrate. Of the 107 matched spectra with more than one glycopeptide hit on a single peptide substrate, 102 spectra matched glycopeptides representing isobaric, but topologically distinct, glycans. Almost all of the matched spectra (240, about 97.5%) were associated with glycopeptides with isobaric glycans and a single peptide substrate. We point out that these cannot be distinguished by intact mass, but require CID glycopeptide fragments to distinguish distinct glycan topology alternatives. However, in many cases, no distinguishing (theoretical) fragment ions exist, while in other cases, distinguishing fragment ions are not observed in the spectra. In about half of the cases with multiple glycopeptide hits, including all spectra with non-isobaric glycans or multiple peptides, we can select one of the hits by favoring high-mannose glycan structures and glycan structures within the family of lactosamine motif hybrid/complex N-glycans (or a glycan substructure of this family). The 240 spectra matched with a single glycopeptide mass represent 42 distinct glycopeptide species, with each of the four haptoglobin glycosylation sites represented at least once, and include bi- and tri-antennary sialylated and fucosylated N-glycans. Table 2 summarizes the observed microheterogeneity of the identified site-specific haptoglobin glycans.
Table 2.
Haptoglobin glycopeptides found using GlycoPeptideSearch on trypsin/GluC digest of haptoglobin standard. Most common peptide substrates, for each glycosylation site and glycan, listed first, with alternative peptide substrates in parenthesis.
| Site | Peptide Sequence | Oxford Not. | CFG | MW (Da) | Charge |
|---|---|---|---|---|---|
| N184 | MVSHHNLTTGATLINE | M3 |
|
2629.17 | +2 |
| MVSHHNLTTGATLINE | A1 |
|
2823.25 | +3 | |
| MVSHHNLTTGATLINE | A1G1 |
|
2994.30 | +3 | |
| MVSHHNLTTGATLINE (MVSHHNLTTG) | A1G1S1 |
|
3285.40 | +3 | |
| MVSHHNLTTGATLINE | A2G1 |
|
3197.38 | +3 | |
| MVSHHNLTTGATLINE | A2G2 |
|
3359.43 | +3 | |
| MVSHHNLTTGATLINE (MVSHHNLTTG) | A2G2S1 |
|
3650.53 | +3, 4 | |
| MVSHHNLTTGATLINE | FA2G2S1 |
|
3796.59 | +4 | |
| MVSHHNLTTGATLINE (MVSHHNLTTGAT, MVSHHNL) | A2G2S2 |
|
3941.62 | +3, 4, 5 | |
| MVSHHNLTTGATLINE | FA2G2S2 |
|
4087.68 | +4 | |
| MVSHHNLTTGATLINE (MVSHHNLTTG) | A3G3S2 |
|
4306.76 | +4 | |
| MVSHHNLTTGATLINE | A3G3S3 |
|
4597.85 | +4 | |
| MVSHHNLTTGATLINE | FA3G3S3 |
|
4743.91 | +4 | |
| N207 | NLFLNHSE | A1 |
|
2067.86 | +2 |
| NLFLNHSE | A1G1 |
|
2229.92 | +2 | |
| NLFLNHSE | A1G1S1 |
|
2521.01 | +2 | |
| NLFLNHSE | A2G2 |
|
2595.05 | +3 | |
| QWLLTTAKNLFLNHSE | FA2F1G1S1 |
|
3957.74 | +4 | |
| NLFLNHSE | A2G2S1 |
|
2886.14 | +3 | |
| NLFLNHSE | FA2F1G2S1 |
|
3178.26 | +3 | |
| NLFLNHSE | A2G2S2 |
|
3177.24 | +3 | |
| NLFLNHSE | FA2G2S2 |
|
3323.30 | +3 | |
| NLFLNHSE | A3G3S2 |
|
3542.37 | +3 | |
| NLFLNHSE | FA3G3S2 |
|
3688.43 | +3 | |
| NLFLNHSE | A3G3S3 |
|
3833.47 | +4 | |
| NLFLNHSE | FA3G3S3 |
|
3979.52 | +3 | |
| N211 | NATAKDIAFTLTLYVGK | A2G2S2 |
|
3979.76 | +4 |
| N241 | VVLHPNYSQVDIGLIK (KVVLHPNYSQVD, VVLHPNYSQVD) | A1G1S1 |
|
3342.55 | +3 |
| VVLHPNYSQVDIGLIKLK | FA1G1S1 |
|
3729.79 | +5 | |
| VVLHPNYSQVD | A2G1S1 |
|
3021.26 | +3 | |
| VVLHPNYSQVDIGLIK (KVVLHPNYSQVD, VVLHPNYSQVD) | A2G2S1 |
|
3707.68 | +3 | |
| VVLHPNYSQVDIGLIK (KVVLHPNYSQVD, VVLHPNYSQVD) | A2G2S2 |
|
3998.78 | +3, 4, 5 | |
| VVLHPNYSQVDIGLIK | FA2G2S2 |
|
4144.83 | +4 | |
| VVLHPNYSQVDIGLIK (VVLHPNYSQVD) | A3G3S2 |
|
4363.91 | +4 | |
| VVLHPNYSQVDIGLIK | FA3G3S2 |
|
4509.97 | +4 | |
| VVLHPNYSQVDIGLIK (VVLHPNYSQVD) | A3G3S3 |
|
4655.00 | +3 |
While the small number of spectra with multiple-peptide or multiple, non-isobaric glycopeptide matches is reassuring, an estimate of the number of spectra with false matches (the so called false-discovery-rate or FDR) provides a better calibration of the appropriate degree of confidence. We use peptides without an N-linked glycan motif, generated using the in silico digest of the haptoglobin protein sequence, as decoy peptides to estimate the FDR. A total of 119 decoy peptides were added to the list of fourteen N-linked motif-containing (target) peptide substrates to be paired with glycans and matched to the glycopeptide fragmentation spectra.
Glycopeptide-spectrum-matches based on decoy peptides matched 117 spectra, averaging 0.98 matches per decoy peptide. From this, we compute the expected number of false target-peptide matches to be 13.74 and the false discovery rate as 5.58%. In this high-quality match regime, where we generally see zero or one matches per spectrum, the FDR behaves like a linear multiple of the average decoy peptide match counts. However, when we consider more permissive matching criteria, we must use our more sophisticated model to correctly estimate FDR, as multiple decoy and/or target glycopeptides frequently match the same spectra.
Oxonium Ion, Intact-Peptide Fragment Ion, and Isotope Cluster Filters
The GPS algorithm uses a number of filters to increase the quality of matching of glycopeptides to spectra and, in the process, to speed up the search by avoiding work on likely false matches. In the haptoglobin analysis with the default parameters above, 416 (13%) of the spectra fail the oxonium ion filter, while 2303 of the remaining spectra fail to pass the intact-peptide fragmentation ion filter, resulting in just 17% of the spectra being considered for a match against the database of glycans. Of these 569 surviving spectra, just 55% (315) can match their remaining mass to a valid glycan from the glycan database. The isotope cluster score filter applied to each matching peptide-glycan pair checks the shape of the precursor's isotope cluster in the precursor scan and computes a score to assess degree of agreement between the experimental and expected isotope cluster shape. This last quality filter eliminates 69 of the putative matches, leaving just 246 (7.4%) of the original spectra with a glycopeptide match.
A valid concern here is that these filters are discarding too many good glycopeptide matches. In order to demonstrate the utility of our filtration approach, we compare against the results of an analysis which uses no oxonium ion, intact-peptide fragment ion, or precursor isotope cluster score filters. Without these filters, the analysis is merely matching the computed mass of peptide-glycan pairs with experimental precursor m/z values.
Based purely on mass matching, and using the same decoy and target peptide sequences and glycan database as before (Table 1, Search #2), a total of 1736 spectra were matched to a target glycopeptide. However, just 612 of these spectra were matched to glycopeptides of a single mass and just 700 spectra matched to glycans on a single peptide substrate. This suggests a significant number of the target glycopeptide matches are false, as more than 1000 of the spectra have glycopeptides with two or more peptide substrates matched to them. The average number of spectra matching to each of the 119 decoy peptides' glycopeptides is about 246, suggesting considerable false matching. Indeed, the computed FDR rate is 100%, indicating that we expect at least one false match to each spectrum matched by a target glycopeptide. We point out that this does not mean that the true matches previously observed are no longer matched, but instead that the task of determining which of the matches are true is now nearly impossible.
In addition to the improved quality of the proposed set of target glycopeptide matches with modest 5.58% FDR, these filters speed up the search considerably. Using these oxonium ion and intact-peptide fragment ion filters, the GPS algorithm takes about 436 seconds to search the 3288 spectra against target and decoy haptoglobin peptides paired with the human glycans of GlycomeDB, while the analysis which uses no oxonium ion, intact-peptide fragment ion, or precursor isotope cluster filters required 4999 seconds on the same hardware, a 11-fold increase in running time. While it is probably the case that this more permissive search finds additional correct glycopeptide matches, it is unclear how to discriminate the correct matches from the incorrect matches, whether the number of additional matches justifies the significant increase in running time, or whether the user should accept matches which do not meet the filtering criteria. While this second algorithm provides an unconvincing alternative to the default parameters, the question remains – how can we tune the search parameters to find more correct identifications, without increasing false matches to an unacceptable level? The FDR estimation procedure allows us to explore these options and understand the consequences of tightening and loosening the match filters.
We can also study the benefit of the isotope cluster score filter with respect to the default search parameters by varying the ICScore threshold from 5 (very stringent) to 10,000 (effectively, no filter) (Table 1, Searches #3–10) and recording the total number of spectra with target glycopeptide matches and the associated FDR. Figure 3A shows the resulting q-value curve, representing the number of matched spectra as a function of the search FDR, as the ICScore threshold is varied. With the ICScore threshold set to 5, a total of 165 spectra were matched to a glycopeptide with FDR 4.63%. With the threshold set to 10,000, effectively disabling the ICScore filter, 315 spectra where matched to a glycopeptide at FDR 14.32%. Also plotted in this figure is the presumed number of good hits, computed using the estimated FDR, for each ICScore threshold. It is clear that while the number of presumed good, matched spectra increases rapidly for small values (5, 10, 20) of the ICScore, as this threshold is further relaxed, there are few additional good matches made for larger ICScore values (100, 200, 500, …), even though the total number of matched spectra continues to rise. Furthermore, the additional spectra matched with high ICScores represent a significantly lower ratio of presumed good to random matches. For example, the additional 22 spectra matched with ICScores between 100 and 200 raise the overall FDR from 6.33% to 8.91%, suggesting ~ 40% local-FDR for these additional spectra. We show the local-FDR at each of the above ICScore thresholds in Figure 3B. Our default parameter setting of 20 for the ICScore threshold represents a compromise between the number of matched spectra and the FDR.
Figure 3.

Haptoglobin standard dataset. A. Effect of ICScore thresholds on matched spectra (red) and presumed good matches (green) versus false discovery rate. B. Local FDR for ICScore thresholds.
Glycan Databases and the Glycan Search Space
We have designed GPS to accept one or more glycan databases, in a variety of formats, as an input to the search process. Glycan databases may come from external sources, such as the downloadable GlycomeDB39,40; be defined as a list of IUPAC-format glycans, such as provided by the Consortium for Functional Glycomics (the Mammalian Glycan Array)42; or be drawn by hand using GlycoWorkbench18,49, exported in an appropriate data format and collected for analysis. Glycans in the resulting glycan databases are automatically indexed with respect to the presence or absence of the N-linked core, monosaccharide composition, molecular weight, and whether the structure is a high-mannose (M3, M4, …) or a substructure of the tetra-antennary complex lactosamine motif N-glycan. These pre-computed indices provide a powerful set of tools for managing the glycan structure search space, helping to control potential false-positives or to focus glycopeptide matches on specific structures. Our default glycan search database, the N-linked human subset of GlycomeDB, consists of 1001 glycan structures, representing 276 topologically distinct glycans and 159 distinct masses. We next explore the potential for improved search specificity by the use of a more carefully chosen set of glycans.
The Glycan Ontology project (GlycO) represents an effort to determine which of the mammalian, GlycomeDB N-linked glycan structures are consistent with the known action of mammalian glycosyltransferases and glycosidases. The resulting GlycomeDB annotations can be used to extract a human GlycO N-linked glycan structure database, consisting of 109 glycan structures, representing 81 topologies and 67 monosaccharide compositions with distinct masses. While GlycO does not specifically denote human and non-human mammalian glycan structures, the glycans in GlycomeDB have species annotations derived from the original source databases. Therefore, this `human GlycO' subset represents only glycans that are contained within the GlycO ontology and also annotated in one of the GlycomeDB source databases as a human glycan. We search the human GlycO subset of GlycomeDB using otherwise identical search parameters (Table 1, Search #11), matching 238 spectra to glycopeptides at an estimated FDR of 1.73%, compared to matching 246 spectra at 5.58% FDR previously. Of the 238 matched spectra, 227 represent single topology glycopeptide matches, and 234 represent single monosaccharide compositions. When we compare with the number of single-topology glycopeptide matches (138) from the original search, it is clear that the GlycO glycan structure database eliminates a large number of enzymatically implausible, topologically equivalent, glycan structures from consideration, significantly simplifying the interpretation task. We also point out that the presumed number of correct assignments from the initial search of human GlycomeDB, at about 232 spectra (94.42% of 246), is about the same as that of our new search of human GlycO structures, with 234 (98.27% of 238) assigned spectra. This serves to reinforce our confidence in the quality of our initial assignments, and to verify the accuracy and consistency of our FDR estimates.
We get a very similar result when we restrict attention to the human GlycomeDB glycan structures that are also substructures of complex N-linked lactosamine motif-containing glycans. This GlycomeDB subset consists of 670 structures, representing 103 distinct topologies and 75 monosaccharide compositions and distinct molecular weights. Searched against this glycan database subset (Table 1, Search #12), we match 238 spectra at 2.21% FDR, with 203 single topology glycopeptide spectrum matches and 237 spectra matched to a single monosaccharide composition. In this case, the observed haptoglobin-standard glycosylation seems to consist primarily of these complex lactosamine motif glycans, so the automatic structure-based database restriction works nearly as well as the manually curated GlycO subset of GlycomeDB.
Interestingly, we observe few high-mannose glycopeptide matches in our haptoglobin standard dataset. We checked this by searching using the high-mannose glycan structure constraint for the human GlycomeDB database (Table 1, Search #13). This search matched just two spectra to peptides paired with the M3 glycan structure with 5.88% FDR. Based on published reports, haptoglobin contains mostly complex N-glycans15,17,50–52. Therefore, this finding is consistent with published reports.
Semi-Specific Glycopeptides
The CID spectra of glycopeptides are expected to contain few, if any peptide b- or y-ion fragments to assist in distinguishing the potential peptide substrates. The intact-peptide glycopeptide fragments matched in the GPS algorithm can only provide information as to the molecular weight of the peptide substrate, and therefore we must ensure that we do not attempt to distinguish the glycopeptides of too many different peptide substrates. In our analysis here, we analyze a haptoglobin standard, though we have also analyzed glycopeptides from affinity-purified proteins. In each case, we rely on the relative sparsity of the putative peptide substrate masses, which ensures that the intact-peptide fragments we observe do not have to distinguish too many different possibilities. However, with a view to more complex mixtures of glycopeptides, perhaps due to less specific (protein) purification strategies or the observation of non-specific proteolytic cleavage in the observed peptides, we need to understand the behavior of searches where we have less information about the potential peptide substrates.
We consider our default search, but instead permit our in silico digest to consider semi-specific peptides, that is, peptides in which only the N- or C-terminus respects the trypsin or GluC proteolytic motif (Table 1, Search #14). In this search, all of our previously identified glycopeptides' peptide substrates are considered, in addition to an order of magnitude more target and decoy peptide sequences. Using semi-specific peptides, we consider 124 target and 891 decoy peptide sequences in combination with the human subset of GlycomeDB, matching 385 spectra with one or more glycopeptides at FDR 31.72%. The considerably larger (glycopeptide) search space significantly increases the false-discovery-rate to the point where it is very difficult to have much confidence in the spectrum matches, even the new ones. However, by tuning the various search parameters, we can compensate for the increased search space with higher-quality matches. We achieve this by searching the GlycO subset of human GlycomeDB, tightening the precursor mass tolerance to 0.1 Da, and reducing the ICScore threshold to 10 (Table 1, Search #16). We expect to lose some correct (specific-peptide-substrate) matches in this process, but the resulting semi-specific matches should have significantly reduced FDR. Indeed, this is what we observe, with this search matching 236 spectra with glycopeptides at 10.4% FDR. The same search parameters, applied to (doubly-) specific peptide substrates (Table 1, Search #17), yielded 177 matched spectra at 0.73% FDR. We can therefore estimate the local-FDR of the 59 additional matched spectra due to the semi-specific peptides at about 40%. Clearly, further manual curation and filtering is required to select the approximately 36 presumed good spectra with matches to glycopeptides with semi-specific peptide substrates.
We adopt a conservative approach and find it works quite well to identify about the right number of likely true semi-specific glycopeptide spectrum matches. First, we consider only the 52 spectra with a single (up to topologically equivalent glycans) glycopeptide match that went unmatched when searching the human GlycO subset with default parameters. Next, we consider semi-specific peptide substrates for each of the N-linked haptoglobin glycosylation sites 184N, 207N, 211N, and 241N. We retain only the semi-specific peptides for which the glycan at the haptoglobin site was observed associated with a (doubly-) specific peptide substrate in Search #17. For example, the common (doubly-) specific glycopeptide match MVSHH184NLTTGATLINE-A2G2S2 at haptoglobin 184N provides evidence in support of the semi-specific peptide substrates MVSHH184NL and MVSHH184NLTTGAT which are observed paired with glycan A2G2S2, while glycopeptide match MVSHH184NLTTGATLINE-A2G2S1 provides evidence in support of semi-specific peptide MVSHH184NLTTG, which is observed paired with glycan A2G2S1. Similarly, the glycopeptide VVLHP241NYSQVDIGLIK-A2G2S2 provides support for semi-specific peptides KVVLHP241N YSQVD and VVLHP241N YSQVD, whose non-specific cleavage sites correspond to known, lower-efficiency, GluC cleavage activity. The remaining two haptoglobin sites' semi-specific peptides do not meet this criterion. Lastly, we consider only the semi-specific glycopeptides with the most common glycans for our dataset: A1G1S1, A2G1S1, A2G2S1, A2G2S2, A3G3S2, and A3G3S3. This restricted set of semi-specific peptide substrates and glycans represents 37 of the 59 additional spectra with glycopeptide matches due to semi-specific peptides, a good match to the local-FDR based estimate of the number of presumed good semi-specific glycopeptide matched spectra.
Proteomic Analysis of HILIC Enriched Fractions
In experimentally derived samples the protein composition may not be known a priori. Before application of GPS, it is necessary to establish the identity of glycoproteins that might plausibly contribute glycopeptides to the analysis and thereby verify that relatively few peptide substrates need to be distinguished. We analyze the (unglycosylated) peptide fragmentation spectra of our trypsin-GluC digest of commercially available haptoglobin standard to establish the feasibility of protein analysis from the HILIC enriched fractions. We apply the PepArML53 peptide identifications meta-search engine to the tandem mass-spectra, combining peptide identifications from multiple search engines to boost the peptide identification sensitivity of the analysis. PepArML assigns 168 peptide identifications at 1% spectral FDR (see methods), representing 23 distinct peptide sequences, all from haptoglobin – achieving 36% coverage of the haptoglobin sequence. While it is hardly surprising that haptoglobin is identified, this analysis demonstrates that despite the HILIC fractionation, which is intended to enrich glycopeptides, plenty of non-glycosylated peptides remain, and their identifications can be used to establish the protein composition of the abundant proteins in the sample. No peptides from other proteins were identified in this sample.
Sialylated Glycans
In order to further validate the glycopeptide spectrum matches generated by GPS we check that the matches are consistent with the expected behavior of HILIC fractionation used for glycopeptide enrichment, in which the (HILIC) retention time is affected by analyte polarity 54,55. In our glycopeptide analysis, the analytes' polarity is primarily determined by the glycan's sialic acid residues. As such, HILIC separation is expected to favor glycopeptides with fewer sialic acids in early HILIC fractions and glycopeptides with more sialic acids in later HILIC fractions.
To test the strength of the sialic acid/HILIC fraction relationship, we extracted the 195 high-quality glycopeptide matches from the GlycO subset of N-linked human GlycomeDB (Table 1, Search: #11, FDR 1.73%) with glycans A1G1S1, A2G2S1 (mono-sialylated); A2G2S2, A3G3S2 (di-sialylated); and A3G3S3 (tri-sialylated). Supplementary Figure 1 shows the number of spectra matched to these glycopeptides with one, two, or three sialic acids versus the HILIC fraction. We test these counts to determine whether the observed shift in HILIC fractions containing glycopeptides with 1, 2, and 3 sialic acids is statistically significant. We use a χ2-test to compare the distribution of counts across HILIC fractions for mono-sialylated vs. di-sialylated (p-value: 5.20 × 10⁻²³), tri-sialylated vs. di-sialylated (p-value: 4.74 × 10⁻⁷), and tri-sialylated vs. mono-sialylated (p-value: 1.83 × 10−37) glycans. These highly significant p-values indicate that the observed shift in the HILIC fractions based on number of sialic acid monosaccharides is highly unlikely to be the result of random variation, such as might be observed from glycopeptide identifications made by random matching of glycopeptides. We observe a similar effect when we consider sialylated glycans of a single peptide substrate.
Analysis of Trypsin Digest of Plasma-Derived Haptoglobin
We demonstrate the suitability of this workflow to glycoproteins purified in the laboratory with the analysis of eight HILIC-enriched tryptic digest of plasma-derived haptoglobin fractions. The plasma-derived haptoglobin MS/MS dataset consists of 2704 MS/MS spectra. First, we establish the glycoprotein composition of the plasma-derived haptoglobin sample. Proteomic analysis of the eight files from the plasma-derived haptoglobin was performed using PepArML53 (see methods), identifying 34 spectra as the haptoglobin peptide (SQVDIGLIK) at 1% FDR. Filtering the results at 10% FDR, an additional haptoglobin peptide could also be assigned for a total of 38 haptoglobin peptide identifications. Notably, no peptides from other proteins were identified at 1% FDR in this sample. Given the number of peptide identifications from the proteomic analysis of the commercial haptoglobin standard spectra, the absence of peptide identifications from other glycoproteins suggests that, if present, other glycoproteins are significantly less abundant than haptoglobin and their glycopeptides are unlikely to be observed. We analyzed the plasma-derived haptoglobin spectra using the default GPS parameters, except that the GlycO subset of the human Glycome-DB glycan database was searched, trypsin proteolysis selected, and peptide molecular weights were constrained between 400 and 3500 Da. This search matched 136 glycopeptide spectra representing 15 unique peptide-glycan pairs with an FDR of 0.4%.
To explore the potential for false positive haptoglobin glycopeptide identifications when the spectra are actually due to glycopeptides of other glycoproteins, we analyzed the plasma derived haptoglobin dataset using immunoglobulin gamma 1–3 (IgG1-3) heavy chain (P01857, P01859, P01860) sequences. In the absence of abundant non-haptoglobin glycoproteins identified in the proteomic analysis, these proteins are generally abundant in (unfractionated) plasma and therefore represent the most likely source of confounding glycopeptides. Analyzed using immunoglobulin gamma heavy chain protein sequences in place of the haptoglobin protein sequence, none of the spectra matching haptoglobin glycopeptides are assigned to IgG heavy chain glycopeptides. However, two previously unmatched spectra with similar retention times match the IgG1 heavy chain peptide TKPREEQY180NSTYR + FA2G2S2, with estimated FDR of 100%. Manual examination of this assignment indicates it is not correct, as the FDR of this search suggests. Finally, when the plasma-derived haptoglobin dataset is analyzed using haptoglobin and the three IgG heavy chain protein sequences together, the number of haptoglobin glycopeptide spectra matched is unchanged (none of the immunoglobulin glycopeptide identifications match haptoglobin glycopeptide spectra), with estimated FDR of 11.3%, reflecting the larger search space of putative peptide substrates. The entirety of this plasma-derived haptoglobin analysis demonstrates that haptoglobin glycopeptide assignments made using this workflow and the GPS software are unlikely to be false-positives due to the presence of other glycoproteins.
Discussion
These results demonstrate that purified proteins can be readily analyzed in a discovery-mode, high-throughput manner for the site-specific identification of glycan microheterogeneity using CID tandem mass spectrometry on modest instrumentation. A key component of this strategy includes the data-analysis techniques described here, which rapidly identify spectra likely to match glycopeptides, match the spectra to peptides from the (known) protein(s) of interest paired with glycans from a user-selected database of glycan structures, and estimate the error-rate of resulting glycopeptide-spectrum matches.
The limited number of peptide b- and y-ions in most CID glycopeptide spectra makes it challenging to confidently assert peptide identity. As we have described, our primary strategy for ascertaining the identity of the peptide substrate involves matching the theoretical peptide masses of motif-containing peptides to the putative peptide masses obtained from the intact-peptide ions in the CID spectra. We have demonstrated the effectiveness of this strategy for glycopeptides from a single protein. However, this strategy becomes problematic in complex samples when there are a large number of possible peptide substrates – consequently, we restrict our study of glycoprotein microheterogeneity to purified proteins.
In the analysis of poorly understood glycoprotein mixtures, however, it may not be possible to assert, ahead of time, the identity or complexity of the sample at hand, making it difficult to select a few specific proteins for the GPS search. We can work around this lack of fore-knowledge, as the glycoprotein digests still contain (polar) non-glycosylated peptides after enrichment using HILIC fractionation, and these can be identified using traditional peptide identification search engines to establish the abundant glycoproteins of the sample. While these concerns could be more thoroughly addressed using parallel proteomics analyses, this orthogonal analysis of the spectral data appears to be sufficient, as demonstrated by the proteomic analyses of the commercially available and plasma-derived haptoglobin datasets.
A more significant problem is the need to study glycopeptides resulting from non-specific or semi-specific proteolytic cleavage of glycoproteins. Semi-specific glycopeptides are challenging to confidently identify because searching in silico enumerated semi-specific cleavage peptides greatly increases the number of peptide substrates that must be considered and therefore increases the chance of random matches. While it is clearly beneficial to reliably generate specific (glyco-)protein digests, we have demonstrated that it is possible to deal with a larger peptide substrate search space, as long as other search parameters can be tightened to compensate. Although we have posed the issue in terms of the semi-specific peptides here, we submit that the same tradeoffs apply in other contexts for which there is a larger peptide search space, such as mixtures of more than one protein. We anticipate that the routine use of the GlycO glycan database and more accurate precursor and fragment ion measurements will significantly improve our ability to discriminate peptide substrate alternatives.
A further simplifying assumption in our data-analysis approach is to permit at most one glycan per peptide. We cannot preclude the possibility of a peptide with more than one N-glycan attached to different sites, but eliminating this case from consideration significantly simplifies the analysis. Since N-linked glycosylation sites are relatively sparse on glycoproteins, few tryptic peptides will contain more than one site – although, as demonstrated by human haptoglobin, it may be necessary to use an additional proteolytic enzyme to cut between nearby sites. The one glycan per peptide assumption means that we do not need the limited peptide b- and y-ion fragments to determine the glycan attachment site, and that the mass of the attached glycan can be inferred by subtraction of the peptide mass from the precursor mass. Partitioning the unaccounted-for mass between two or more glycans would be a very large expansion of the search space and require us to determine the best placement of the glycans, neither of which is really feasible for most CID glycopeptide fragmentation spectra given the lack of fragmentation of the peptide.
Recent efforts to centralize and unify structural knowledge of glycans offer new opportunities for use of glycan structure databases in research. The recent availability of GlycomeDB and its associated GlycO annotation have made a big difference in the success of this approach. This glycan structure database infrastructure, which captures most of the existing glycan structure databases in a common format, allows us to create a species limited set of glycans to examine, and with the advent of GlycO, even a way to focus on structures known to be consistent with glycan biosynthetic rules. Our use of glycan structure databases, rather than de novo glycan structure determination or combinatorial enumeration, allows the user more control over the glycan search space – even permitting user-drawn structures to be used. We note that in choosing this approach, we forgo the chance to identify novel glycan structures, trading this for increased identification specificity and known biological context. We expect that over time, biologically relevant glycan structures currently missing from glycan structure databases will be added and less common forms may be annotated with the molecular or disease context needed to explain their inclusion. Of course, any structure that can be explicitly described may be added to an in-house structure database for searching. The use of glycan structure databases as input to our search makes it possible for the user to focus their attention on known biology – limiting unnecessary glycan search space expansion. As demonstrated in the results, limiting the glycan search space can significantly improve the false discovery rate and eliminate many isobaric, but topologically distinct, glycan structures that otherwise cannot be distinguished.
Despite the relatively large number of glycan structures in GlycomeDB, we observe a great deal of redundancy at the level of topologically equivalent glycan structures. We have limited ability to distinguish these topologically equivalent structures in CID glycopeptide spectra, so we automatically collapse these to a single glycopeptide-spectrum match. As such, the space of reasonable glycan topologies is much smaller than might otherwise be guessed. However, we also find it difficult to discriminate isobaric, but topologically distinct, glycopeptides, such as the three structures with a single fucose monosaccharide placed at the core or on one of the two non-reducing arms of the A2G2S1 glycan. While we observe some fucose-containing oxonium ions in a limited number of spectra, we rarely observe fragment ions, such as the fucose containing B-ion at m/z 512 that would suggest which of these structures are present56. Indeed, we cannot discount the possibility that all three structures are present and their fragments aggregated in the spectrum. Given these difficulties, we have not yet found a reliable way to score and rank multiple glycopeptide matches to a spectrum – and have chosen to adopt a strategy in which most spectra match at most one glycopeptide, given the filtering thresholds. In particular, this approach necessitated the development of a novel FDR estimation strategy, quite different from the FDR estimation strategies used in peptide identification. We point out that because we do not attempt to score and rank individual glycopeptide hits, the specific placement of the glycan structure on the (motif-free) decoy peptides is not necessary.
Given the specific fragmentation characteristics of CID glycopeptide spectra, we do not believe this workflow and analysis technique can be appropriately applied to complex samples of many glycoproteins, but instead propose this approach be used to study glycan microheterogeneity on purified proteins. Crucial to the utility of this approach is the question of whether laboratory-purified protein samples derived from complex protein mixtures, which may contain unexpected or undesired proteins, in addition to the intended glycoprotein of interest, are simple enough, or whether contaminating proteins create the potential for false-positive glycopeptide identifications to the glycoprotein of interest. We used a serum-derived purified haptoglobin sample to demonstrate that this approach is feasible, for some glycoproteins. We stress that the estimation and control of the statistical significance of our glycopeptide identifications helps to control but does not measure the likelihood of false-positives; instead, the FDR estimates the proportion of random matches in the results. False-positive glycopeptides with identical fragments to true-positive glycopeptides are not random matches and the likelihood of these assignments is not included in the estimate of the glycopeptide false-discovery-rate. This is not unique to our approach – the same is true of the use of FDR in proteomic analyses, where lucine/isoleucine substitutions are not readily be distinguished. Despite these difficulties, the use of peptide identification statistical significance and false-discovery-rates has become extremely important in proteomic analysis and we expect them to be widely adopted in glycoprotein analysis too.
Conclusion
In this work, we have explored the algorithmic utility of using known characteristics of CID glycopeptide fragmentation spectra for identifying N-glycopeptides in large high-throughput LC-MS/MS glycopeptide datasets. Our implementation, GlycoPeptideSearch (GPS), is freely available, making it possible to search large N-glycopeptide CID MS/MS datasets and identify glycopeptides with less manual curation time – increasing the productivity of glycoprotein and glycopeptide analyses. GlycoPeptideSearch is available for download from http://edwardslab.bmcb.georgetown.edu/GPS and also from the GlycoPeptideSearch SourceForge project. The software requires user supplied protein sequence or a list of peptides for analysis of glycopeptide CID MS/MS datasets, and takes advantage of indexed glycan databases supplied with the software to pair MS/MS spectra with potential glycopeptide matches. Using documented characteristics of glycopeptide CID MS/MS spectra, the tool selects spectra for subsequent matching with a peptide-glycan pair consistent with the information available in a spectrum. Spectra are examined for the presence of oxonium ions, intact-peptide ions, glycan B ions, peptide b/y ions, and glycopeptide Y-ions with partially fragmented glycans. The precursor mass of the analyte is used to propose putative glycan-peptide pairs, and glycopeptide spectral matches are judged using a number of thresholds to improve their quality. One or more matches may be proposed for each spectrum. Precursor MS isotope clusters are also used to examine the quality of proposed glycopeptide matches. Finally, a novel method is used to estimate the FDR of matched spectra. Requiring observation of at least two intact-peptide peaks, setting thresholds for oxonium ion and intact-peptide ion peaks, and eliminating peptide-glycan pairs with poorly matching precursor isotope clusters allows us to reduce the false discovery rate of GPS.
We evaluated the performance of our approach on glycopeptide-enriched haptoglobin standard and plasma-derived haptoglobin samples subject to tryptic/GluC and trypsin digest respectively, followed by MS/MS analysis on a QTOF instrument with CID capability. We demonstrate that GPS makes it possible to survey glycan microheterogeneity at multiple glycosylation sites of a protein and to distinguish between glycans at different glycosylation sites of a protein.
Using only CID glycopeptide spectra, this workflow has achieved significant success in characterizing glycoforms of haptoglobin, including minor glycoforms, to gain greater understanding of haptoglobin microheterogeneity. However, alternating HCD/ETD workflows in the analysis of N-glycopeptides57 allows for monitoring of oxonium ions in the HCD spectra and provides information on the peptide backbone from the ETD spectra, which yield c- and z-ions. We expect that the addition of reliable peptide fragmentation information will significantly boost the power of our approach to distinguish peptide substrates and reduce false matches. We are presently exploring the integration of these fragmentation modes with GPS.
In this study we have focused on the interpretation of N-glycopeptide CID spectra. However, O-glycosylation is also important, and N- and some O-glycopeptide CID fragmentation spectra share a number of similarities, including the presence of oxonium ions and intact peptide peaks. As such, we plan to explore algorithmic techniques that would allow us to broaden our strategy to match CID glycopeptide spectra of O-glycopeptides. We will need to resolve a number of key issues, from the lack of comprehensive databases of O-glycans, to the increased number of potential glycosylation sites per protein and peptide, to accomplish this, but we are optimistic that our approach can be applied successfully to this setting, too.
We demonstrate that this workflow and algorithmic approach can successfully assign glycopeptides to CID tandem mass-spectra in real applications, in which the protein is purified from a complex mixture of proteins and glycoproteins, by analyzing a plasma-derived haptoglobin sample with GPS. We show that proteomics analysis can identify the abundant (glyco-)proteins of such samples, despite the HILIC fractionation used to enrich for glycopeptides, and that no other proteins, other than haptoglobin are apparent in the plasma-derived haptoglobin sample. Finally, we check that other abundant glycoproteins in plasma, namely IgG1-3, are not a source of glycopeptides observed in this dataset, and as such, we do not believe our haptoglobin assignments represent false-positive identifications that should be assigned to other glycoproteins.
This software enables informative characterization of glycosylation site microheterogeneity using data obtained from modest CID MS/MS instruments, which serves to emphasize that high-accuracy data is not required to make highly informative observations of glycoprotein microheterogeneity. High-throughput, site-specific analysis of protein glycosylation will significantly impact the study of protein glycosylation and microheterogeneity in normal physiological conditions and in disease, and we anticipate tools like GlycoPeptideSearch will make this possible.
Supplementary Material
Acknowledgments
KBC is supported by a Graduate Research Fellowship from the National Science Foundation. This work was supported in part by U01 CA168926 and RO1 CA135069 awarded to RG and the CCSG grant NIH P30 CA51008 to the Lombardi Comprehensive Cancer Center supporting the Proteomics and Metabolomics Shared Resource.
Abbreviations
- Hex
Hexose
- HexNAc
N-acetylhexosamine
- Man
Mannose
- Gal
Galactose
- GlcNAc
N-acetylglucosamine
- GluC
Endoproteinase GluC
- GalNAc
N-acetylgalactosamine
- Neu5Ac
N-Acetylneuraminic acid
- PNGase F
peptide N-glycosidase F
- GPSM
Glycopeptide spectral match
- FDR
False Discovery Rate
- CID
Collision-Induced Dissociation
- m/z
Mass to charge ratio
- XIC
Extracted ion chromatogram
Reference List
- 1.Yurist-Doutsch S, Chaban B, VanDyke DJ, Jarrell KF, Eichler J. Sweet to the extreme: protein glycosylation in Archaea. Mol Microbiol. 2008;68(5):1079–1084. doi: 10.1111/j.1365-2958.2008.06224.x. [DOI] [PubMed] [Google Scholar]
- 2.Apweiler R, Hermjakob H, Sharon N. On the frequency of protein glycosylation, as deduced from analysis of the SWISS-PROT database. Biochim. Biophys. Acta. 1999;1473(1):4–8. doi: 10.1016/s0304-4165(99)00165-8. [DOI] [PubMed] [Google Scholar]
- 3.Khoury GA, Baliban RC, Floudas CA. Proteome-wide post-translational modification statistics: frequency analysis and curation of the swiss-prot database. Sci. Rep. 2011;1 doi: 10.1038/srep00090. [DOI] [PMC free article] [PubMed] [Google Scholar]
- 4.Yamashina I, Makino M. The properties of a carbohydrate amino acid complex from ovalbumin. J. Biochem. 1962;51:359–364. [PubMed] [Google Scholar]
- 5.Marks GS, Marshall RD, Neuberger A. Carbohydrates in protein. 6. Studies on the carbohydrate-peptide bond in hen's-egg albumin. Biochem. J. 1963;87(2):274–281. doi: 10.1042/bj0870274. [DOI] [PMC free article] [PubMed] [Google Scholar]
- 6.Marshall R. Abstr. Int.Congr.Biochem. 7th 1967. pp. 573–574. [Google Scholar]
- 7.Cunningham LW, Clouse RW, Ford JD. Heterogeneity of the Carboyhdrate Moiety of Crystalline Ovalbumin. Biochim. Biophys. Acta. 1963;78:379–381. doi: 10.1016/0006-3002(63)91652-4. [DOI] [PubMed] [Google Scholar]
- 8.Paulson JC, Weinstein J, Schauer A. Tissue-specific expression of sialyltransferases. J. Biol. Chem. 1989;264(19):10931–10934. [PubMed] [Google Scholar]
- 9.Winder A, Smithers N, Witham S, Symons A, Edbrooke M. Tissue specific expression of the human alpha(1–3) fucosyltransferase gene family. Biochem. Soc. Trans. 1995;23(2):165S. doi: 10.1042/bst023165s. [DOI] [PubMed] [Google Scholar]
- 10.Renaudineau Y, Saraux A, Dueymes M, Le GP, Youinou P. Importance of IgG glycosylation in rheumatoid arthritis. Rev. Rhum. Engl. Ed. 1998;65(6):429–433. [PubMed] [Google Scholar]
- 11.Dennis JW, Laferte S. Oncodevelopmental expression of–GlcNAc beta 1-6Man alpha 1-6Man beta 1--branched asparagine–linked oligosaccharides in murine tissues and human breast carcinomas. Cancer Res. 1989;49(4):945–950. [PubMed] [Google Scholar]
- 12.Freeze HH. Congenital Disorders of Glycosylation: CDG-I, CDG-II, and beyond. Curr. Mol Med. 2007;7(4):389–396. doi: 10.2174/156652407780831548. [DOI] [PubMed] [Google Scholar]
- 13.Vigerust DJ, Shepherd VL. Virus glycosylation: role in virulence and immune interactions. Trends Microbiol. 2007;15(5):211–218. doi: 10.1016/j.tim.2007.03.003. [DOI] [PMC free article] [PubMed] [Google Scholar]
- 14.Rambaruth ND, Dwek MV. Cell surface glycan-lectin interactions in tumor metastasis. Acta Histochem. 2011;113(6):591–600. doi: 10.1016/j.acthis.2011.03.001. [DOI] [PubMed] [Google Scholar]
- 15.Nakano M, Nakagawa T, Ito T, Kitada T, Hijioka T, Kasahara A, Tajiri M, Wada Y, Taniguchi N, Miyoshi E. Site-specific analysis of N-glycans on haptoglobin in sera of patients with pancreatic cancer: a novel approach for the development of tumor markers. Int. J. Cancer. 2008;122(10):2301–2309. doi: 10.1002/ijc.23364. [DOI] [PubMed] [Google Scholar]
- 16.Nwosu CC, Seipert RR, Strum JS, Hua SS, An HJ, Zivkovic AM, German BJ, Lebrilla CB. Simultaneous and extensive site-specific N- and O-glycosylation analysis in protein mixtures. J. Proteome. Res. 2011;10(5):2612–2624. doi: 10.1021/pr2001429. [DOI] [PMC free article] [PubMed] [Google Scholar]
- 17.Pompach P, Chandler KB, Lan R, Edwards N, Goldman R. Semi-automated identification of N-glycopeptides by hydrophilic interaction chromatography, nano-reverse phase LC-MS/MS, and glycan database search. J. Proteome. Res. 2012;11(3):1728–1740. doi: 10.1021/pr201183w. [DOI] [PMC free article] [PubMed] [Google Scholar]
- 18.Ceroni A, Maass K, Geyer H, Geyer R, Dell A, Haslam SM. GlycoWorkbench: a tool for the computer-assisted annotation of mass spectra of glycans. J. Proteome. Res. 2008;7(4):1650–1659. doi: 10.1021/pr7008252. [DOI] [PubMed] [Google Scholar]
- 19.Goldberg D, Sutton-Smith M, Paulson J, Dell A. Automatic annotation of matrix-assisted laser desorption/ionization N-glycan spectra. Proteomics. 2005;5(4):865–875. doi: 10.1002/pmic.200401071. [DOI] [PubMed] [Google Scholar]
- 20.Apte A, Meitei NS. Bioinformatics in glycomics: glycan characterization with mass spectrometric data using SimGlycan. Methods Mol Biol. 2010;600:269–281. doi: 10.1007/978-1-60761-454-8_19. [DOI] [PubMed] [Google Scholar]
- 21.Cooper CA, Gasteiger E, Packer NH. GlycoMod--a software tool for determining glycosylation compositions from mass spectrometric data. Proteomics. 2001;1(2):340–349. doi: 10.1002/1615-9861(200102)1:2<340::AID-PROT340>3.0.CO;2-B. [DOI] [PubMed] [Google Scholar]
- 22.Goldberg D, Bern M, Parry S, Sutton-Smith M, Panico M, Morris HR, Dell A. Automated N-glycopeptide identification using a combination of single- and tandem-MS. J. Proteome. Res. 2007;6(10):3995–4005. doi: 10.1021/pr070239f. [DOI] [PubMed] [Google Scholar]
- 23.Peltoniemi H, Joenvaara S, Renkonen R. De novo glycan structure search with the CID MS/MS spectra of native N-glycopeptides. Glycobiology. 2009;19(7):707–714. doi: 10.1093/glycob/cwp034. [DOI] [PubMed] [Google Scholar]
- 24.Deshpande N, Jensen PH, Packer NH, Kolarich D. GlycoSpectrumScan: fishing glycopeptides from MS spectra of protease digests of human colostrum sIgA. J. Proteome. Res. 2010;9(2):1063–1075. doi: 10.1021/pr900956x. [DOI] [PubMed] [Google Scholar]
- 25.Ren JM, Rejtar T, Li L, Karger BL. N-Glycan structure annotation of glycopeptides using a linearized glycan structure database (GlyDB) J Proteome. Res. 2007;6(8):3162–3173. doi: 10.1021/pr070111y. [DOI] [PMC free article] [PubMed] [Google Scholar]
- 26.Joenvaara S, Ritamo I, Peltoniemi H, Renkonen R. N-glycoproteomics - an automated workflow approach. Glycobiology. 2008;18(4):339–349. doi: 10.1093/glycob/cwn013. [DOI] [PubMed] [Google Scholar]
- 27.Kiehne A, Resemann A, Schweiger-Hufnagel U, Asperger A, Suckau D. Automatic MS/MS characterization of N-linked glycopeptides. Poster session presented at: 59th ASMS Conference on Mass Spectrometry and Allied Topics; Denver, CO. 2011 Jun 5–9. [Google Scholar]
- 28.Dallas DC, Martin WF, Hua S, German JB. Automated glycopeptide analysis--review of current state and future directions. Brief. Bioinform. 2012 doi: 10.1093/bib/bbs045. [DOI] [PMC free article] [PubMed] [Google Scholar]
- 29.Harvey DJ, Merry AH, Royle L, Campbell MP, Dwek RA, Rudd PM. Proposal for a standard system for drawing structural diagrams of N- and O-linked carbohydrates and related compounds. Proteomics. 2009;9(15):3796–3801. doi: 10.1002/pmic.200900096. [DOI] [PubMed] [Google Scholar]
- 30.Wuhrer M, Catalina MI, Deelder AM, Hokke CH. Glycoproteomics based on tandem mass spectrometry of glycopeptides. J. Chromatogr. B Analyt. Technol. Biomed. Life Sci. 2007;849(1–2):115–128. doi: 10.1016/j.jchromb.2006.09.041. [DOI] [PubMed] [Google Scholar]
- 31.Huddleston MJ, Bean MF, Carr SA. Collisional fragmentation of glycopeptides by electrospray ionization LC/MS and LC/MS/MS: methods for selective detection of glycopeptides in protein digests. Anal. Chem. 1993;65(7):877–884. doi: 10.1021/ac00055a009. [DOI] [PubMed] [Google Scholar]
- 32.Hunter AP, Games DE. Evaluation of glycosylation site heterogeneity and selective identification of glycopeptides in proteolytic digests of bovine alpha 1-acid glycoprotein by mass spectrometry. Rapid Commun. Mass Spectrom. 1995;9(1):42–56. doi: 10.1002/rcm.1290090111. [DOI] [PubMed] [Google Scholar]
- 33.Conboy JJ, Henion J. The determination of glycopeptides by liquid chromatography/mass spectrometry with collision-induced dissociation. J Am Soc Mass Spec. 1992;(3):804–814. doi: 10.1016/1044-0305(92)80003-4. [DOI] [PubMed] [Google Scholar]
- 34.Carr SA, Huddleston MJ, Bean MF. Selective identification and differentiation of N- and O-linked oligosaccharides in glycoproteins by liquid chromatography-mass spectrometry. Protein Sci. 1993;2(2):183–196. doi: 10.1002/pro.5560020207. [DOI] [PMC free article] [PubMed] [Google Scholar]
- 35.Harvey DJ, Mattu TS, Wormald MR, Royle L, Dwek RA, Rudd PM. “Internal residue loss”: rearrangements occurring during the fragmentation of carbohydrates derivatized at the reducing terminus. Anal. Chem. 2002;74(4):734–740. doi: 10.1021/ac0109321. [DOI] [PubMed] [Google Scholar]
- 36.Wuhrer M, Koeleman CA, Hokke CH, Deelder AM. Mass spectrometry of proton adducts of fucosylated N-glycans: fucose transfer between antennae gives rise to misleading fragments. Rapid Commun. Mass Spectrom. 2006;20(11):1747–1754. doi: 10.1002/rcm.2509. [DOI] [PubMed] [Google Scholar]
- 37.Pompach P, Brnakova Z, Sanda M, Wu J, Edwards N, Goldman R. Site specific glycoforms of haptoglobin in liver cirrhosis and hepatocellular carcinoma. Mol Cell Proteomics. 2013 doi: 10.1074/mcp.M112.023259. [DOI] [PMC free article] [PubMed] [Google Scholar]
- 38.Sanda M, Pompach P, Brnakova Z, Wu J, Makambi K, Goldman R. Quantitative LC-MS-MRM analysis of site-specific glycoforms of haptoglobin in liver disease. Mol Cell Proteomics. 2013 doi: 10.1074/mcp.M112.023325. [DOI] [PMC free article] [PubMed] [Google Scholar]
- 39.Ranzinger R, Herget S, Wetter T, von der Lieth CW. GlycomeDB - integration of open-access carbohydrate structure databases. BMC. Bioinformatics. 2008;9:384. doi: 10.1186/1471-2105-9-384. [DOI] [PMC free article] [PubMed] [Google Scholar]
- 40.Ranzinger R, Frank M, von der Lieth CW, Herget S. Glycome-DB.org: a portal for querying across the digital world of carbohydrate sequences. Glycobiology. 2009;19(12):1563–1567. doi: 10.1093/glycob/cwp137. Glycome-DB.org [DOI] [PubMed] [Google Scholar]
- 41.Doubet S, Bock K, Smith D, Darvill A, Albersheim P. The Complex Carbohydrate Structure Database. Trends Biochem. Sci. 1989;14(12):475–477. doi: 10.1016/0968-0004(89)90175-8. [DOI] [PubMed] [Google Scholar]
- 42.Raman R, Venkataraman M, Ramakrishnan S, Lang W, Raguram S, Sasisekharan R. Advancing glycomics: implementation strategies at the consortium for functional glycomics. Glycobiology. 2006;16(5):82R–90R. doi: 10.1093/glycob/cwj080. [DOI] [PubMed] [Google Scholar]
- 43.von der Lieth CW, Freire AA, Blank D, Campbell MP, Ceroni A, Damerell DR, Dell A, Dwek RA, Ernst B, Fogh R, Frank M, Geyer H, Geyer R, Harrison MJ, Henrick K, Herget S, Hull WE, Ionides J, Joshi HJ, Kamerling JP, Leeflang BR, Lutteke T, Lundborg M, Maass K, Merry A, Ranzinger R, Rosen J, Royle L, Rudd PM, Schloissnig S, Stenutz R, Vranken WF, Widmalm G, Haslam SM. EUROCarbDB: An open-access platform for glycoinformatics. Glycobiology. 2011;21(4):493–502. doi: 10.1093/glycob/cwq188. [DOI] [PMC free article] [PubMed] [Google Scholar]
- 44.Lutteke T, Bohne-Lang A, Loss A, Goetz T, Frank M, von der Lieth CW. GLYCOSCIENCES.de: an Internet portal to support glycomics and glycobiology research. Glycobiology. 2006;16(5):71R–81R. doi: 10.1093/glycob/cwj049. [DOI] [PubMed] [Google Scholar]
- 45.Hashimoto K, Goto S, Kawano S, Aoki-Kinoshita KF, Ueda N, Hamajima M, Kawasaki T, Kanehisa M. KEGG as a glycome informatics resource. Glycobiology. 2006;16(5):63R–70R. doi: 10.1093/glycob/cwj010. [DOI] [PubMed] [Google Scholar]
- 46.Herget S, Ranzinger R, Maass K, Lieth CW. GlycoCT-a unifying sequence format for carbohydrates. Carbohydr. Res. 2008;343(12):2162–2171. doi: 10.1016/j.carres.2008.03.011. [DOI] [PubMed] [Google Scholar]
- 47.Thomas CJ, Sheth AP, York WS. Molecular ontology design using canonical building blocks in the biochemistry domain. Proceedings of the International Conference on Formal Ontology in Information Systems; 11-9-2006. [Google Scholar]
- 48.Kessner D, Chambers M, Burke R, Agus D, Mallick P. ProteoWizard: open source software for rapid proteomics tools development. Bioinformatics. 2008;24(21):2534–2536. doi: 10.1093/bioinformatics/btn323. [DOI] [PMC free article] [PubMed] [Google Scholar]
- 49.Ceroni A, Dell A, Haslam SM. The GlycanBuilder: a fast, intuitive and flexible software tool for building and displaying glycan structures. Source. Code. Biol. Med. 2007;2:3. doi: 10.1186/1751-0473-2-3. [DOI] [PMC free article] [PubMed] [Google Scholar]
- 50.Nilsson J, Ruetschi U, Halim A, Hesse C, Carlsohn E, Brinkmalm G, Larson G. Enrichment of glycopeptides for glycan structure and attachment site identification. Nat. Methods. 2009;6(11):809–811. doi: 10.1038/nmeth.1392. [DOI] [PubMed] [Google Scholar]
- 51.Wang D, Hincapie M, Rejtar T, Karger BL. Ultrasensitive characterization of site-specific glycosylation of affinity-purified haptoglobin from lung cancer patient plasma using 10 mum i.d. porous layer open tubular liquid chromatography-linear ion trap collision-induced dissociation/electron transfer dissociation mass spectrometry. Anal. Chem. 2011;83(6):2029–2037. doi: 10.1021/ac102825g. [DOI] [PMC free article] [PubMed] [Google Scholar]
- 52.Carlsson MC, Cederfur C, Schaar V, Balog CI, Lepur A, Touret F, Salomonsson E, Deelder AM, Ferno M, Olsson H, Wuhrer M, Leffler H. Galectin-1-binding glycoforms of haptoglobin with altered intracellular trafficking, and increase in metastatic breast cancer patients. PLoS. One. 2011;6(10):e26560. doi: 10.1371/journal.pone.0026560. [DOI] [PMC free article] [PubMed] [Google Scholar]
- 53.Edwards N, Wu X, Tseng CW. An unsupervised, model-free, machine-learning combiner for peptide identifications from tandem mass spectra. Clinical Proteomics. 2009;5(1):23–36. [Google Scholar]
- 54.Gilar M, Jaworski A. Retention behavior of peptides in hydrophilic-interaction chromatography. J. Chromatogr. A. 2011;1218(49):8890–8896. doi: 10.1016/j.chroma.2011.04.005. [DOI] [PubMed] [Google Scholar]
- 55.Gilar M, Yu YQ, Ahn J, Xie H, Han H, Ying W, Qian X. Characterization of glycoprotein digests with hydrophilic interaction chromatography and mass spectrometry. Anal. Biochem. 2011;417(1):80–88. doi: 10.1016/j.ab.2011.05.028. [DOI] [PubMed] [Google Scholar]
- 56.Toyama A, Nakagawa H, Matsuda K, Sato TA, Nakamura Y, Ueda K. Quantitative structural characterization of local N-glycan microheterogeneity in therapeutic antibodies by energy-resolved oxonium ion monitoring. Anal. Chem. 2012;84(22):9655–9662. doi: 10.1021/ac3023372. [DOI] [PubMed] [Google Scholar]
- 57.Singh C, Zampronio CG, Creese AJ, Cooper HJ. Higher energy collision dissociation (HCD) product ion-triggered electron transfer dissociation (ETD) mass spectrometry for the analysis of N-linked glycoproteins. J. Proteome. Res. 2012;11(9):4517–4525. doi: 10.1021/pr300257c. [DOI] [PubMed] [Google Scholar]
Associated Data
This section collects any data citations, data availability statements, or supplementary materials included in this article.