

Abstract
Background
Bioimpedance analysis has found utility in many fields of medical research, yet instrumentation can be expensive and/or complicated to build. Advancements in electronic component design and equipment allow for simple bioimpedance analysis using equipment now commonly found in an engineering lab, combined with a few components exclusive to impedance analysis.
Materials and methods
A modified Howland bridge circuit was designed on a small circuit board with connections for power and bioimpedance probes. A programmable function generator and an oscilloscope were connected to a laptop computer and were tasked to drive and receive data from the circuit. The software then parsed the received data and inserted it into a spreadsheet for subsequent data analysis. The circuit was validated by testing its current output over a range of frequencies and comparing measured values of impedance across a test circuit to expected values.
Results
The system was validated over frequencies between 1 and 100 kHz. Maximum fluctuation in current was on the order of micro-Amperes. Similarly, the measured value of impedance in a test circuit followed the pattern of actual impedance over the range of frequencies measured.
Conclusions
Contemporary generation electronic measurement equipment provides adequate levels of connectivity and programmability to rapidly measure and record data for bioimpedance research. These components allow for the rapid development of a simple but accurate bioimpedance measurement system that can be assembled by individuals with limited knowledge of electronics or programming.
Keywords: Bioimpedance, Instrumentation, Current source, Design
INTRODUCTION
Electrical impedance of biological tissue has been a subject of research for more than 40 y [1, 2] with applications ranging from respiratory plethysmography [3] to cardiac stroke volume measurement [4] to detection of bladder cancer [5]. Original bioimpedance analyzers were cumbersome, requiring careful matching of resistors and a large overall number of components. Currently, advancement in miniaturization techniques and improvements in component accuracy make the design and fabrication of a bioimpedance analyzer much simpler [6]. Devices such as oscilloscopes and function generators now include connectivity to a host PC and are now able to be programmed using a simple graphical programming language.
Electrical impedance (Z) is a measure of the opposition to electrical flow through a substance. This value can be broken down into 2 elements, resistance (R) and reactance (Xc). Resistance has passive characteristics, in that its value does not change with frequency. Alternatively, the value of reactance does change with frequency and is found in sources of capacitance. The conventional electrical model for tissue includes resistors and capacitors, as shown in Fig. 1. Therefore, both resistive and reactive components are present in tissue.
FIG. 1.
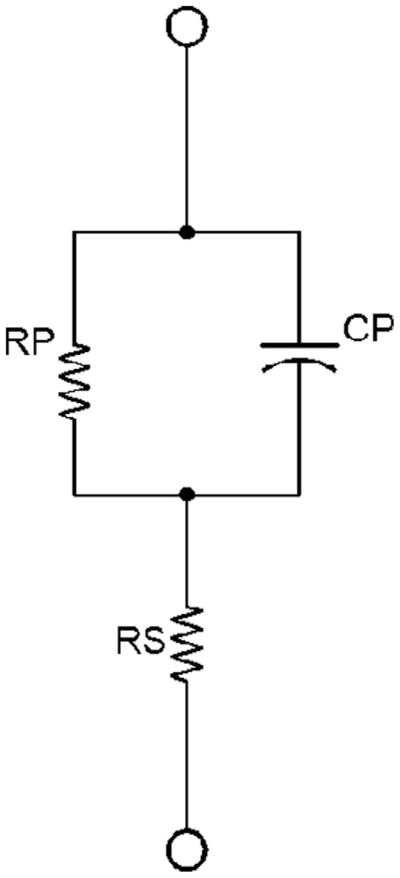
A simple model used to replicate impedance in tissue. RS and RP are the series and parallel resistance components, and CP is the parallel capacitance component. This circuit was used in the calibration and verification of the VCCS.
The value of impedance is conventionally represented as a complex number, with the real component being resistance and the complex component being reactance (Z = r + Xci). Alternatively, polar coordinates can be used with resistance and reactance being Z cos(θ) and Z sin(θ), respectively, where Z is the magnitude of the impedance and θ is the phase angle. Fig. 2 gives a graphical representation of impedance and its components.
FIG. 2.

The impedance vector Z can be split up into real and imaginary components R and XC, respectively. Phase angle is labeled as θ. By measuring the impedance and resulting phase angle, a polar representation of the impedance vector is created, and with simple trigonometry, the separation of resistance and reactance can be determined.
Measurement of electrical impedance takes advantage of the relationship between impedance, voltage, and current. Ohm’s law states the relation V = IZ, where V is voltage, I is current, and Z is impedance. By injecting a controlled amount of current into a section of tissue, the resulting voltage across that tissue provides an easily acquired signal for recording and subsequent analysis. Alternating current (AC) is used as the source of electrical current because it prevents iontophoresis and allows determination of the phase angle shift, a property that cannot be measured if direct current (DC) is used. Modern oscilloscopes have the ability to automatically measure phase angle differences between 2 signals. Knowledge of the amount of injected current, the subsequent voltage generated, and the phase angle allows one to fully characterize the impedance profile of the tissue being examined.
A pilot study was recently performed at our institution to examine the bioimpedance properties of brain tissue subjected to traumatic brain injury (unpublished data). Our laboratory first used impedance analysis to examine the change in impedance within edematous intestinal tissue [7]. Originally, the design of the impedance measuring system required manual switching of frequencies and recording of voltages. The system described in this article automates the sequence, resulting in a significant reduction in measurement time. It also organizes the data in a spreadsheet for easy analysis.
This article describes the materials and methodology for an individual with little background in designing bio-impedance instrumentation to build and operate a system that measures tissue impedance, specifically in the brain. The system consists of a custom-designed circuit board, a programmable function generator, and an oscilloscope in conjunction with a laptop computer. This system differs from others found in literature by using common “off the shelf” equipment instead of single-application devices or microcontrollers that require embedded programming experience, while still providing suitable mobility. This system represents the first step toward developing a multi-electrode system that will perform impedance analysis of a region of brain tissue that could discriminate between areas of injury and noninjury. The combination of existing equipment with the relatively simple nature of the circuit design make the assembly of such a system relatively easy for individuals not specialized in electronics.
MATERIALS AND METHODS
The bioimpedance analyzer system consists of 5 major components: a DC power supply, a programmable function generator, a programmable oscilloscope, a custom-designed circuit board, and a laptop computer. Fig. 3 gives graphical representation of these components in a block diagram, with a comprehensive list given in Table 1. All but one of these items exist as an off the shelf, “plug and play” component, thereby lowering the complexity of the system.
FIG. 3.
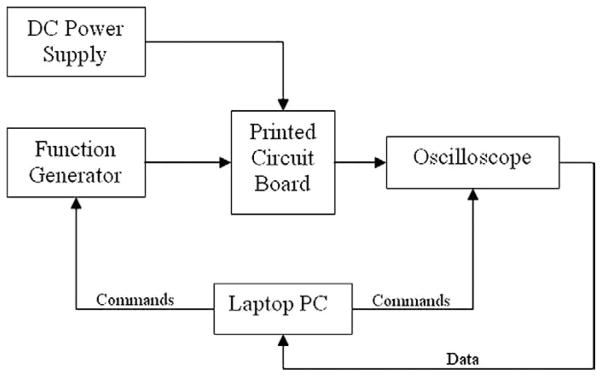
Block diagram describing major components of the bio-impedance measurement system. A Printed Circuit Board (PCB) contains the current source and connections for the electrode probes. Attached to the PCB are a DC power supply, function generator, and an oscilloscope, which are controlled and monitored by a program running on a laptop PC. Data from the experiment is automatically uploaded to the laptop throughout the measurement.
TABLE 1.
List of Major Components in System
| Components of system |
|---|
| Agilent MSO6032A Oscilloscope |
| Agilent 3320A Function Generator |
| DC Power Supply |
| Printed Circuit Board |
| Dell Latitude Laptop Computer |
Impedance Measurement Circuit Topology
A modified Howland voltage controlled current source (VCCS) was used as the means of supplying a controllable current for measuring impedance. As the name suggests, the VCCS provides a constant current based on the amount of voltage applied at the input to the circuit. A schematic of the circuit is shown in Fig. 4, and a list of components is presented in Table 2. The circuit is composed of 2 stages, the first being an instrumentation amplifier (INA128P; Texas Instruments, Dallas, TX) that acts as a preamplifier and eliminates any common mode noise present in the input signals. The output of the instrumentation amplifier then enters the Howland current source circuit. Two low-noise operational amplifiers (LF412CN; National Semiconductor, Santa, Clara, CA) are used in the design. Critical design components include the matching of resistors R1, R2, R3, R4, and the addition of capacitors C1 and C2 to prevent unwanted oscillations. The expected transfer function for the circuit is Itissue = 2*(Vin/R5).
FIG. 4.

Schematic of the modified Howland Voltage Controlled Current Source (VCCS). An instrumentation amplifier is used as a preamplifier to the signal entering the circuit from an external function generator. The signal then enters the actual Howland bridge, which consists of 2 operational amplifiers and a few resistors and capacitors. The output of the circuit is connected to the electrode pair that will actually measure tissue impedance through an oscilloscope probe that measures the voltage across the 2 electrodes. This schematic and the PCB layout file are available online at http://www.uth.tmc.edu/pediresearch under howlandbridge.sch and edemameter.v123, respectively.
TABLE 2.
List of Components in Printed Circuit Board
| Component | Manufacturer | Number |
|---|---|---|
| INA128P Instrumentation Amplifier | Texas Instruments | 1 |
| LF412 CN Dual Amplifier | National Semiconductor | 1 |
| 0.1 μF X7R Ceramic Capacitor | Vishay | 3 |
| 10 kΩ Metal Film Resistor 1% | Digi-Key | 4 |
| 51 kΩ Metal Film Resistor 1% | Digi-Key | 2 |
A DC power supply (XP-581; Elenco Precision, Wheeling, IL) provided ± 12 V to power the circuit. Since there is no direct control of this component, any DC power supply that can provide both +12 V and −12 V will be suitable.
The 2 outputs are connected to a probe consisting of 2 platinum electrodes (MS303-6A; Plastics One Inc., Roanoke, VA). The probe for the oscilloscope is also connected across these 2 outputs and will measure the resulting voltage from the injection of current into the tissue.
Input/Output Hardware
To drive and record the response of the circuit, both a function generator and an oscilloscope were controlled by software on a laptop computer to inject current at various frequencies. The software allows for customization of the waveform and also makes data collection and storage very simple by exporting data directly to standard spreadsheet format. A function generator (33220A; Agilent Technologies, Santa Clara, CA) was used to provide the input voltage signal to the VCCS. A mixed signal oscilloscope (MSO6032A; Agilent Technologies) measured and recorded voltage and phase angle data from the signal across the 2 electrodes. These devices are accurate both in generating a signal as well as in measuring voltage, with 300-MHz bandwidth and 12 bits of resolution on the oscilloscope. High bandwidth and resolution allows for the recording of smooth waveforms. The large input impedance of the oscilloscope probe minimizes the influence of the measuring device as a current pathway.
Software Programming
Both the oscilloscope and the function generator were connected to a laptop computer (Dell Latitude, 1 GHz CPU, 256 MB RAM, Windows XP) via USB cables. The control software (VEE Pro 8.0, Agilent Technologies) was loaded onto the computer. This software allows the user to control supported electronic equipment attached to the host computer, allowing duplex communication for both sending commands and receiving data. The software also communicates with spreadsheet software (Microsoft Excel) to automatically generate spreadsheets with the data measured. Programs are developed in an intuitive graphical format using “lines” of data and commands connecting different module and subroutine “boxes.” Fig. 5 shows how the program is structured within VEE. A front panel graphical user interface is also able to be generated to allow for user input during execution of the program and is shown in Fig. 6. Copies of the VEE software code used for this design are available online at www.uth.tmc.edu/pediresearch under brainimpedanceprogram.vee.
FIG. 5.

Layout of the VEE program used to control hardware. The program consists of graphical modules that represent commands, data structures such as arrays, and elements that make up the graphical user interface (GUI). Within this environment, the user can customize the frequencies over which impedance measurements are taken, as well as other attributes such as the duration of sampling and the order in which samples are taken. The file containing this program can be found at the following URL: http://www.uth.tmc.edu/pediresearch under the filename brainimpedanceprogram.vee. (Color version of figure is available online.)
FIG. 6.

The front panel of the program where the user selects the test method and test subject. The front panel is designed to simplify the measurement process, resulting in faster and more efficient data collection. Feedback on the frequency being used and the resulting RMS value can be shown on this screen if preferred.
For each frequency, the oscilloscope measures root-mean-squared (RMS) voltage and phase shift of the signal relative to the input signal. RMS voltage is commonly used to describe the amplitude of AC signals. The average RMS and phase shift for each frequency are then sent to the computer and transferred to the spreadsheet. Once the testing is complete on the particular section, the program automatically saves the spreadsheet data and closes the Excel program.
RESULTS
Calibration
The constant current driver circuit was tested to determine its ability to deliver current to the tissue being sampled over the range of frequencies used in the measurement profile. A digital multimeter was placed in series with the section of the circuit where a constant current was intended to pass in a no-load configuration. The multimeter was set to AC current mode, and the value of current was recorded after the reading stabilized at each frequency. Fig. 7 shows the current profile over the frequency range. Note that only the x-axis is in a logarithmic scale. The fluctuation of current levels is on the order of microamperes and is quite stable between 1 and 100 kHz. Knowledge of the current profile allows the user to make a determination of the actual value of impedance in the tissue.
FIG. 7.

No-Load current response of the constant current driver circuit. A multimeter was placed in series between the 2 electrodes and measured the current produced over a range of frequencies from 150 Hz to 500 kHz. The current varies from 49 μA at 100 Hz to 15 μA at 500 kHz. However, current remains rather constant between 1 kHz and 100 kHz. (Color version of figure is available online.)
To verify the accuracy and repeatability of the device, a test circuit model of tissue was set up using precision metal film resistors and X7R ceramic capacitors. The model is identical to the schematic shown in Fig. 1, with Rp, Rs, and Cp being 21 k Ω, 1.5 k Ω, and 0.1 μF, respectively. This model allows for a comparison of measured impedance versus the theoretical value that is assumed as the truth. This test circuit was placed between the 2 electrodes and tested at each of the frequencies. Fig. 8 shows the derived impedance values after correcting for the deviations in supply current.
FIG. 8.

Measured voltage of test circuit versus expected values. Expected values were derived from the measured values of individual resistance and capacitance elements in the test circuit and applied to the governing equations of Ohm’s Law to determine the frequency based impedance. The measured impedance was simply the measured RMS voltage divided by the current injected into the tissue by the circuit. The value of injected current was referenced from the corresponding value shown in Fig. 7. Deviation is relatively large from 100 Hz to 10 kHz but corresponds well between 10 and 500 kHz. (Color version of figure is available online.)
Improvements in Performance Using Ultra Precise Resistors
Surface mount resistors (0.1%) were tested to determine if using high tolerance resistors in the VCCS could improve the profile of current throughout the range of relevant frequencies. Fig. 9 shows the comparison of the no-load current profiles for both the 1% tolerance resistors and the 0.1% tolerance resistors. Minimal improvement can be seen in that there is still fluctuation in the amount of injected current outside the bounds of 1 and 100 kHz.
FIG. 9.

Comparison of the no-load current response between 1% tolerance resistors and 0.1% tolerance resistors shows a minimal difference. The variations present below 1 kHz and above 100 kHz are present for both types of resistors and could be attributed to the performance of the operational amplifiers. Matched values of resistors are an important requirement of this circuit design; so the use of high precision resistors on the order of 1% or less tolerance is highly recommended. (Color version of figure is available online.)
DISCUSSION
We have shown that an accurate bioimpedance analyzer can be fabricated using standard pieces of equipment (except the circuit board), and that the output of the system is appropriate for bioimpedance analysis. Entry level investigations using small animal experimentation can apply this system setup to perform proof of concept experiments before investing in or building a system that is either expensive or requires a solid background in electronics and programming.
The major advantage to this method over the older, more conventional method of manually changing the frequency and recording the RMS voltage and phase shift by hand is the speed in which measurements can be taken. The protocols of many brain impedance experiments require the brain to be exposed through craniotomy. Rapid measurement of impedance in several regions is important before dehydration of brain tissue reduces tissue water percentage, changing impedance. The automated method allows for compression of the testing cycle that may yield more scientifically relevant data.
Many articles have suggested and adopted the use of 4 electrodes to eliminate spurious readings of impedance when a bipolar electrode system is used, based in large part to the polarization of electrodes that occur when current is injected through the same electrodes that measure voltage [2, 8]. The decision was made to use only 2 electrodes to limit trauma to the area being tested, since the source of experimental variation was traumatic brain injury. Introducing 2 more needle electrodes in the small test area of the brain could result in excessive damage to brain tissue. Qualitative comparison of impedance can still be performed using 2 electrodes, but the drift associated with electrode polarization reduces the overall accuracy. Another attribute of the design that requires consideration, depending on the application, is the choice of electrode. The platinum electrodes used for in vivo brain tissue measurements may not be the best choice for impedance measurements taken in other tissues or surfaces. For example, skin surface bioimpedance analysis would use conventional Ag/AgCl gel electrodes or electrode bands that wrap around the circumference of a limb.
In any case, this system can be easily adapted to a probe construction that includes 4 or more electrodes, eliminating the polarization source of measurement error. If the drive circuitry is connected to the lateral pair of electrodes, while voltage is measured across the medial pair, then a tetra-polar configuration has been established.
As with any device that is made from primary components, it is very important to perform calibration and verification of this system to ensure constant current delivery and to generate a calibration curve which could be used in determining impedance values after data collection has been performed.
By incorporating equipment that is widely available in research laboratories, parts exclusively used for the purpose of bioimpedance analysis can be reduced to the PCB and its components, costing less than $50. Creating the layout for a PCB is very simple using free software such as Express PCB (http://www.expresspcb.com/) or EagleCAD (http://www.cadsoft.de/). The file present at http://uth.tmc.edu/pediresearch uses PCB123 (http://pcb123.com). This file can be sent to a board fabrication house such as those at www.pcbfabexpress.com, www.pcbexpress.com, or www.4pcb.com among others.
Matching the resistors in the VCCS is important and can be accomplished either through trial and error with low precision resistors or through the use of high precision resistors. The difference between 2 circuits using 1 and 0.1% tolerance resistors is minimal, so either type is acceptable.
There are numerous different types of function generators and oscilloscopes available, and many of them are compatible with different kinds of software that may come along with the device. Connectivity and compatibility between the different components are essential attributes in assembling a system that requires little technical know-how. Other brands than the ones used in this report may be used, given that their specifications meet the demands of the application.
Improvements to this design include the addition of isolation from mains voltage using isolation amplifiers, shielding from capacitive coupling, and improving the amplification and signal conditioning of the output signal before it reaches the oscilloscope. However, such improvements come at the cost of complexity with limited gains in accuracy.
Technology has reached the point where rapid data acquisition is possible using standard equipment and a limited amount of programming. This enables individuals interested in studying bioimpedance with the opportunity to build an analyzer system with a minimum number of single-application components. With this system, a lab or research group can begin introductory research into impedance analysis of tissue without requiring a substantial purchase of highly specialized equipment or extensive knowledge of electronics or fabrication methods.
Acknowledgments
This work was supported by NIH Grant T32 GM008792-06 (M.T.H.) and TATRC Grant W81XWH-07-1-0496 (B.S.G./C.S.C.).
References
- 1.Geddes LA, Hoff HE. The measurement of physiologic events by electrical impedance, a review. Am J Med Electronics. 1964;3:16. [PubMed] [Google Scholar]
- 2.Schwan HP. Electrode polarization impedance and measurements in biological materials. Ann NY Acad Sci. 1968;148:191. doi: 10.1111/j.1749-6632.1968.tb20349.x. [DOI] [PubMed] [Google Scholar]
- 3.Kira S, Hukushima Y, Kitamura S, et al. Transthoracic electrical impedance variations associated with respiration. J Appl Physiol. 1971;30:820. doi: 10.1152/jappl.1971.30.6.820. [DOI] [PubMed] [Google Scholar]
- 4.Bernstein DP, Lemmens HJ. Stroke volume equation for impedance cardiography. Med Biol Eng Comput. 2005;43:443. doi: 10.1007/BF02344724. [DOI] [PubMed] [Google Scholar]
- 5.Keshtkar A, Keshtkar A, Smallwood RH. Electrical impedance spectroscopy and the diagnosis of bladder pathology. Physiol Meas. 2006;27:585. doi: 10.1088/0967-3334/27/7/003. [DOI] [PubMed] [Google Scholar]
- 6.Tsunami D, McNames J, Colbert A, et al. Variable frequency bioimpedance instrumentation. Conf Proc IEEE Eng Med Biol Soc. 2004;4:2386. doi: 10.1109/IEMBS.2004.1403691. [DOI] [PubMed] [Google Scholar]
- 7.Radhakrishnan RS, Shah K, Xue H, et al. Measurement of intestinal edema using an impedance analyzer circuit. J Surg Res. 2007;138:106. doi: 10.1016/j.jss.2006.06.009. [DOI] [PubMed] [Google Scholar]
- 8.Ragheb T, Geddes LA. The polarization impedance of common electrode metals operated at low current density. Ann Biomed Eng. 1991;19:151. doi: 10.1007/BF02368466. [DOI] [PubMed] [Google Scholar]