

Abstract
Object
The question of whether to obtain routine or selective preoperative imaging of the neuraxis in pediatric patients with cerebellar neoplasms remains a controversial topic. Staging of the neuraxis is generally considered beneficial in patients with neoplasms associated with an elevated risk of leptomeningeal dissemination (LD). When these studies are obtained preoperatively, there is a decrease in the number of false-positive images related to debris in the immediate postoperative period. Additionally, knowledge of the extent of spread has the potential to affect the risk/benefit analysis of aggressive resection. Although the majority of pediatric neurosurgeons surveyed choose to obtain selective preoperative imaging of the neuraxis in cases of cerebellar neoplasms “with findings suggestive of high-grade pathology,” an evidence-based protocol in the literature is lacking. The goal of this study was to assess radiological characteristics of tumors with an elevated risk of LD and identify a method to help guide preoperative imaging of the neuraxis.
Methods
The authors first reviewed the literature to gain an appreciation of the risk of LD of pediatric cerebellar neoplasms based on underlying histopathology and/or grade. Available evidence indicates preoperative imaging of the neuraxis in patients with Grade I tumors to be of questionable utility. In contrast, evidence suggested that preoperative imaging of the neuraxis in patients with Grades II–IV neoplasms was clinically warranted.
The authors then evaluated an extensive base of neuroradiological literature to identify possible MR imaging and/or CT findings with the potential to differentiate Grade I from higher-grade neoplasms in pediatric patients. They analyzed the preoperative radiological findings in 50 pediatric patients who had undergone craniotomy for resection of cerebellar neoplasms at Vanderbilt Children's Hospital since 2003 with reference to 7 chosen radiological criteria. Logistic regression models were fit using radiological features to determine the best predictors of Grades II–IV tumors. Receiver operating characteristic methods were used to identify diagnostic properties of the best predictors.
Results
The relative T2 signal intensity (RT2SI), an indirect measure of the water content of the solid component of the tumor, was best able to identify neoplasms with an elevated risk of LD. An RT2SI value of 0.71 was selected by the authors as the best operating point on the curve. Of the 31 neoplasms retrospectively designated as hypointense T2-weighted lesions (RT2SI ≤ 0.71), 30 (97%) were Grade II or higher. All medulloblastomas, ependymomas, and high-grade (Grades III and IV) neoplasms were hypointense T2-weighted lesions. Of the 19 T2-weighted hyperintense neoplasms (RT2SI > 0.71), 16 (84%) were Grade I and 3 were Grade II.
Conclusions
Measurement of the RT2SI can help predict Grade II–IV tumors at an elevated risk of leptomeningeal spread and guide staging of the neuraxis. Pediatric patients with cerebellar neoplasms found to have an RT2SI of less than or equal to 0.71 are recommended for neuraxis imaging prior to surgery.
Keywords: magnetic resonance imaging, cerebellar, neoplasm, staging, T2 hyperintensity, children
Pediatric cerebellar and fourth ventricular neoplasms comprise approximately 50%–55% of all pediatric intracranial neoplasms.31 The majority of tumors in this location display 1 of 3 distinct histopathologies: JPA, medulloblastoma, or ependymoma.34 The incidence of LD in children with cerebellar tumors appears to be highest in cases of medulloblastomas. Analysis of 4 case series13,15,23,29 involving 395 patients with cerebellar medulloblastomas revealed 36 patients (9%) with evidence of LD to the spine on initial radiological evaluation (Table 1). This can be compared with a compilation of 2 case series18,37 comprising 98 patients with predominantly infratentorial ependymomas; in 6 (6%) of these patients, LD to the spine was demonstrated on presentation. In contrast to these tumors, the incidence of LD at presentation in patients with JPAs is extremely low. Specifically, 4 known cases3,19,30,36 of LD of pediatric cerebellar JPAs found at presentation have been reported in the literature over the past 30 years (Table 2). Information regarding the incidence of LD of other, less common histopathological entities comprising the remaining approximately 15% of pediatric cerebellar neoplasms is sparse. Due to the paucity of this data, the risk of LD of these histopathological entities is often estimated based on the underlying grade of the tumor.
TABLE 1.
Incidence of preoperative LD of pediatric neoplasms in various case series grouped by histopathology*
| Pathology | Authors & Year | No. of Patients (IT:ST) | No. of Patients (%) | |
|---|---|---|---|---|
|
| ||||
| w/ LD on Presentation | w/ LD to Spine on Presentation | |||
| ependymoma | Pollack et al., 1995 | 37 (25:12) | 3 (8) | NR |
| Robertson et al., 1998† | 32 (21:11) | 1 (3) | 1 (3) | |
| Horn et al., 1999 | 66 (54:12) | 10 (14) | 5 (8) | |
| Grundy et al., 2007† | 76 (76:0) | 7 (9) | NR‡ | |
| current series† | 8 (8:0) | 1 (13) | 1 (13) | |
|
| ||||
| medulloblastoma | George et al., 1986 | 12 (12:0) | 5 (42) | 5 (42) |
| Evans et al., 1990 | 233 (233:0) | 23 (10) | 15 (6) | |
| Torres et al. 1994 | 86 (86:0) | 19 (22) | NR | |
| Meyers et al. 2000 | 112 (112:0)¶ | NR | 12 (11) | |
| Kombogiorgas et al., 2007† | 38 (38:0) | 5 (13) | 4 (11) | |
| current series† | 17 (17:0) | 4 (24) | 4 (24) | |
|
| ||||
| PMA | Tsughu et al., 2009 | 5 (0:5) | 3 (60) | 1 (20) |
| current series† | 1 (1:0) | 0 (0) | 0 (0) | |
|
| ||||
| JPA | current series† | 6 (6:0) | 0 (0) | 0 (0) |
IT = infratentorial tumor location; NR = not reported; ST = supratentorial tumor location.
Magnetic resonance imaging used for leptomeningeal staging in all reported cases; in the other studies, myelography/CT myelography was used in some/all patients for leptomeningeal staging.
Nine of 89 children in this study of 89 patients with supratentorial (13) and infratentorial (76) ependymomas were found to have metastases (3 leptomeningeal metastases were spinal, 3 were cranial, and 3 were both). While 7 of the 76 patients with infratentorial ependymomas had evidence of LD, the specific number with LD to the spine was not given.
Ten of 112 patients were adult (remainder were pediatric).
TABLE 2.
Case reports of LD in pediatric cerebellar JPAs found at diagnosis
| Authors & Year | Age (yrs), Sex | Evidence of LD on Brain MRI | Physical Examination | |
|---|---|---|---|---|
|
| ||||
| Evidence of LD | Unusual Findings | |||
| Auer et al., 1981 | 8, F | CT* | yes, intracranial | rt cranial nerve VI, VII, VIII palsy† |
| Pollack et al., 1994 | 5, F | yes | yes, spinal | positive straight leg raise test |
| Morikawa et al., 1997 | 4, M | yes | no | none reported |
| Hukin et al., 2003 | 10‡ | yes | yes, spinal | monoparesis |
Preoperative CT scanning only revealed enhancing left hemispheric mass. Operative findings 9 days following admission demonstrated subarachnoid spread of the neoplasm throughout the posterior fossa.
Reportedly progressed to develop complete loss of cord function in 10 days following operation.
Sex not specified.
Formal assessment for LD involves MR imaging of the entire neuraxis and/or cytological evaluation of CSF.39 Sensitivity of CSF cytology for detection of LD has ranged from 60% to 86%14,30 and has been reported to increase with multiple spinal taps.30,39 The sensitivity of MR imaging of the neuraxis for detecting LD has been comparatively reported to be approximate 82%–83%.14,29 The use of both methods to assess for LD has been advocated.14,29 Staging with MR imaging of the neuraxis is generally believed to be beneficial in patients with aggressive neoplasms traditionally associated with an elevated risk of leptomeningeal spread. When this imaging is performed preoperatively, there is a decrease in the number of false-positive images related to debris in the immediate postoperative period.5 Additionally, the presence of LD is associated with a worse prognosis, and knowledge of the extent of spread has the potential to affect the risk/benefit analysis of aggressive resection.34,47 However, complete imaging of the neuraxis is not without risk or cost. Costs associated with standardized, published Medicare rates for neuraxis MR imaging with and without contrast medium are greater than 3 times the cost of brain MR imaging with and without contrast medium alone (http://www.cahabagba.com/part_b/claims/fee_schedules/2010TNFEES2010_1_1.pdf). Much more important than considerations of cost, however, is consideration of risk. Magnetic resonance imaging of the brain with and without contrast material takes approximately 20 minutes to complete. Conversely, MR imaging of the neuraxis with and without contrast medium can require up to 2 hours, depending on the size of the patient. Abbreviated MR imaging protocols of the neuraxis have been described16 and may significantly decrease acquisition time (J Williams, personal communication, September 2010). However, to the authors' knowledge, the accuracy of these protocols—many of which include only sagittal T1-weighted postcontrast MR images—regarding detection of LD has not been systematically analyzed with regard to current standards. Pediatric patients undergoing MR imaging of the neuraxis are often required to remain under some form of sedation for the entire procedure. Maintenance of anesthesia in pediatric patients with intracranial mass lesions is challenging, and there is a potential for neurological deterioration during the course of the imaging study. Thus, efforts to limit unnecessary imaging procedures in these patients are valuable both in terms of cost and risk avoidance.
In a survey that we conducted, 78% of pediatric neurosurgeons who responded stated they would not obtain routine MR imaging of the neuraxis in a pediatric patient known to harbor a JPA because of the extremely low risk of LD in this population (Fig. 1). Additionally, 67% of those who responded stated they routinely choose to conduct selective imaging of the neuraxis in patients with radiological findings suggestive of a high-grade neoplasm (for example, medulloblastoma and ependymoma). In light of this information, the goal of the present study was to identify a reliable method for utilizing brain imaging to guide preoperative imaging of the neuraxis.
Fig. 1.
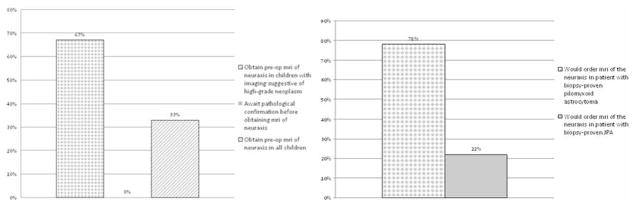
Bar graphs depicting the results of a survey of pediatric neurosurgeons regarding their policy of if/when to perform preoperative imaging of the neuraxis in children with cerebellar tumors. The survey was mailed out to 20 pediatric neurosurgeons at leading academic institutions across the US and reflects the opinions of the 9 pediatric neurosurgeons who responded.
Methods
Radiological Criteria and Patient Population
We reviewed an extensive base of neuroradiological publications in the literature to identify imaging features thought to correlate with underlying histopathology and grade in pediatric patients with cerebellar neoplasms.1,2,5,6,11,38,43–45,48 From this literature search, 5 criteria were selected by which preoperative MR imaging findings in the brain were to be assessed in every patient in the study population. These radiological criteria were intensity of the solid component of the lesion on diffusion-weighted imaging; position and/or displacement of the superior medullary velum; intensity of the solid component of the lesion on T2-weighted imaging; laterality of the tumor (whether the lesion was midline or predominantly involved the cerebellar hemisphere); and presence or absence of tumor exit from the foramina of the fourth ventricle. Two assessments—density of the solid component of the tumor and the presence/absence of calcification—were added as additional criteria in patients who underwent preoperative CT scanning. Following internal review board approval, the radiological findings in 58 patients who had undergone craniotomy for primary resection of cerebellar neoplasm since 2003 at Vanderbilt Children's Hospital were then reviewed. Seven of the 58 patients underwent their initial MR imaging studies at an outside facility and did not have all the required MR imaging protocols available for review in the Vanderbilt system; these 7 patients were excluded from the study. An additional patient was excluded due to severe distortion artifact related to metallic orthodontic braces on a preoperative scan also performed at an outside institution. The remaining 50 patients comprised the study population. The majority of MR images analyzed during the study were obtained on a 1.5-T MR imaging unit with a protocol that included sagittal noncontrast T1-weighted, axial fast spin echo T2-weighted, FLAIR, axial diffusion-weighted imaging, and contrast-enhanced axial, coronal, and sagittal T1-weighted MR images. Preoperative findings on MR and CT imaging relating to the aforementioned criteria were assessed in a blinded fashion by an attending pediatric neuroradiologist using a Picture Archiving and Communication System workstation. The correlation between each criterion and the histopathological grade was then analyzed.
Statistical Considerations
Statistical analyses were performed in R version 2.11.0 (R Foundation for Statistical Computing) and Stata version 11 (StataCorp LP). Descriptive statistics were used to examine and clean the data before preliminary modeling began. Histograms, boxplots, and quantile summaries were used to display the data. Univariate and multivariate logistic regression models were fit using several combinations of the predictors as well as each predictor separately to characterize the predictive ability of each individual covariate and each group of covariates in identifying a tumor of a grade greater than I (that is, Grade II, III, or IV). Empirical ROC curves were used to assess and measure the predictive ability of each model.33 The ROC curves were compared using the AUC, which was validated using resampling techniques to ensure maximum generalization beyond the study population. We computed 95% CIs for the AUC with the standard error estimated using the Bamber method.4 Formal analysis indicated the RT2SI of the solid component of the tumor was the radiological criterion best able to differentiate Grade I from Grade II–IV neoplasms (Table 3). Sensitivity and specificity were calculated for several nearly optimal cut points to determine the ideal RT2SI threshold under our “best” model (Fig. 2). We used 95% exact CIs to characterize the variation of sensitivity and specificity estimates (Table 4).
TABLE 3.
Summary of the predictive value of various individual and group combinations of radiological criteria in differentiating Grade I from Grade II–IV neoplasms*
| Model | AUC | 95% CI Lower | 95% CI Upper | Bootstrap Validated AUC | AIC |
|---|---|---|---|---|---|
| relative DWI signal intensity of tumor | 0.89 | 0.80 | 0.98 | 0.89 | 41.6 |
| RT2SI of tumor | 0.96 | 0.91 | 1.00 | 0.96 | 27.9 |
| tumor laterality | 0.72 | 0.59 | 0.85 | 0.72 | 56.6 |
| evidence of tumor exit from 4th ventricle | 0.68 | 0.58 | 0.79 | 0.68 | 59.6 |
| combo of DWI/T2 signal intensity of tumor | 0.97 | 0.94 | 1.00 | 0.97 | 23.2 |
| combo of DWI/T2 signal intensity, tumor laterality, & evidence of tumor exit | 1.00 | 0.99 | 1.00 | 0.50 | 18.2 |
DWI = diffusion-weighted intensity.
Fig. 2.
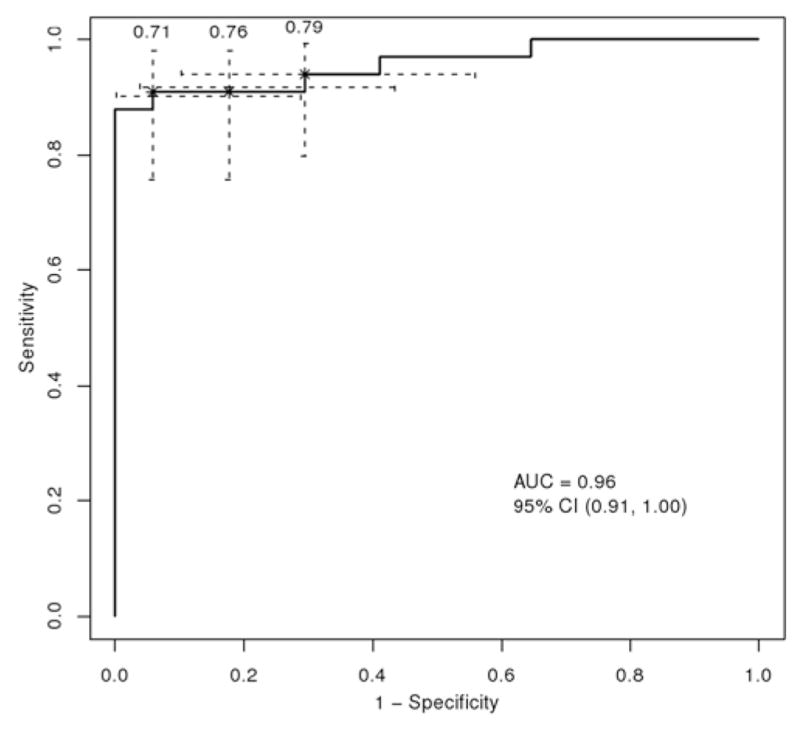
The ROC curve plotting the predictive ability of RT2SI to differentiate between Grade I and Grade II–IV neoplasms. Sensitivity and specificity are plotted for various RT2SI values. Three possible cut points (0.71, 0.76, and 0.79) are depicted. The cut point of 0.71 was selected as the optimal threshold value for the RT2SI.
TABLE 4.
Sensitivity and specificity profile of 3 possible cut points for RT2SI with CIs*
| Probability of Event | Cutoff | Sensitivity | 95% CI | Specificity | 95% CI |
|---|---|---|---|---|---|
| 0.336 | 0.79 | 93.94 | 79.77–99.26 | 70.59 | 44.04–89.69 |
| 0.467 | 0.76 | 90.91 | 75.67–98.08 | 82.35 | 56.57–96.20 |
| 0.686 | 0.71 | 90.91 | 75.67–98.08 | 94.12 | 71.31–99.85 |
As we sought to maximize sensitivity and specificity, an RT2SI value of 0.71 was selected as the best cut point value.
Analysis of MR Imaging Findings: Assessing Relative T2 Intensity
Our method for evaluating the RT2SI of the cerebellar neoplasm is as follows: first, the solid component of the tumor in question is identified using axial contrast-enhanced T1-weighted images. In rare cerebellar tumors that exhibit little to no contrast enhancement, the solid component can alternatively be identified using T2-weighted imaging alone. Once identified, the signal intensity of the solid component is then assessed on axial T2-weighted sequences. An ROI is placed on a representative area of solid tumor, and T2 signal intensity is quantitatively measured using the standard Picture Archiving and Communication System software (Fig. 3). The area of the ROI—limited to the available solid component—is ideally kept greater than or equal to 0.5 cm2, although this is not always possible. When significant tumor heterogeneity involving the solid component is encountered, image cuts whose signal is representative of the majority of the solid component of the tumor are chosen for ROI placement. After measuring the T2-signal intensity of the solid component of the neoplasm, this action is repeated with ROI placement and signal measurement of vitreous humor as illustrated. The numerical value indicative of the degree of solid tumor's T2 signal intensity is then divided by the numerical value indicative of the degree of the vitreous humor's T2 signal intensity for purposes of standardization. This is necessary because the absolute values of T2 signal intensity of neoplasm can vary based on individual MR imaging parameters. The quotient obtained is defined as the RT2SI of the tumor. The entire process of measuring the RT2SI of a cerebellar neoplasm reliably takes under 60 seconds to perform.
Fig. 3.
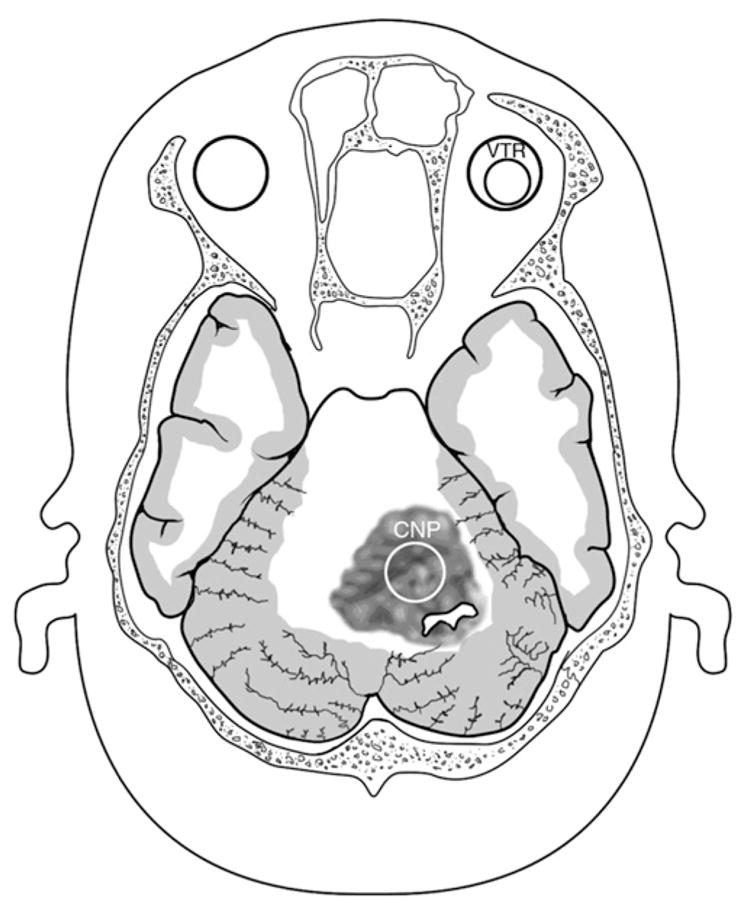
Artist's depiction of cerebellar neoplasm. The T2 signal intensity of the solid component of the tumor is estimated by measuring the signal intensity of an ROI—indicated by CNP (cerebellar neoplasm)—on a standard axial T2-weighted image. This is compared with a value obtained from an ROI involving normal vitreous humor, indicated by the VTR (vitreous humor) area. The RT2SI is obtained by dividing the T2 signal intensity of solid tumor by the T2 signal intensity of normal vitreous humor. If this value is greater than 0.71, the tumor is designated as T2 hyperintense. If the value is less than or equal to 0.71, the tumor is designated as T2 hypointense.
Results
Measuring the RT2SI of the solid component of the neoplasm was found to have a high predictive value in differentiating low-grade from high-grade neoplasms (Fig. 4). To determine the best cut point value for RT2SI, the ROC curve depicted in Fig. 2 was generated using values obtained from the aforementioned 50 neoplasms. We sought a threshold value for RT2SI that maximized both sensitivity and specificity (the sensitivities, specificities, and CIs of 3 selected ROC cut points from Fig. 2 are detailed in Table 4). Maximization of sensitivity and specificity correlates to the upper left-hand corner of the ROC curve—thus, an RT2SI value of 0.71 was selected as the best cut point.
Fig. 4.
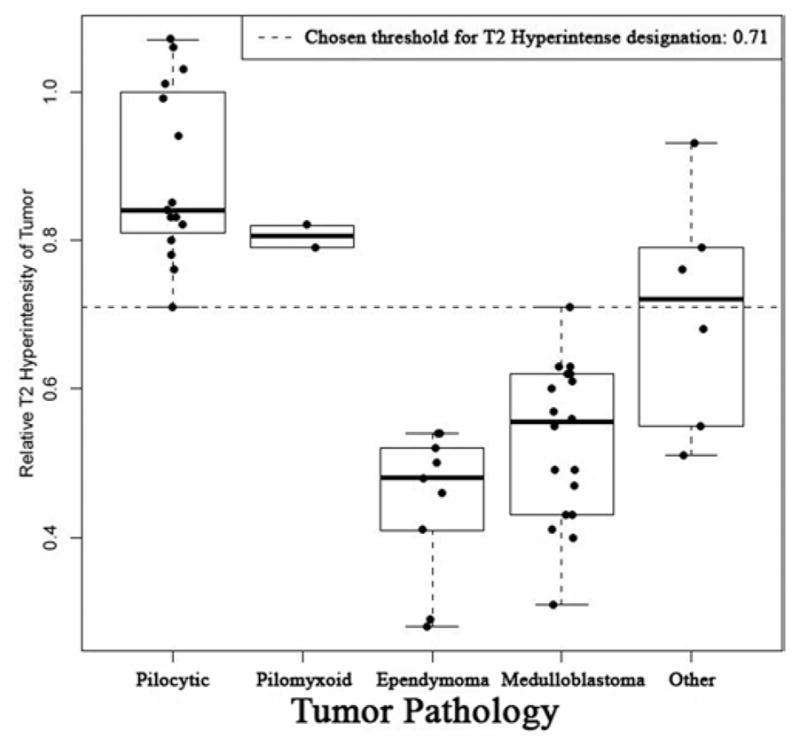
Box plot illustrating the RT2SIs of cerebellar neoplasms stratified by histopathology. It should be noted that the chosen threshold for designation of T2 hyperintensity (indicated by dotted line) was set at 0.71. An RT2SI of less than or equal to 0.71 is highly predictive of neoplasms with an elevated risk of LD; when a tumor with RT2SI of less than or equal to 0.71 is encountered, preoperative MR imaging of neuraxis is recommended.
If the RT2SI of the neoplasm is greater than 0.71, the tumor is labeled “T2 hyperintense”—a designation found to be strongly associated with low-grade histopathological entities. If the RT2SI is less than or equal to 0.71, the tumor is designated as “T2 hypointense”—a designation strongly associated with an elevated risk of LD. Of the 19 neoplasms designated as T2 hyperintense, 16 (84%) were Grade I (14 JPAs and 2 “others” [1 hemangioblastoma, 1 ganglioglioma]) and 3 (16%) were Grade II (2 PMAs and 1 “other” [polar spongioblastoma]). Of the 31 neoplasms designated as T2 hypointense, 30 (97%) were Grade II or higher. All medulloblastomas, ependymomas, and other high-grade (Grades III and IV) neoplasms were T2 hypointense lesions (Table 5). Fig. 5 illustrates an example of how the T2-weighted MR imaging signal intensity of the solid component of the tumor is distinctly higher in JPAs than in medulloblastomas.
TABLE 5.
Relative T2 signal intensities stratified by histopathology*
| Histopathology | No. of Neoplasms | Mean RT2SI | |
|---|---|---|---|
|
| |||
| T2 Hyperintense | T2 Hypointense | ||
| medulloblastoma | 0 | 18 | 0.53 |
| JPA | 14 | 1 | 0.89 |
| ependymoma | 0 | 9 | 0.45 |
| PMA | 2 | 0 | 0.81 |
| other | |||
| Grade I | 2 | 0 | 0.78 |
| Grade II | 1 | 1 | 0.81 |
| Grade IV | 0 | 2 | 0.53 |
| total | 19 | 31 | |
Mean relative T2 intensity corresponds to averaging of the RT2SIs for the corresponding histopathology. Relative T2 signal intensity = (T2 signal intensity tumor/T2 signal intensity vitreous humor).
Fig. 5.
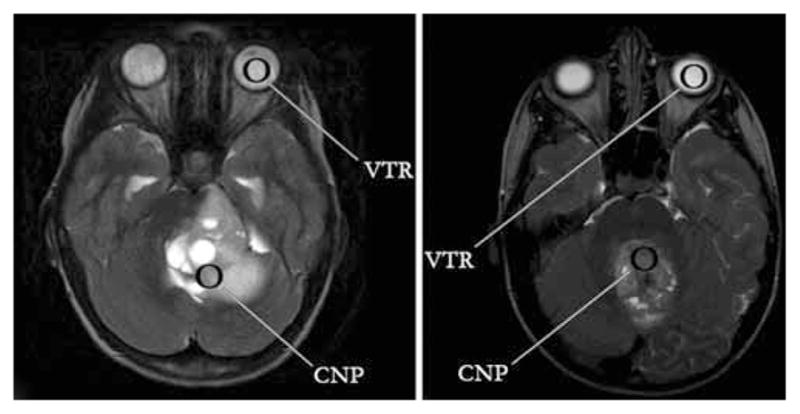
Left: Standard axial T2-weighted fast spin echo MR image demonstrating a JPA. The T2 signal intensity from the solid portion of the cerebellar neoplasm (CNP) is approximately as bright as that of the vitreous humor (VTR), indicative of a T2 hyperintense lesion. Right: The same imaging sequence is used to demonstrate a medulloblastoma, which is substantially darker on T2-weighted imaging than the vitreous humor. This lesion would be classified as T2 hypointense. The VTR represents the ROI selected to measure T2-signal intensity of vitreous humor and the CNP to represent the ROI selected to measure T2-signal intensity of solid component of cerebellar neoplasm.
Discussion
The incidence of LD in children with cerebellar tumors is strongly dependent on the underlying histopathology and/or grade. Medulloblastomas are Grade IV, densely cellular tumors that account for approximately 3 in 8 pediatric cerebellar neoplasms.21,34 Examination of 4 large case series13,15,23,29 (Table 1) that documented the incidence of LD in pediatric patients presenting with cerebellar medulloblastomas revealed that 52 (14%) of 369 patients had radiological evidence of leptomeningeal metastases (both intracranial and spinal) at the time of initial presentation. Regarding the incidence of LD to the spine alone, 36 (9%) of 395 pediatric patients with medulloblastoma had evidence of spinal LD on initial radiological evaluation. The prevalence of LD in patients with medulloblastoma increases with time. In one of the largest studies to date, 47 (42%) of 112 patients progressed to develop LD at some point during their illness (37 [33%] of 112 progressed to develop evidence of spinal LD).29 Analyzed collectively, previous reports indicate that extraneural metastases are present in approximately 1% of patients with medulloblastomas at presentation.7,12,20
Ependymomas account for approximately 1 in 8 neoplastic cerebellar lesions in the pediatric population and classically occur in the fourth ventricle.34 They are often further classified into ependymoma (Grade II)—accounting for approximately 75%–80% of cases—and anaplastic ependymoma (Grade III), accounting for the remainder.25 Tumor grade has not been definitively shown to influence overall survival,41 and the true influence of grade on the incidence of LD is unknown. The incidence of LD in patients with ependymomas is less than what has been described for medulloblastoma, an observation thought to relate to the relatively lower grade and/or biological aggressiveness of these neoplasms. Examination of 4 large case series (Table 1) that documented the incidence of LD at presentation in pediatric patients with ependymomas reveals that 21 (10%) of 211 patients had radiological evidence of LD (both intracranial and spinal) at initial presentation. It should be noted, however, that 3 of 4 of these case series did not differentiate between primary infratentorial and supratentorial location. In addition to the aforementioned statistics, compilation of 2 case series revealed that 6 (6%) of 98 patients had evidence of spinal LD on initial radiological evaluation.18,37 In one of the largest studies to date of pediatric patients with ependymoma, 19 (21%) of 89 patients progressed to develop LD over a median follow-up of 6 years (range 1.5–11.3 years).17
Juvenile pilocytic astrocytomas are well-circumscribed Grade I lesions that carry an extremely favorable prognosis, with a 94% survival rate at 10 years.22,32 They account for approximately 1 in 3 cerebellar neoplasms in the pediatric population.27 While the risk of LD with cerebellar JPAs is extremely small, it is not zero.9 Over the past 30 years, there have been 4 case reports3,19,30,36 of leptomeningeal spread of cerebellar JPAs found at/near the time of initial diagnosis, all of which included LD to the spine. These reports are summarized in Table 3. In all 4 of these cases, evidence of LD on physical examination and/or on preoperative brain imaging led to imaging of the neuraxis. It is possible that, because preoperative imaging of the spine in patients suspected of harboring a JPA is not routinely obtained at many institutions, the true incidence of LD on presentation is underestimated. Alternatively, given the routine misclassification of PMAs as JPAs prior to 1999,35 it is also possible that this estimation of the risk of LD on presentation may be falsely elevated.
As with medulloblastoma and ependymoma, the prevalence of LD associated with JPAs appears to increase with time and may be related to incomplete resection.28 In one of the largest studies on this topic to date, 1 (1.4%) of 73 pediatric patients who underwent resection of a cerebellar JPA eventually had LD to the spine.10 Clinical follow-up in this series ranged from 4 months to 26 years (mean 8.2 years) with imaging-documented complete resection obtained in 69% of the surgical cases. Because of the low risk of LD in patients with cerebellar JPAs and other low-grade cerebellar neuroepithelial tumors, previous authors have recommended selective imaging of the neuraxis in patients who exhibit unexplained hydrocephalus or clinical features suggestive of LD in favor of routine imaging of the neuraxis in all patients. Staging of the neuraxis has been likewise recommended for treatment planning in select patients with low-grade neuroepithelial, cerebellar tumors prior to initiation of adjuvant therapy.19 In our study of 50 patients, 15 patients harbored JPAs. In 6 patients, preoperative imaging of the spine was obtained to rule out LD; all of these studies were negative. Although postoperative imaging of the neuraxis is not routinely assessed in this population at Vanderbilt Children's Hospital, none of these patients—with follow-up ranging from 7 months to 4 years—have exhibited clinical evidence of leptomeningeal spread.
In 1999, Tihan and colleagues40 described a new category of pediatric glial neoplasms given the designation of PMAs. Prior to this description, PMAs had been grouped with JPAs because of similar histological features. While often located in the hypothalamic/chiasmatic region, PMAs sometimes arise in the posterior fossa.24 In one study of 21 patients with PMAs, 2 lesions (10%) were located in the cerebellum. Pilomyxoid astrocytomas are WHO Grade II neoplasms and demonstrate a more aggressive clinical course than JPAs. Moreover, they are associated with a higher incidence of leptomeningeal spread. In a 2004 study, the risk of LD of hypothalamic PMAs was reported to be 14% in contrast to a risk of 0% for hypothalamic JPAs.24 In a recent report by Tsughu et al.,46 3 of 5 patients with hypothalamic PMAs had evidence of LD at the time of diagnosis—in 1 of whom there was evidence of LD to the spine. In our study of 50 patients with cerebellar neoplasms, 2 patients were diagnosed with PMAs. One of the 2 patients—whose tumor involved the fourth ventricle—underwent preoperative spinal imaging, which was negative for LD. This patient progressed to develop evidence of intracranial and intraspinal LD on imaging repeated approximately 36 months following subtotal re-section. The other patient with a pathological diagnosis of PMA did not have evidence of LD at follow-up 5 months following resection. Although data regarding the true incidence of LD in cerebellar PMAs are lacking, routine imaging of the neuraxis in this population is recommended.
In the minority of pediatric patients found to have a cerebellar neoplasm whose histopathology is not consistent with JPA, PMA, medulloblastoma, or ependymoma, data regarding the incidence of LD are lacking. For these patients, we choose to estimate the risk of LD based on the underlying tumor's WHO grade. Some controversy surrounds exactly what metastatic potential justifies MR imaging of the neuraxis based on suspected histopathology and/or grade at the time of presentation. In the present analysis, the authors believe that available data indicate a practical line of demarcation. The incidence of LD at time of initial presentation in patients with Grade I neoplasms appears to be extremely low;19 preoperative MR imaging of the neuraxis in this sizable patient population is of questionable utility. Because Grade II/III ependymomas and Grade IV medulloblastomas have a clear and significant risk of LD at presentation, which appears to range from approximately 6% to 9%, imaging of the neuraxis is recommended in all pediatric patients with cerebellar/fourth ventricular neoplasms who are thought to harbor these histopathologies. Although more information regarding the risk of LD of other Grade II, III, or IV neoplasms is needed for a more definitive analysis, at present, preoperative imaging of the neuraxis in these patients is also recommended.
Selection of Cut Point Value for RT2SI
To determine the best cut point value for RT2SI, the ROC curve depicted in Fig. 2 was generated using values obtained from the aforementioned population of 50 pediatric patients. The ROC curve represents a graph of operating points that can be chosen for designation of neoplasms at low or high risk of LD. The ROC curve provides data regarding the sensitivity and specificity of each operating point with reference to this designation. Depending on value judgments relating to the importance of sensitivity and specificity, any one point on the curve can be selected as the best threshold value. A false-negative test result in this setting is equivalent to incorrectly diagnosing a neoplasm at high risk for LD as being at low risk of LD. Conversely, a false-positive result corresponds to incorrectly diagnosing a neoplasm at low risk for LD as being at high risk of LD. By increasing the value of the RT2SI selected as the operating point, sensitivity can be increased at the expense of specificity.
In the event of a false-negative test result, patients with malignant tumors who do not undergo preoperative imaging of the neuraxis can do so postoperatively, albeit with the aforementioned drawbacks (delayed diagnosis, decreased accuracy of radiological diagnosis in the initial postoperative period). In the event of a false-positive test result, a pediatric patient at low risk of LD undergoes costly imaging of the neuraxis—associated with some degree of risk—that is unlikely to yield clinically useful information. In the context of these consequences, we sought a threshold value for RT2SI that maximized both sensitivity and specificity. Maximization of sensitivity and specificity correlates to the upper left-hand corner of the ROC curve—thus, an RT2SI value of 0.71 was selected as the best cut point.
Correlation of T2-Weighted Imaging With Final Histopathological Diagnosis
The solid component of pilocytic astrocytomas has previously been demonstrated to be more hyperintense on T2-weighted imaging than medulloblastomas.2 This is thought to relate to the loosely structured, microcystic background separating compact bundles of piloid cells that can be visualized on microscopic evaluation.15 In a case series of 10 medulloblastomas and 10 JPAs, Arai et al.2 were the first to document the predictive ability of T2 signal intensity in assessing the likelihood of underlying histopathology in pediatric cerebellar neoplasms. In our study of 50 patients, the average RT2SI of all JPAs was 0.89, significantly higher than both medulloblastomas (mean RT2SI 0.53) and ependymomas (mean RT2SI 0.45). The association between elevated RT2SI and benign lesions held true with the 2 other Grade I neoplasms (hemangioblastoma and ganglioma) that were both also T2 hyperintense (mean RT2SI 0.78).
Radiological evidence of a cerebellar neoplasm with an RT2SI ≤ 0.71 is a strong indication for obtaining preoperative images of the neuraxis. Of the 31 neoplasms designated as T2 hypointense in this series, 30 (97%) were Grade II or higher, including all medulloblastomas, ependymomas, and high-grade (III and IV) tumors. The lone JPA that had an RT2SI of less than or equal to 0.71 exhibited the classic “mural nodule” appearance. The unusually low RT2SI (0.71) of this Grade I neoplasm was attributed to the extremely small size of the enhancing solid component. The protocol involved in using RT2SI to guide preoperative MR imaging of the neuraxis, as it would be applied to the current series of 50 patients, is illustrated in Fig. 6.
Fig. 6.

A flowchart illustrating, retrospectively, how an RT2SI-based protocol would have guided preoperative MR imaging of the neuraxis in our series of 50 patients. The value in parentheses represents the total number of neoplasms with a particular histopathology or grade in the series.
Following the review of MR images in pediatric patients with posterior fossa neoplasms, it is common for neuroradiologists to predict the most likely histopathology. In many institutions, this information is used to triage imaging of the neuraxis. At our institution, preoperative MR imaging of the neuraxis is performed when findings suggestive of high-grade pathology are encountered. In the present series of 50 patients, the correct histopathology was accurately predicted in 35 (73%) of 48 patients (in 2 cases, no prediction regarding most likely histopathology was made). Of the 13 patients in whom the underlying histopathology was not accurately predicted, 7 harbored ependymomas, pilocytic astrocytomas, or medulloblastomas. If a high-grade neoplasm is strongly suspected based on MR imaging findings, MR imaging of the neuraxis is conducted. Regarding the aforementioned population of 13 patients, routine measurement of the RT2SI would have led to a correct change in management in the spinal imaging of 9 patients—18% of the study population. In only 1 case (the JPA with a RT2SI of 0.71) of 50 patients did the traditional method lead to a correct change in management in spinal imaging when referenced against the proposed method of measuring the RT2SI. In addition to improved accuracy, the decision of whether to image the neuraxis can hypothetically be made prior to a formal interpretation by a neuroradiologist—before the patient has left the MR imaging unit. This allows for images of the neuraxis to be obtained, when indicated, in the same setting as the initial MR imaging of the brain.
Limitations
A significant limitation of this study is the use of a single neuroradiologist to obtain RT2SI values, which does not allow for proper characterization of interobserver reliability using this method. An additional limitation is that, unlike ependymomas and medulloblastomas, there is a paucity of reports assessing the true incidence of LD at the time of presentation in a population of pediatric patients with cerebellar JPAs. Thus, the risk of LD at presentation has been extrapolated from the infrequency of case reports over a specified interval. A limitation to using RT2SI to guide preoperative imaging of the neur-axis, in general, is the inability of this method to reliably distinguish JPAs from PMAs. The radiological similarities between a JPA and PMA have been well described,26 and presently no validated method exists to reliably distinguish between them using MR imaging and/or CT scanning alone. In a case report by Cirak et al.,8 MR spectroscopy demonstrated lower metabolite concentrations (choline, creatinine, N-acetyl aspartate) in hypothalamic PMAs than what was visualized in two cerebellar JPAs. Although there is hope that this imaging modality may prove useful in differentiating JPAs from PMAs in the future, further analysis will be necessary. Both PMAs in this series were noted to be T2 hyperintense neoplasms. For these patients and any other patients with Grade II–IV lesions who do not undergo imaging of the neuraxis preoperatively, the authors recommend obtaining this additional imaging 2 weeks or longer following definitive histopathological diagnosis. One final possible limitation of utilizing the RT2SI involves the unknown incidence of possible variations in the T2-weighted signal intensity of vitreous humor. Because the observed T2-weighted signal intensity of a neoplasm can vary based on selected individual MR imaging parameters, the T2 signal intensity of vitreous was chosen as the denominator of the RT2SI for purposes of normalization. In the future, it may be possible to reference the expected T2-weighted signal intensity of various histopathologies based on preselected MR imaging parameters. Elimination of the need to determine the T2 signal intensity of vitreous humor would be expected to improve data acquisition time and heighten accuracy.
Conclusions
Review of the literature demonstrates clear evidence that patients with medulloblastomas and ependymomas have an elevated risk of LD on presentation. Although there is less evidence regarding the incidence of LD in other high-grade neoplasms of the cerebellum and cerebellar PMAs, imaging of the neuraxis to rule out LD in these patients likewise appears to be indicated. In neurologically stable patients with radiological features suggestive of Grade II–IV neoplasms, preoperative imaging of the neuraxis is recommended. In contrast, the risk of LD in patients who present with JPAs is low, with 4 documented cases over the past 30 years. Available evidence suggests that routine preoperative MR imaging of the neuraxis in patients with Grade I neoplasms is of extremely low clinical benefit.
Although the majority of American pediatric neurosurgeons surveyed choose to obtain selective preoperative imaging of the neuraxis in cases of cerebellar neoplasms “with findings suggestive of high-grade pathology,” an evidence-based protocol in the literature is lacking. Analysis of 7 radiological features demonstrated the RT2SI of the solid component of a cerebellar neoplasm to be superior at differentiating Grade I from Grade II–IV lesions. Measuring the RT2SI of a cerebellar neoplasm immediately following MR imaging of the brain can help predict the risk of associated leptomeningeal spread and can be used to guide imaging of the neuraxis. Pediatric patients with cerebellar neoplasms found to have an RT2SI less than or equal to 0.71 are recommended for imaging of the neuraxis prior to surgery. Future prospective studies will be necessary to validate the findings of this retrospective analysis.
Acknowledgments
The authors acknowledge Jeffrey Blume, Ph.D., for his assistance with statistical considerations.
Abbreviations used in this paper
- AUC
area under the ROC curve
- JPA
juvenile pilocytic astrocytoma
- LD
leptomeningeal dissemination
- PMA
pilomyxoid astrocytoma
- ROC
receiver operating characteristic
- ROI
region of interest
- RT2SI
relative T2 signal intensity
Footnotes
A small portion of this work relating to the ability of this scoring system to prevent wasteful spending on MR imaging was presented at the Annual Meeting of the American Association of Neurological Surgeons/Congress of Neurological Surgeons Section on Pediatric Neurological Surgery, December 1 4, 2009.
Author contributions to the study and manuscript preparation include the following. Conception and design: Forbes. Acquisition of data: Forbes, Smith, Wushensky. Analysis and interpretation of data: Forbes, Wushensky. Drafting the article: Forbes, Chambless, Lebow. Critically revising the article: Forbes, Smith. Reviewed final version of the manuscript and approved it for submission: all authors. Statistical analysis: Forbes, Chambless, Alvarez. Administrative/technical/material support: Forbes. Study supervision: Forbes, Pearson.
Disclosure
This study was supported in part by the Vanderbilt Clinical and Translational Science Award (grant no. UL1 RR024975) from National Center for Research Resources/National Institutes of Health. Otherwise, the study was not funded by any outside sources. The authors report no conflicts of interest concerning the materials or methods used in this study or the findings specified in this paper.
References
- 1.Abdelhalim AN, Alberico RA. Pediatric neuroimaging. Neurol Clin. 2009;27:285–301. x. doi: 10.1016/j.ncl.2008.09.005. [DOI] [PubMed] [Google Scholar]
- 2.Arai K, Sato N, Aoki J, Yagi A, Taketomi-Takahashi A, Morita H, et al. MR signal of the solid portion of pilocytic astrocytoma on T2-weighted images: is it useful for differentiation from medulloblastoma? Neuroradiology. 2006;48:233–237. doi: 10.1007/s00234-006-0048-5. [DOI] [PubMed] [Google Scholar]
- 3.Auer RN, Rice GP, Hinton GG, Amacher AL, Gilbert JJ. Cerebellar astrocytoma with benign histology and malignant clinical course. Case report. J Neurosurg. 1981;54:128–132. doi: 10.3171/jns.1981.54.1.0128. [DOI] [PubMed] [Google Scholar]
- 4.Bamber D. The area above the ordinal dominance graph and the area below the receiver operating characteristic graph. J Math Psychol. 1975;12:387–415. [Google Scholar]
- 5.Blaser SI, Harwood-Nash DC. Neuroradiology of pediatric posterior fossa medulloblastoma. J Neurooncol. 1996;29:23–34. doi: 10.1007/BF00165515. [DOI] [PubMed] [Google Scholar]
- 6.Chawla A, Emmanuel JV, Seow WT, Lou J, Teo HE, Lim CC. Paediatric PNET: pre-surgical MRI features. Clin Radiol. 2007;62:43–52. doi: 10.1016/j.crad.2006.09.008. [DOI] [PubMed] [Google Scholar]
- 7.Choux M, Lena G. Le médulloblastome. Neurochirurgie. 1982;28(Suppl 1):162–179. [PubMed] [Google Scholar]
- 8.Cirak B, Horská A, Barker PB, Burger PC, Carson BS, Avellino AM. Proton magnetic resonance spectroscopic imaging in pediatric pilomyxoid astrocytoma. Childs Nerv Syst. 2005;21:404–409. doi: 10.1007/s00381-004-1023-2. [DOI] [PubMed] [Google Scholar]
- 9.Civitello LA, Packer RJ, Rorke LB, Siegel K, Sutton LN, Schut L. Leptomeningeal dissemination of low-grade gliomas in childhood. Neurology. 1988;38:562–566. doi: 10.1212/wnl.38.4.562. [DOI] [PubMed] [Google Scholar]
- 10.Dirven CM, Mooij JJ, Molenaar WM. Cerebellar pilocytic astrocytoma: a treatment protocol based upon analysis of 73 cases and a review of the literature. Childs Nerv Syst. 1997;13:17–23. doi: 10.1007/s003810050033. [DOI] [PubMed] [Google Scholar]
- 11.Dorenbeck U, Grunwald IQ, Schlaier J, Feuerbach S. Diffusion-weighted imaging with calculated apparent diffusion coefficient of enhancing extra-axial masses. J Neuroimaging. 2005;15:341–347. doi: 10.1177/1051228405279991. [DOI] [PubMed] [Google Scholar]
- 12.Eberhart CG, Cohen KJ, Tihan T, Goldthwaite PT, Burger PC. Medulloblastomas with systemic metastases: evaluation of tumor histopathology and clinical behavior in 23 patients. J Pediatr Hematol Oncol. 2003;25:198–203. doi: 10.1097/00043426-200303000-00004. [DOI] [PubMed] [Google Scholar]
- 13.Evans AE, Jenkin RD, Sposto R, Ortega JA, Wilson CB, Wara W, et al. The treatment of medulloblastoma. Results of a prospective randomized trial of radiation therapy with and without CCNU, vincristine, and prednisone. J Neurosurg. 1990;72:572–582. doi: 10.3171/jns.1990.72.4.0572. [DOI] [PubMed] [Google Scholar]
- 14.Fouladi M, Gajjar A, Boyett JM, Walter AW, Thompson SJ, Merchant TE, et al. Comparison of CSF cytology and spinal magnetic resonance imaging in the detection of leptomeningeal disease in pediatric medulloblastoma or primitive neuroectodermal tumor. J Clin Oncol. 1999;17:3234–3237. doi: 10.1200/JCO.1999.17.10.3234. [DOI] [PubMed] [Google Scholar]
- 15.George RE, Laurent JP, McCluggage CW, Cheek WR. Spinal metastasis in primitive neuroectodermal tumors (medulloblastoma) of the posterior fossa: evaluation with CT myelography and correlation with patient age and tumor differentiation. Pediatr Neurosci. 1986;12:157–160. doi: 10.1159/000120239. [DOI] [PubMed] [Google Scholar]
- 16.Griffiths PD. A protocol for imaging paediatric brain tumours. United Kingdom Children's Cancer Study Group (UKCCSG) and Société Française D'Oncologie Pédiatrique (SFOP) Panelists. Clin Oncol (R Coll Radiol) 1999;11:290–294. doi: 10.1053/clon.1999.9071. [DOI] [PubMed] [Google Scholar]
- 17.Grundy RG, Wilne SA, Weston CL, Robinson K, Lashford LS, Ironside J, et al. Primary postoperative chemotherapy without radiotherapy for intracranial ependymoma in children: the UKCCSG/SIOP prospective study. Lancet Oncol. 2007;8:696–705. doi: 10.1016/S1470-2045(07)70208-5. [DOI] [PubMed] [Google Scholar]
- 18.Horn B, Heideman R, Geyer R, Pollack I, Packer R, Goldwein J, et al. A multi-institutional retrospective study of intracranial ependymoma in children: identification of risk factors. J Pediatr Hematol Oncol. 1999;21:203–211. doi: 10.1097/00043426-199905000-00008. [DOI] [PubMed] [Google Scholar]
- 19.Hukin J, Siffert J, Cohen H, Velasquez L, Zagzag D, Allen J. Leptomeningeal dissemination at diagnosis of pediatric low-grade neuroepithelial tumors. Neuro Oncol. 2003;5:188–196. doi: 10.1215/S1152-8517-02-00029-7. [DOI] [PMC free article] [PubMed] [Google Scholar]
- 20.Kochbati L, Bouaouina N, Hentati D, Nasr C, Besbes M, Benna F, et al. Medulloblastoma with extracentral nervous system metastases: clinical presentation and risk factors. Cancer Radiother. 2006;10:107–111. doi: 10.1016/j.canrad.2006.02.004. (Fr) [DOI] [PubMed] [Google Scholar]
- 21.Koeller KK, Rushing EJ. From the archives of the AFIP: medulloblastoma: a comprehensive review with radiologic-pathologic correlation. Radiographics. 2003;23:1613–1637. doi: 10.1148/rg.236035168. [DOI] [PubMed] [Google Scholar]
- 22.Koeller KK, Rushing EJ. From the archives of the AFIP: pilocytic astrocytoma: radiologic-pathologic correlation. Radiographics. 2004;24:1693–1708. doi: 10.1148/rg.246045146. [DOI] [PubMed] [Google Scholar]
- 23.Kombogiorgas D, Sgouros S, Walsh AR, Hockley AD, Stevens M, Grundy R, et al. Outcome of children with posterior fossa medulloblastoma: a single institution experience over the decade 1994–2003. Childs Nerv Syst. 2007;23:399–405. doi: 10.1007/s00381-006-0258-5. [DOI] [PubMed] [Google Scholar]
- 24.Komotar RJ, Burger PC, Carson BS, Brem H, Olivi A, Goldthwaite PT, et al. Pilocytic and pilomyxoid hypothalamic/chiasmatic astrocytomas. Neurosurgery. 2004;54:72–80. doi: 10.1227/01.neu.0000097266.89676.25. [DOI] [PubMed] [Google Scholar]
- 25.Kun LE. Brain tumors. Challenges and directions. Pediatr Clin North Am. 1997;44:907–917. doi: 10.1016/s0031-3955(05)70536-8. [DOI] [PubMed] [Google Scholar]
- 26.Linscott LL, Osborn AG, Blaser S, Castillo M, Hewlett RH, Wieselthaler N, et al. Pilomyxoid astrocytoma: expanding the imaging spectrum. AJNR Am J Neuroradiol. 2008;29:1861–1866. doi: 10.3174/ajnr.A1233. [DOI] [PMC free article] [PubMed] [Google Scholar]
- 27.Lo S, Kish K, Chang E, Levin K, Keole S, Sloan A, Fontanesi J. Juvenile pilocytic astrocytoma. eMedicine J. 2004;3:1–13. [Google Scholar]
- 28.Mamelak AN, Prados MD, Obana WG, Cogen PH, Edwards MS. Treatment options and prognosis for multicentric juvenile pilocytic astrocytoma. J Neurosurg. 1994;81:24–30. doi: 10.3171/jns.1994.81.1.0024. [DOI] [PubMed] [Google Scholar]
- 29.Meyers SP, Wildenhain SL, Chang JK, Bourekas EC, Beattie PF, Korones DN, et al. Postoperative evaluation for disseminated medulloblastoma involving the spine: contrast-enhanced MR findings, CSF cytologic analysis, timing of disease occurrence, and patient outcomes. AJNR Am J Neuroradiol. 2000;21:1757–1765. [PMC free article] [PubMed] [Google Scholar]
- 30.Morikawa M, Tamaki N, Kokunai T, Nagashima T, Kurata H, Yamamoto K, et al. Cerebellar pilocytic astrocytoma with leptomeningeal dissemination: case report. Surg Neurol. 1997;48:49–52. doi: 10.1016/s0090-3019(96)00366-7. [DOI] [PubMed] [Google Scholar]
- 31.Nejat F, El Khashab M, Rutka JT. Initial management of childhood brain tumors: neurosurgical considerations. J Child Neurol. 2008;23:1136–1148. doi: 10.1177/0883073808321768. [DOI] [PMC free article] [PubMed] [Google Scholar]
- 32.Packer RJ. Childhood brain tumors: accomplishments and ongoing challenges. J Child Neurol. 2008;23:1122–1127. doi: 10.1177/0883073808320758. [DOI] [PMC free article] [PubMed] [Google Scholar]
- 33.Pepe MS. The Statistical Evaluation of Medical Tests for Classification and Prediction. New York: Oxford University Press; 2003. [Google Scholar]
- 34.Pollack IF. Pediatric brain tumors. Semin Surg Oncol. 1999;16:73–90. doi: 10.1002/(sici)1098-2388(199903)16:2<73::aid-ssu2>3.0.co;2-0. [DOI] [PubMed] [Google Scholar]
- 35.Pollack IF, Gerszten PC, Martinez AJ, Lo KH, Shultz B, Albright AL, et al. Intracranial ependymomas of childhood: long-term outcome and prognostic factors. Neurosurgery. 1995;37:655–667. doi: 10.1227/00006123-199510000-00008. [DOI] [PubMed] [Google Scholar]
- 36.Pollack IF, Hurtt M, Pang D, Albright AL. Dissemination of low grade intracranial astrocytomas in children. Cancer. 1994;73:2869–2878. doi: 10.1002/1097-0142(19940601)73:11<2869::aid-cncr2820731134>3.0.co;2-i. [DOI] [PubMed] [Google Scholar]
- 37.Robertson PL, Zeltzer PM, Boyett JM, Rorke LB, Allen JC, Geyer JR, et al. Survival and prognostic factors following radiation therapy and chemotherapy for ependymomas in children: a report of the Children's Cancer Group. J Neurosurg. 1998;88:695–703. doi: 10.3171/jns.1998.88.4.0695. [DOI] [PubMed] [Google Scholar]
- 38.Rumboldt Z, Camacho DL, Lake D, Welsh CT, Castillo M. Apparent diffusion coefficients for differentiation of cerebellar tumors in children. AJNR Am J Neuroradiol. 2006;27:1362–1369. [PMC free article] [PubMed] [Google Scholar]
- 39.Terterov S, Krieger MD, Bowen I, McComb JG. Evaluation of intracranial cerebrospinal fluid cytology in staging pediatric medulloblastomas, supratentorial primitive neuroectodermal tumors, and ependymomas. Clinical article. J Neurosurg Pediatr. 2010;6:131–136. doi: 10.3171/2010.5.PEDS09333. [DOI] [PubMed] [Google Scholar]
- 40.Tihan T, Fisher PG, Kepner JL, Godfraind C, McComb RD, Goldthwaite PT, et al. Pediatric astrocytomas with monomorphous pilomyxoid features and a less favorable outcome. J Neuropathol Exp Neurol. 1999;58:1061–1068. doi: 10.1097/00005072-199910000-00004. [DOI] [PubMed] [Google Scholar]
- 41.Tihan T, Zhou T, Holmes E, Burger PC, Ozuysal S, Rushing EJ. The prognostic value of histological grading of posterior fossa ependymomas in children: a Children's Oncology Group study and a review of prognostic factors. Mod Pathol. 2008;21:165–177. doi: 10.1038/modpathol.3800999. [DOI] [PubMed] [Google Scholar]
- 42.Torres CF, Rebsamen S, Silber JH, Sutton LN, Bilaniuk LT, Zimmerman RA, et al. Surveillance scanning of children with medulloblastoma. N Engl J Med. 1994;330:892–895. doi: 10.1056/NEJM199403313301303. [DOI] [PubMed] [Google Scholar]
- 43.Tortori-Donati P, Fondelli MP, Cama A, Garrè ML, Rossi A, Andreussi L. Ependymomas of the posterior cranial fossa: CT and MRI findings. Neuroradiology. 1995;37:238–243. doi: 10.1007/BF01578265. [DOI] [PubMed] [Google Scholar]
- 44.Tortori-Donati P, Fondelli MP, Rossi A, Cama A, Caputo L, Andreussi L, et al. Medulloblastoma in children: CT and MRI findings. Neuroradiology. 1996;38:352–359. doi: 10.1007/BF00596587. [DOI] [PubMed] [Google Scholar]
- 45.Trasimeni G, Lenzi J, Di Biasi C, Anichini G, Salvati M, Raco A. Midline medulloblastoma versus astrocytoma: the position of the superior medullary velum as a sign for diagnosis. Childs Nerv Syst. 2008;24:1037–1041. doi: 10.1007/s00381-008-0635-3. [DOI] [PubMed] [Google Scholar]
- 46.Tsugu H, Oshiro S, Yanai F, Komatsu F, Abe H, Fukushima T, et al. Management of pilomyxoid astrocytomas: our experience. Anticancer Res. 2009;29:919–926. [PubMed] [Google Scholar]
- 47.van Veelen-Vincent ML, Pierre-Kahn A, Kalifa C, Sainte-Rose C, Zerah M, Thorne J, et al. Ependymoma in childhood: prognostic factors, extent of surgery, and adjuvant therapy. J Neurosurg. 2002;97:827–835. doi: 10.3171/jns.2002.97.4.0827. [DOI] [PubMed] [Google Scholar]
- 48.Yuh EL, Barkovich AJ, Gupta N. Imaging of ependymomas: MRI and CT. Childs Nerv Syst. 2009;25:1203–1213. doi: 10.1007/s00381-009-0878-7. [DOI] [PMC free article] [PubMed] [Google Scholar]