Abstract
Genome scale network reconstruction has enabled predictive modeling of metabolism for many systems. Traditionally, protein structural information has not been represented in such reconstructions. Expanding a genome-scale model of Escherichia coli metabolism by including experimental and predicted protein structures enabled the analysis of protein thermostability in a network context, allowing prediction of protein activities that limit network function at super-optimal temperature and mechanistic interpretations of mutations found in strains adapted to heat. Predicted growth-limiting factors for thermotolerance were validated through nutrient supplementation experiments and defined metabolic sensitivities to heat stress, providing evidence that metabolic enzyme thermostability is rate limiting at super-optimal temperature. Inclusion of structural information expanded the content and predictive capability of genome-scale metabolic networks enabling structural systems biology of metabolism.
Main Text
Cellular thermosensitivity depends on proteome stability. Chaperones and proteases are well-characterized heat shock proteins (HSPs), and chaperones improve survival at super-optimal temperatures (1). Protein folding and structural stability required for functionare disrupted at high temperature. Many individual proteins and their mutant variants have been studied to identify structural loci within a protein that are destabilized at high temperatures leading to denaturation. Replacing heat-sensitive loci with more stabilizing residues has allowed engineering of thermostable proteins (2). By analogy, identifying the proteins that confer susceptibility to heat within the cellular system is critical to uncovering mechanisms for cellular thermosensitivity. Strategies for increasing thermotolerance have included introduction of chemical chaperones, overexpression of HSPs, pretreatment with moderate heat, or random mutagenesis to evolve stress tolerance (3).Instead we sought to directly identify the particular proteins that confer thermosensitivity in the system.
The emerging discipline of structural systems biology (4) has enabled new insights into topics that include the structure-function relationships in metabolism in a hyperthermophile (5), identification of causal off-target actions of drugs that cause adverse side effects (6), identification of protein-protein interactions (7, 8), and determination of causal mutations for disease susceptibility (8, 9).We used a structural systems biology approach to discover points of thermosensitivity in the mesophilic bacterium Escherichia coli K-12 MG1655. Metabolic thermosensitivity, affected by enzyme activity in a genome-scale model (GEM), was assessed as a function of protein thermostability, providing mechanistic explanations for effects of mutations in evolved thermotolerant strains (10, 11) and leading to the discovery of metabolic limitations to thermotolerance.
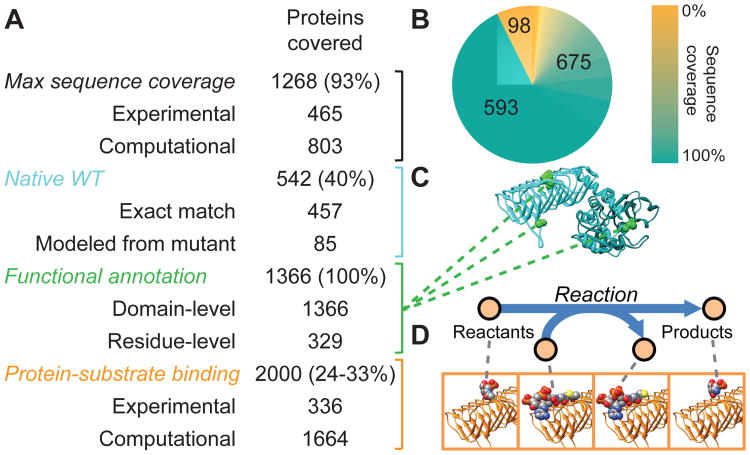
To assess protein thermostability, we integrated a genome-scale model of E. coli metabolism (iJO1366) (12) with protein structures (GEM-PRO) by associating metabolic reactions with structures of their catalytic enzymes (Database S1), thereby enabling parameterization of the network model based on protein structural properties. The main objectives of this reconstruction (Fig. 1A) were to:1) maximally cover amino acid sequence (Fig. 1B), 2) represent the native structure of each wild type (WT) protein (Fig. 1C), 3) map existing amino-acid functional annotations to structures (13-16) (Fig. 1C), and 4) represent changes in functional conformation or induced fit caused by protein-substrate binding (Fig. 1D). Thus, in this model a protein may be represented by zero, one, or multiple separate structures. Experimentally determined structures (17) and structures from homology modeling (Fig. S1) were used to achieve 93% structural coverage of proteins in the network (Fig. 1B) and between 24% and 33% coverage of protein-substrate binding conformations. The majority of coverage was enabled by structure modeling techniques (5), without which such a reconstruction would not currently be possible.
Fig. 1.
Properties of the E. coli metabolic model integrated with protein structures (A) The E. coli GEM-PRO model provides maximal amino acid sequence coverage, native WT structures, functional annotation, and protein-substrate binding for proteins included in iJO1366. Percentages are out of 1366 total proteins, except for the percentage of protein-substrate binding pairs, which is out of an estimated total between 6144 and 8448 such pairs. (B) The distribution of maximum amino acid sequence coverage of proteins by structures included in the GEM-PRO. Numbered wedges indicate the number of proteins with 0%, 100%, or partial sequence coverage. (C) Example of a native WT structure included in the GEM-PRO. Green highlighted residues denote annotated functional sites. (D) Protein-substrate binding is structurally represented as the pairwise interactions between each protein and the reactants or products of the catalyzed metabolic reaction.
Fig.2.
Simulated and experimental growth rates as a function of temperature (A) Growth rates relative to the maximum are depicted under each condition. Growth was simulated on minimal medium with glucose (circles) or experimentally measured (diamonds) on Davis minimal medium (DM) with glucose (29), lysogeny broth (LB) (11), or brain heart infusion (BHI) broth (30). The shaded region highlights the temperature range in which the model best predicts relative growth rates. (B) Simulated growth rates relative to maximum WT growth rate are shown for the WT strain, a strain with critical temperatures of the four most growth-limiting proteins at 42.2°C adjusted for maximum activity at that temperature, and a strain with critical temperatures of all growth-limiting proteins at 42.2°C adjusted for maximum activity at that temperature. The gray regions indicate the predicted most growth-limiting proteins and pathways for each phase of WT growth.
Fig.3.
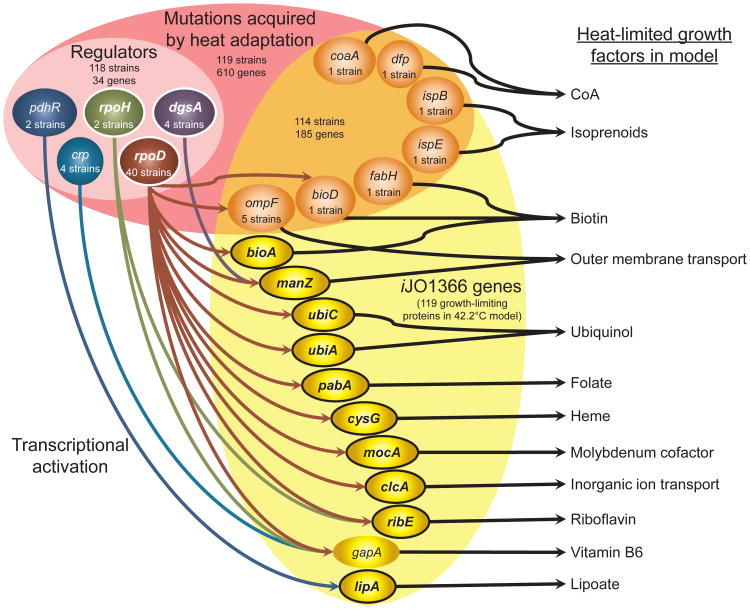
Mechanisms predicted to confer thermotolerance are summarized for heat-adapted E. coli strains. The total number of heat-adapted strains and mutated genes is given and also noted for the regulatory and metabolic subsets of mutated genes. Only regulators acting upon metabolic genes both predicted to lead to thermosensitivity and with heat-induced transcription in WT are depicted, except for crp. Only metabolic genes predicted to lead to thermosensitivity and either mutated in the set of evolved strains or both activated by depicted regulators and with heat-induced transcription in WT are depicted, except for gapA. Encircled, bolded genes show heat-induced transcription in WT. Predicted growth factors limited by heat-dependent decreases in protein activity are indicated at right.
Fig.4.
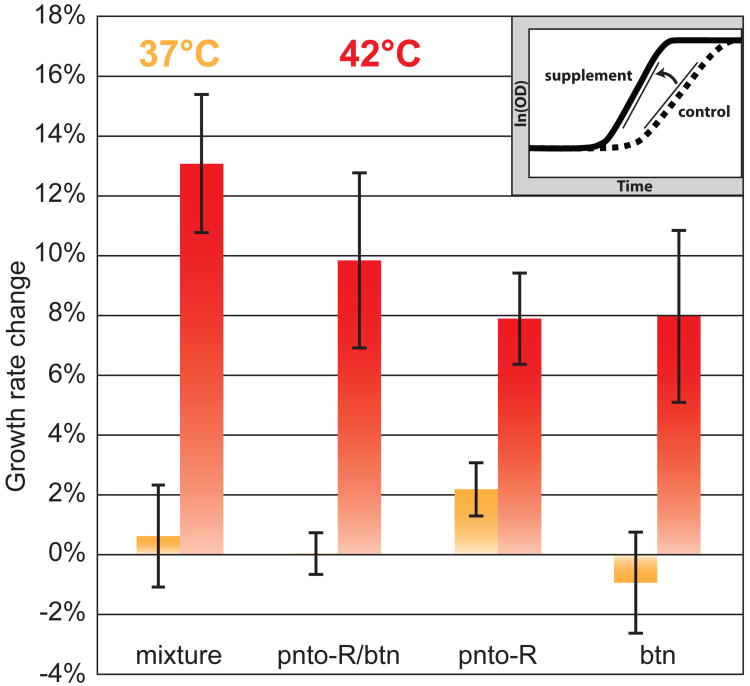
Changes in specific growth rate upon supplementation relative to a no supplement control are depicted in orange for 37°C and red for 42°C. Error bars show standard deviations with n = 3 for each condition. The inset graph illustrates how growth rate changes were computed by comparing the maximum slopes of growth curves between the control and supplement condition. Mixture: combination of all 6 supplements, pnto-R: pantothenate, btn: biotin.
Experimentally-measured critical temperatures (18, 19) accounting for optimal, half-maximum, and total loss of protein activity were supplemented with bioinformatic predictions (20-23), based on protein three dimensional structures, of protein melting temperatures (see Table S1 for a full list and Fig. S2 for a comparison of experimental and predicted melting temperatures). We used these critical temperatures to define protein activity functions that imposed temperature-dependent constraints on the metabolic model (Fig. S3). In this way, temperature, by affecting protein function, became a parameter for genome-scale metabolic simulation. Simulated temperature-dependent growth showed good qualitative agreement with experimental growth data in three different nutrient media (Fig. 2A) in the range from 32°C to 43°C where growth is above 50% of maximum. Thus thermostability of metabolic proteins appears to explain much of the thermosensitivity within this temperature range.
Our modeling framework also enabled precise prediction of points of thermosensitivity in the metabolic network (Fig. S4 and Table S2). The most temperature-limited protein activities cluster in cofactor synthesis pathways, identifying them as most growth limiting (Fig. 2B). We tested how temperature sensitivity of the model would change with introduction of thermostable proteins into the network by alleviating temperature-dependent activity constraints on predicted growth-limiting proteins. For instance, optimally increasing critical temperatures of all proteins predicted to be limiting at 42.2°C produced a 2-fold increase in maximum growth rate and shifted the optimal temperature to 42.2°C, but narrowed the range of growth temperatures due to incompatibility of these more thermophilic activity functions with lower growth temperatures (Fig. 2B). Adjusting activity functions for just the four most-growth-limiting proteins had similar but smaller effects on temperature-dependent growth (Fig. 2B).
Adaptive laboratory evolution experiments have yielded 119 thermotolerant E. coli mutants (10, 11). Investigating mutations in metabolic genes and their regulators (24) with our modeling framework yielded classification of potential causal mutations for 51 strains (see supplementary text and Table S3) and possible mechanistic explanations for their functionality in thermotolerance through compensating for heat-limited growth factors (Fig. 3), often consisting of cofactors. Statistical analysis (Table S3) established that predicted causal mutant gene combinations conferring thermotolerance have low probability of being identified by chance, signifying the predictive accuracy of heat-affected metabolic activities.
Mutations decreasing thermosensitivity of metabolic activities could stabilize or otherwise increase protein activity at high temperature, for example through increased gene expression. We thus profiled gene-expression of WT E. coli at 37°C and 42°C (Table S4) to identify genes with heat-induced transcription. Such genes participate in native heat-shock response and offer possible mechanisms for adaptive evolution of thermotolerance.
Specific susceptible proteins may be directly characterized: by replacement with more thermostable proteins, by increasing gene expression to compensate for decreased activity (25), or by bypassing their function through nutrient supplementation. We chose metabolites produced immediately downstream of model-predicted growth-limiting proteins (Fig. S4) and for which transport mechanisms are known in E. coli as supplements and found a set of 6 compounds that supplemented heat-limited growth factors (Table S5). Each individual compound and a mixture combining all compounds were tested for effects on growth rate at 42°C and 37°C. The mixture increased log phase growth rate at 42°C by about 13% but yielded no benefit at 37°C (Fig. 4).
Triplicate experiments for components of the supplement mixture (Table S6) were prioritized for the 2compounds resulting in the highest growth rates at 42°C in single experiments (Fig. S5). Pantothenate and biotin both provided heat-dependent supplementation, although to a lesser degree than the mixture (Fig. 4). Production of the CoA precursor pantothenate in WT grown at 37°C has been measured in excess of the minimum requirement for growth by as much as 15-fold, leading to excretion (26). A pathway with such excess activity at 37°C being successfully supplemented at 42°C indicates a substantial heat-dependent loss of function. This experimental result supports our predictions that this pathway has lowered activity due to thermal deactivation of PanB, PanC, PanD, and IlvC proteins. The heat dependency of this supplementation indicates that supplements do not simply alleviate the burden of synthesizing cofactors from the nutrient carbon source. Rather it confirms the accuracy of thermosensitive metabolic activities predicted by our modeling framework and supports the precise proteins predicted to be limiting at 42°C. The supplement mixture elicited a combined benefit beyond that observed for individual compounds. The combination of pantothenate and biotin accounts for part but not all of the benefit of the full mixture (Fig. 4). Additions to pantothenate and biotin within the mixture appear to compensate for less rate-limiting growth factor deficits.
The E. coli GEM-PRO platform reconciled disparate data types to explain fundamental properties of thermosensitivity, providing evidence that metabolic processes are growth-limiting under heat stress and providing mechanistic interpretations of complex thermotolerant mutation data. Our model suggests that these dependencies arise directly from the systemic constraints that proteome thermostability imposes upon growth, which could be relieved through exogenous supplementation of the most limiting processes, among them CoA and biotin synthesis. Understanding thermotolerance in microbes has important implications in developing industrial microbial biocatalysts (27), probiotics, and bacterial vaccines (28). Most efficient producers of compounds of interest are not naturally thermotolerant, but the absence of a genetic system often limits the utility of native thermophiles in industrial processes. Therefore, strategies for increasing thermotolerance of production strains may be useful. Our result supports the necessity of systems biology in understanding complex stress responses. Furthermore, these findings would not have been possible using either protein structure data or the metabolic network in isolation, illustrating the potential of advancing the field of structural systems biology.
Supplementary Material
Acknowledgments
We thank H. Nagarajan, A.M. Feist, P. Charusanti, P.E. Bourne, J.A. Lerman, E.T. O'Brien, D. Zielinski, Y. Zhang, and L. Jaroszewski for insightful discussion on this work and J. Orth for providing the iJO1366 network map. This work was supported by NSF and U.S. Department of Energy grants, NSF GK-12 742551 to RLC and DE-SC0004917to RLC, KA, DK and BØP, NIH grants R01GM101457 and U54GM094586 to ZL and AG, and by the Novo Nordisk Center for Biosustainability. Data reported in this report are available in the Supplementary Materials and the NCBI Gene Expression Omnibus (GEO) database (GSE42675).The content is solely the responsibility of the authors and does not necessarily represent the official views of the National Institutes of Health.
Footnotes
Supplementary Materials: Supplementary Text, Materials and Methods, Figures S1-S5, Tables S1-S6, Database S1, References (31-53)
References and Notes
- 1.Van Derlinden E, Bernaerts K, Van Impe JF. Dynamics of Escherichia coli at elevated temperatures: effect of temperature history and medium. J Appl Microbiol. 2008 Feb;104:438. doi: 10.1111/j.1365-2672.2007.03592.x. [DOI] [PubMed] [Google Scholar]
- 2.Korkegian A, Black ME, Baker D, Stoddard BL. Computational thermostabilization of an enzyme. Science. 2005 May 6;308:857. doi: 10.1126/science.1107387. [DOI] [PMC free article] [PubMed] [Google Scholar]
- 3.Fischer CR, Klein-Marcuschamer D, Stephanopoulos G. Selection and optimization of microbial hosts for biofuels production. Metab Eng. 2008 Nov;10:295. doi: 10.1016/j.ymben.2008.06.009. [DOI] [PubMed] [Google Scholar]
- 4.Beltrao P, Kiel C, Serrano L. Structures in systems biology. Curr Opin Struct Biol. 2007 Jun;17:378. doi: 10.1016/j.sbi.2007.05.005. [DOI] [PubMed] [Google Scholar]
- 5.Zhang Y, et al. Three-dimensional structural view of the central metabolic network of Thermotoga maritima. Science. 2009 Sep 18;325:1544. doi: 10.1126/science.1174671. [DOI] [PMC free article] [PubMed] [Google Scholar]
- 6.Chang RL, Xie L, Bourne PE, Palsson BO. Drug off-target effects predicted using structural analysis in the context of a metabolic network model. PLoS Comput Biol. 2010;6:e1000938. doi: 10.1371/journal.pcbi.1000938. [DOI] [PMC free article] [PubMed] [Google Scholar]
- 7.Zhang QC, et al. Structure-based prediction of protein-protein interactions on a genome-wide scale. Nature. 2012 Oct 25;490:556. doi: 10.1038/nature11503. [DOI] [PMC free article] [PubMed] [Google Scholar]
- 8.Wang X, et al. Three-dimensional reconstruction of protein networks provides insight into human genetic disease. Nat Biotechnol. 2012 Feb;30:159. doi: 10.1038/nbt.2106. [DOI] [PMC free article] [PubMed] [Google Scholar]
- 9.Cheng TM, et al. A structural systems biology approach for quantifying the systemic consequences of missense mutations in proteins. PLoS Comput Biol. 2012 Oct;8:e1002738. doi: 10.1371/journal.pcbi.1002738. [DOI] [PMC free article] [PubMed] [Google Scholar]
- 10.Tenaillon O, et al. The molecular diversity of adaptive convergence. Science. 2012 Jan 27;335:457. doi: 10.1126/science.1212986. [DOI] [PubMed] [Google Scholar]
- 11.Blaby IK, et al. Experimental evolution of a facultative thermophile from a mesophilic ancestor. Appl Environ Microbiol. 2012 Jan;78:144. doi: 10.1128/AEM.05773-11. [DOI] [PMC free article] [PubMed] [Google Scholar]
- 12.Orth JD, et al. A comprehensive genome-scale reconstruction of Escherichia coli metabolism--2011. Mol Syst Biol. 2011;7:535. doi: 10.1038/msb.2011.65. [DOI] [PMC free article] [PubMed] [Google Scholar]
- 13.Porter CT, Bartlett GJ, Thornton JM. The Catalytic Site Atlas: a resource of catalytic sites and residues identified in enzymes using structural data. Nucleic Acids Res. 2004 Jan 1;32:D129. doi: 10.1093/nar/gkh028. [DOI] [PMC free article] [PubMed] [Google Scholar]
- 14.Keseler IM, et al. EcoCyc: a comprehensive database of Escherichia coli biology. Nucleic Acids Res. 2011 Jan;39:D583. doi: 10.1093/nar/gkq1143. [DOI] [PMC free article] [PubMed] [Google Scholar]
- 15.Huang Z, et al. ASD: a comprehensive database of allosteric proteins and modulators. Nucleic Acids Res. 2011 Jan;39:D663. doi: 10.1093/nar/gkq1022. [DOI] [PMC free article] [PubMed] [Google Scholar]
- 16.Reorganizing the protein space at the Universal Protein Resource (UniProt) Nucleic Acids Res. 2012 Jan;40:D71. doi: 10.1093/nar/gkr981. [DOI] [PMC free article] [PubMed] [Google Scholar]
- 17.Berman HM, et al. The Protein Data Bank. Nucleic Acids Res. 2000 Jan 1;28:235. doi: 10.1093/nar/28.1.235. [DOI] [PMC free article] [PubMed] [Google Scholar]
- 18.Scheer M, et al. BRENDA, the enzyme information system in 2011. Nucleic Acids Res. 2011 Jan;39:D670. doi: 10.1093/nar/gkq1089. [DOI] [PMC free article] [PubMed] [Google Scholar]
- 19.Kumar MD, et al. ProTherm and ProNIT: thermodynamic databases for proteins and protein-nucleic acid interactions. Nucleic Acids Res. 2006 Jan 1;34:D204. doi: 10.1093/nar/gkj103. [DOI] [PMC free article] [PubMed] [Google Scholar]
- 20.Ku T, et al. Predicting melting temperature directly from protein sequences. Comput Biol Chem. 2009 Dec;33:445. doi: 10.1016/j.compbiolchem.2009.10.002. [DOI] [PubMed] [Google Scholar]
- 21.Oobatake M, Ooi T. Hydration and heat stability effects on protein unfolding. Prog Biophys Mol Biol. 1993;59:237. doi: 10.1016/0079-6107(93)90002-2. [DOI] [PubMed] [Google Scholar]
- 22.Murphy KP, Freire E. Structural energetics of protein stability and folding cooperativity. Pure and applied chemistry. 1993;65:1939. [Google Scholar]
- 23.Dill KA, Ghosh K, Schmit JD. Physical limits of cells and proteomes. Proc Natl Acad Sci U S A. 2011 Nov 1;108:17876. doi: 10.1073/pnas.1114477108. [DOI] [PMC free article] [PubMed] [Google Scholar]
- 24.Gama-Castro S, et al. RegulonDB version 7.0: transcriptional regulation of Escherichia coli K-12 integrated within genetic sensory response units (Gensor Units) Nucleic Acids Res. 2011 Jan;39:D98. doi: 10.1093/nar/gkq1110. [DOI] [PMC free article] [PubMed] [Google Scholar]
- 25.Gunasekera TS, Csonka LN, Paliy O. Genome-wide transcriptional responses of Escherichia coli K-12 to continuous osmotic and heat stresses. J Bacteriol. 2008 May;190:3712. doi: 10.1128/JB.01990-07. [DOI] [PMC free article] [PubMed] [Google Scholar]
- 26.Jackowski S, Rock CO. Regulation of coenzyme A biosynthesis. J Bacteriol. 1981 Dec;148:926. doi: 10.1128/jb.148.3.926-932.1981. [DOI] [PMC free article] [PubMed] [Google Scholar]
- 27.Turner P, Mamo G, Karlsson EN. Potential and utilization of thermophiles and thermostable enzymes in biorefining. Microb Cell Fact. 2007;6:9. doi: 10.1186/1475-2859-6-9. [DOI] [PMC free article] [PubMed] [Google Scholar]
- 28.Duplantis BN, et al. Essential genes from Arctic bacteria used to construct stable, temperature-sensitive bacterial vaccines. Proc Natl Acad Sci U S A. 2010 Jul 27;107:13456. doi: 10.1073/pnas.1004119107. [DOI] [PMC free article] [PubMed] [Google Scholar]
- 29.Cooper VS, Bennett AF, Lenski RE. Evolution of thermal dependence of growth rate of Escherichia coli populations during 20,000 generations in a constant environment. Evolution. 2001 May;55:889. doi: 10.1554/0014-3820(2001)055[0889:eotdog]2.0.co;2. [DOI] [PubMed] [Google Scholar]
- 30.Van Derlinden E, Van Impe JF. Modeling growth rates as a function of temperature: model performance evaluation with focus on the suboptimal temperature range. Int J Food Microbiol. 2012 Aug 1;158:73. doi: 10.1016/j.ijfoodmicro.2012.05.015. [DOI] [PubMed] [Google Scholar]
Associated Data
This section collects any data citations, data availability statements, or supplementary materials included in this article.


