

Abstract
Introduction
Cardio-metabolic risk factors have been associated with poor physical and mental health. Epidemiological studies have shown peripheral risk markers to be associated with poor cognitive functioning in normal healthy population and in disease. The aim of the study was to explore the relationship between cardio-metabolic risk factors and cortical thickness in a neurologically healthy middle aged population-based sample.
Methods
T1-weighted MRI was used to create models of the cortex for calculation of regional cortical thickness in 40 adult males (average age = 50.96 years), selected from the pSoBid study. The relationship between cardio-vascular risk markers and cortical thickness across the whole brain, was examined using the general linear model. The relationship with various covariates of interest was explored.
Results
Lipid fractions with greater triglyceride content (TAG, VLDL and LDL) were associated with greater cortical thickness pertaining to a number of regions in the brain. Greater C reactive protein (CRP) and intercellular adhesion molecule (ICAM-1) levels were associated with cortical thinning pertaining to perisylvian regions in the left hemisphere. Smoking status and education status were significant covariates in the model.
Conclusions
This exploratory study adds to a small body of existing literature increasingly showing a relationship between cardio-metabolic risk markers and regional cortical thickness involving a number of regions in the brain in a neurologically normal middle aged sample. A focused investigation of factors determining the inter-individual variations in regional cortical thickness in the adult brain could provide further clarity in our understanding of the relationship between cardio-metabolic factors and cortical structures.
Abbreviations: pSoBid, psychological, social and biological determinants of ill health; BMI, body mass index; CIMT, carotid intima-media thickness; SIMD, Scottish Index of Multiple Deprivation; CRP, high sensitivity C-reactive protein; IL-6, interleukin-6; ICAM, intercellular adhesion molecule-1; ELISA, enzyme linked immunosorbent assay; vWF, von Willebrand factor; tPA, tissue plasminogen activator; TAG, triglycerides; LDL, low-density lipoprotein; HDL, high-density lipoprotein; Apo, apolipoprotien; PCA, principal component analysis
Keywords: Cardiovascular risk, Metabolic risk, Cortical thickness, Inflammation, Cholesterol
Highlights
-
•
The relationship between coronary risk factors and cortical thickness is unclear.
-
•
We examine this relationship in neurologically healthy middle aged adults.
-
•
Greater lipid fractions were associated with greater regional cortical thickness.
-
•
Greater CRP and ICAM-1 were associated with regional cortical thinning.
1. Introduction
Epidemiological studies have demonstrated a link between increasing body mass index (BMI)—a commonly used index to define obesity, elevated total cholesterol (TC), low-density lipoprotein cholesterol (LDL), and triglycerides (TAG) and cerebrovascular and cardiovascular disease (Denke et al., 1994; Krauss et al., 1998). While the above mentioned risk factors are thought to drive the development and progression of atherosclerosis, greater high-density lipoprotein (HDL) is thought to be anti-atherogenic and therefore protective against these diseases (Toth, 2004). These “classic” cardiovascular risk factors have also been associated with poor physical, mental health and neuro-cognitive function (M.F. Elias et al., 2005; P.K. Elias et al., 2005). Most studies that have examined the relationship between these risk factors and the brain in healthy adults have generally found an inverse association between the risk factors and brain volume. Gunstad et al. in a large sample of 201 healthy individuals using voxel based morphometry (VBM) analysis, found that obese (BMI > 30) individuals had significantly smaller whole brain and total grey matter (GM) volume compared to normal and overweight individuals (Gunstad et al., 2008). Raji et al using tensor-based morphometry (TBM) in 94 elderly subjects found that obese subjects with a high BMI (BMI > 30) showed atrophy in the frontal lobes, anterior cingulate gyrus, hippocampus, and thalamus compared with individuals with a normal BMI (18.5–25) (Raji et al., 2010). Studies that have examined the relationship between cholesterol and grey matter are fewer and have shown inconsistent results. For example, Ward et al. in a sample of 183 individuals using VBM analysis did not find any association between non-HDL cholesterol and grey matter volume (Ward et al., 2010). They however found a significant positive correlation between HDL cholesterol and regional GM volumes pertaining to bilateral temporal and occipital regions. More recent studies have suggested that the relationship between these risk factors and brain morphology may be more complex, particularly in relation to cortical thickness (CT)—a robust measure that has been validated against histological analysis (Fischl et al., 2008; Rosas et al., 2002).
In recent years, novel biomarkers associated with inflammation and endothelial dysfunctions have ‘emerged’ as potential independent cardiovascular disease risk factors (Umemura et al., 2011; Wersching et al., 2010). These include high-sensitivity C-reactive protein (hsCRP), an acute phase reactant protein, interleukin-6 (IL-6), a pro-inflammatory cytokine and circulating forms of adhesion molecules like intercellular adhesion molecule (ICAM)-1, that are induced by inflammation and play a role in promoting atherosclerosis (Danesh et al., 2008; Luc et al., 2003). These inflammatory markers have been shown to be associated with poor cognitive functioning in the healthy population and in disease (Phillips et al., 2011; Wright et al., 2006). Prospective studies have shown such factors to predict cognitive decline in initially healthy elderly subjects over follow-ups of between one and ten years (Teunissen et al., 2003; Yaffe et al., 2003). Greater inflammatory markers have also been shown in several psychiatric illnesses like depression, and schizophrenia (Dowlati et al., 2010; Miller et al., 2011). Although the precise role of these factors in neurocognitive function is not clear, there is evidence to suggest that inflammation may play a role in the etiopathogenesis of mental and cognitive disorders (Krishnadas and Cavanagh, 2012).
Other markers of haemostasis and endothelial function have also been found to be independent predictors of coronary heart disease and ischemic stroke. These include von Willebrand factor (vWF) and fibrinogen, which play an important role in platelet adhesion and aggregation, and tissue plasminogen activator (tPA)—which plays an important role in endogenous fibrinolysis (Smith et al., 2005; Wannamethee et al., 2012). They have been found to be significant risk factors for vascular dementia and cognitive impairment in older adults (Gallacher et al., 2010; Quinn et al., 2011).
The potential aetiological links between cardio-metabolic risk factors and brain structure and function need further exploration as possible explanations for the relationship between the burden of physical and mental ill health. Key questions here are; is there a relationship between vascular health and neural health? Are cardiovascular risk markers potential endophenotypes for neuronal and hence psychiatric illnesses? However, whether variance in risk markers in the healthy adult population explains inter-individual differences in grey matter correlates of neurocognitive function is not fully clear. The aim of this study was to explore the relationship between various peripheral blood markers of inflammation and cardio-metabolic risk and cortical thickness (CT). We specifically examined if “classic risk factors” – including blood lipid fractions, carotid intima-media thickness (CIMT) and BMI, and “emerging” risk factors – including hs C-reactive protein (CRP); inerleukin-6, (IL6); fibrinogen; tissue plasminogen activator (tPA) antigen and markers of endothelial dysfunction – intercellular adhesion molecule (ICAM) and von Willebrand factor (vWF) – could potentially explain inter-individual variance in cortical thickness (Helfand et al., 2009).
2. Material and methods
2.1. Participants
Participants were recruited as part of a larger study (Psychological, social and biological determinants of ill health (pSoBid) (http://www.gcph.co.uk/work_programmes/psobid)(Knox et al., 2012; McGuinness et al., 2012; McLean et al., 2012; Packard et al., 2011; Shiels et al., 2011; Velupillai et al., 2008). Details of the design of pSoBid have been described elsewhere (Deans et al., 2009; Velupillai et al., 2008). Briefly, selection of participants was based on the Scottish Index of Multiple Deprivation 2004 (SIMD). Sampling was stratified to achieve an approximately equal distribution of the 666 participants across males and females and age groups (35–44, 45–54 and 55–64 years) within the most (bottom 5% of SIMD score) and least deprived areas (top 20% of SIMD score). Participants could opt-in for the neuroimaging component of the study. From a total of 327 male participants, 140 volunteered, and 42 (21 from least deprived and 21 from most deprived areas) of these were randomly selected. Individuals were excluded if they had a history suggestive of neurological or serious psychiatric illness. Participants with a history of cerebrovascular disease were excluded from the study. They were also excluded if they had a history of head injury or any contraindication for MRI. In addition, a consultant neuroradiologist examined all the scans. None of the participants included in the present study showed significant pathology on the scans. The present paper presents the results from the 40 individuals who had the complete data on “classic” biomarkers and 39 who had complete data on “emerging” risk factors, and structural MRI data.
2.2. Blood biochemical analysis
Ten to twelve hour fasting morning blood samples were collected, separated and frozen at − 80 °C within 1 h of venepuncture, except for samples for high sensitivity C-reactive protein (CRP), which were analysed on fresh plasma. High sensitivity C-reactive protein (CRP) was measured by an immunoturbidimetric assay (Roche Diagnostics Ltd., Burgess Hill, United Kingdom) and had a coefficient of variation (CV) of less than 3%. Interleukin-6 (IL-6) and intercellular adhesion molecule-1 (ICAM) were measured by sandwich ELISA (R&D Systems Europe Ltd., Abingdon, United Kingdom). The between batch CV for IL-6 was 8.3% at a concentration of 2.84 pg/mL and 10.0% at 5.38 pg/mL. The between batch CV for sICAM-1 was 5.5% at an analyte concentration of 190 ng/mL and 8.1% at 240 ng/mL. Fibrinogen was measured on an automated coagulometer (MDA-180, Organon Teknika, Cambridge, United Kingdom) with a between batch CV of 3.7% at a fibrinogen concentration of 2.89 g/L. von-Willebrand factor (vWF) was measured using an in-house enzyme linked immunosorbent assay (ELISA), employing rabbit anti-human polyclonal antibodies (DAKO UK Ltd, Ely, UK) and had a between batch CV of 3.4% at 128 IU/dl. Tissue plasminogen activator antigen (tPA) was measured by ELISA (Hyphen, Neuville-sur-Oise, France) with a CV 6.5% at an analyte concentration of 4.42 ng/mL. Total cholesterol, triglycerides, low-density lipoprotein (LDL), high-density lipoprotein (HDL), apolipoproteins (Apos) A1 and B were analysed on fresh plasma. Their concentrations were determined by enzymatic colorimetric assays on a Roche Hitachi 917 analyser (Roche Diagnostics Ltd, Burgess Hill, UK). Lipid fractions were measured using ultracentrifugation and precipitation methods. All the lipid analysis had a between batch CV of less than 3%.
2.3. Dimension reduction of lipid fractions
In order to reduce the number of dependent variables and to derive factors representing broad domains within the markers that are statistically independent, we subjected the raw scores from 6 measures of lipid fraction including HDL, LDL, VLDL, trigycerides, Apo A1, Apo B, to principal components analysis (PCA). The statistical independence of the factors meant that the relationship of each factor to cortical thickness was likely to estimate the specific association that each factor had on CT. Varimax rotation was used and the minimum eigenvalue for extraction was set to one. The analysis revealed a set of 3 orthogonal factors that explained a total of 95.7% of the variance. The first factor called “TAG” explained 38.4% of the variance with high loadings from triglycerides and VLDL. The second factor was called an “LDL” factor, which explained 29.79% of the variance, with high loadings from LDL and Apo-B. The third factor was called an “HDL” factor and explained 27.5% of the variance with high loadings from HDL and Apo A1. Factor scores were extracted using the regression method. These factors were used as dependent variables in the general linear model (GLM) model described below. A similar approach was attempted with the “emerging” factors. However, the Bartlett's test of sphericity suggested that the correlation matrix was an identity matrix, which implied that the factor model was inappropriate. Therefore an exploratory analysis of individual risk factors was performed separately.
2.4. Carotid intima-media thickness (CIMT) measurement
Carotid ultrasound scans were performed on an ACUSON Sequoia 512 Ultrasound System with an L7 5–12 MHz linear array broadband transducer (Siemens Medical Solutions, Erlangen, Germany). The details of the scan acquisitions have been published in detail previously (Deans et al., 2009). Briefly, the same research nurse, who was trained in ultrasound techniques at the Department of Vascular Medicine, Academic Medical Centre, Amsterdam, The Netherlands, performed majority of the scans. As pre-specified in the study protocol, research nurses performing ultrasonography were required to complete a minimum of 10 paired replicate volunteer scans before scanning participants. The mean absolute difference for the mean common carotid artery IMT measurement between nurses was 0.0542 mm, which was well within the predefined performance requirement for sonographer certification, with the requirement having been determined by the Department of Vascular Medicine, Academic Medical Centre, Amsterdam, to be a mean absolute difference of < 0.15 mm, and was also within the 88 more stringent requirements suggested by the American Society of Echocardiography, who suggests a certification requirement of a mean absolute difference of < 0.055 mm (Stein et al., 2008). Further paired replicate scans of volunteers were performed at intervals throughout the study to demonstrate continued fulfilment of the quality criteria. Both left and right common carotid arteries were assessed. Intima-media thickness was measured on the far wall of each arterial segment, averaged along a 1 cm length or as much as could be read. The average of the left and right maximum common carotid IMT was computed (van der Meer et al., 2004).
2.5. MRI acquisition
All MRI examinations were performed using GE Medical systems, 3T Signa Excite HD system (Milwaukee, USA) with an eight-channel phased array (receive only) head coil. An axial 3D T1-weighted IR-FSPGR was acquired with the following imaging parameters: TR = 6.8 ms; TE = 1.5 ms, inversion preparation time = 500 ms; flip angle = 12°; FOV = 26cm; phase FOV = 70%; matrix: 320 × 320; bandwidth 31.25 kHz; number of slices = 160; Slab thickness = 1 mm. The acquisition time for this scan was 8 min 54 s.
2.6. Cortical thickness (CT) measurements and analysis
We used the method similar to that of Leritz et al. (2011), who examined the association between cerebrovascular risk factors to CT in a normative sample of community dwelling adults (Leritz et al., 2011). Surface extraction, cortical parcellations and thickness computation were performed with the FreeSurfer image analysis suite. The pre-processing was carried out according to documentation, which has been validated and the description is available at (http://surfer.nmr.mgh.harvard.edu/) (Dale et al., 1999; Fischl and Dale, 2000; Fischl et al., 1999). Briefly, following skull-stripping and correction of inhomogeneity artefact, constrained region growing was used to create a unitary white matter volume for each hemisphere. The grey-matter/white-matter boundary for each cortical hemisphere was determined using tissue intensity and neighbourhood constraints. The white matter surface was tessellated by assigning 2 triangles to the square face of each surface voxel. This process yielded approximately 160,000 vertices per hemisphere. The white matter surfaces were deformed towards the grey matter/pial boundary, with a point-to-point correspondence at each vertex. CT was computed as the distance between the white and the pial surfaces at each vertex. Cross-subject registration of hemispheric cortical surfaces was performed by projecting them onto the spherical representations. The maps produced are not restricted to the voxel resolution of the original images and are thus capable of detecting sub-millimetre differences between groups. Procedures for the measurement of CT have been validated against histological analysis and manual measurements. In addition, FreeSurfer morphometric procedures have demonstrated good test–retest reliability across scanner manufacturers and across field strengths and across various sequence parameters.
2.7. Statistical analysis
The procedure previously described by Leritz et al. was adopted (Leritz et al., 2011). Statistical comparisons of global data and surface maps were generated by computing a general linear model (GLM) of the effects of each risk factor variable (independent variable) on thickness (dependent variable) at each vertex in the cortical mantle, using the Query, Design, Estimate, Contrast (QDEC) interface of FreeSurfer. QDEC is a single-binary application included in the FreeSurfer distribution that is used to perform group averaging and inference on the cortical morphometric data produced by the FreeSurfer processing stream (http://surfer.nmr.mgh.harvard.edu/fswiki/Qdec).
In case of the lipid fractions, the factors extracted from PCA were entered as independent variables of interest. For BMI, CIMT and the ‘emerging’ factors, individual risk factors were entered as independent variables of interest. Maps were created using statistical thresholds of p = .05 and were smoothed to a full width half maximum (FWHM) level of 20 mm. Since this analysis involved performing a GLM analysis at 160,000 vertices, these maps were corrected for multiple comparisons by means of a cluster-wise procedure using the Monte Carlo Null-Z simulation method adapted for cortical surface analysis and incorporated into the QDEC processing stream. For these analyses, a total of 10,000 iterations of simulation were performed for each comparison, using a threshold of p = .05. The simulation cluster analysis was run for thickness analyses with each independent variable separately (Hagler et al., 2006; Leritz et al., 2011). There is considerable debate on the distinction between exploratory and confirmatory analysis and whether exploratory analysis should be corrected for multiple testing (Bender and Lange, 2001). Considering the fact that previous results have shown inconsistent relationships and that some of the biomarkers we tested were novel, we considered our analysis to be predominantly exploratory in nature. However, rather than use conservative family wise error tests at this level, in order to adjust for exploring the relationship between 11 different risk factors on CT, we took an approach of exploring the strength of the significance of the relationship. Therefore, in the previous step, if the clusters survived the Monte Carlo simulation at a threshold of 1.3 (p < 0.05), we repeated the analysis at thresholds of 2.0 and 2.3 corresponding to p values of 0.01 and 0.005. We report the clusters that survived all 3 levels. Similar technique was also employed by Leritz et al. (Leritz et al., 2011).
2.8. Covariates in the model
In order to improve the variance explained by our predictor of interest, we added as nuisance covariates, those variables that showed significant relationship with mean whole brain CT (dependent variable).
There was a significant negative correlation between age and mean whole brain CT (rho = − 0.57; p < 0.001). The association between age and CT was widespread bilaterally. We therefore used age as a nuisance covariate in the model for all analyses. Alcohol use was examined next. A unit of alcohol here is defined as equivalent to 10 mL or 8 g of pure alcohol. We found no association between number of alcohol units consumed per week and mean CT (rho = 0.06; p = 0.68). Alcohol use was therefore not included as a nuisance covariate in further analyses. Similarly socioeconomic status as measured using the SIMD did not explain any significant variance in mean CT (Mann–Whitney U = 182.0; p = 0.3).
Two other variables – education status and smoking status – were found to have a significant association with the mean whole brain CT. There was a significant positive correlation between number of years spent in full time education (FTE) and mean whole brain CT (rho = 0.36; p = 0.02). Regionally, greater FTE was associated with greater CT in the left perisylvian regions. We also found significant association between smoking status and mean whole brain CT (t = 4.17; p = 0.001). The relationship between smoking status and CT was spread across the cortex bilaterally. However, we also found that in our sample, FTE showed a positive correlation with the predictor variables LDL factor (r = 0.24; p = 0.17) and a significant negative correlation with CRP (rho = − 0.48; p = 0.002) and ICAM (r = − 0.45; p = 0.004) levels. Smoking status was associated with greater ICAM levels (t = − 1.9;p = 0.06) and lower LDL factor (t = 1.9; p = 0.05). We therefore did not include FTE or smoking status in the initial analysis, but we conducted a post hoc exploratory analysis of the relationship between LDL factor, ICAM, CRP, smoking status, FTE and CT. All covariates were examined at p < 0.05.
3. Results
3.1. Classic risk factors
Table 1 shows the demographic and biomarker details of the participants in the study. Table 2 shows the result of the PCA—and loading on each factor. The cluster-wise cortical analysis showed a number of regions of significant association (Fig. 1). Only those for LDL and the TAG factors remained significant after multiple comparison correction. The regions corresponding to those that survived multiple testing are labelled with an asterisk in Fig. 1(d and e). Both LDL and TAG factors showed a significant positive association with CT (yellow/orange). The clusters that survived for the LDL factor were located in the inferior and middle frontal, precentral gyrus, inferior post central, supra-marginal and superior temporal cortex on the left hemisphere, and supramarginal, inferior post central and posterior superior temporal gyri on the right. TAG factor was associated with CT pertaining to the medial frontal on the left and medial frontal, middle temporal and parahippocampal gyrus on the right. Although a few clusters showed up on initial analysis with HDL factor, CIMT and BMI, none of them survived multiple testing corrections. Table 3 shows the details of the significant clusters that were associated with each risk factor across various thresholds. Fig. 3 shows the scatter plots of individual predictors plotted against CT pertaining to the most significant voxel that survived multiple testing corrections.
Table 1.
Descriptive statistics — classical and emerging risk factors.
| N = 40 | Reference | Mean | Std. deviation |
|---|---|---|---|
| Age (years) | – | 50.96 | 8.28 |
| Alcohol units per week | – | 17.68 | 16.51 |
| Number prescribed statins | – | 7 | |
| Number of smokers | 19 | ||
| CIMT (mm) | .70 | .13 | |
| BMI (kg/m2) | 27.93 | 4.5 | |
| Total cholesterol (mmol/L) | < 5.0 | 5.41 | .94 |
| Triglycerides (mmol/L) | 0.77–1.7 | 2.01 | 1.70 |
| VLDL (mmol/L) | 0.9–1.8 | 1.06 | .65 |
| LDL (mmol/L) | < 3.0 | 3.10 | .80 |
| HDL (mmol/L) | > 1.0 | 1.24 | .29 |
| APO-A1 (g/L) | 1.0–2.2 | 1.40 | .25 |
| APO-B (g/L) | 0.6–1.3 | .99 | .21 |
| hsCRP (mg/L)a | < 1.0 | 2.14 | 2.5 |
| ICAM (ng/mL)a | 269.90 | 72.31 | |
| IL6 (pg/mL)a | 0–14 | 2.58 | 4.03 |
| Fibrinogen (g/L)a | 3.06 | .79 | |
| tPA (ng/mL)a | 3.5–7.2 | 4.42 | 1.85 |
| vWF (IU/dL)a | 137.64 | 44.25 |
VLDL—very low density lipoprotein; LDL—low density lipoprotein; HDL—high density lipoprotein; APO—apoprotein; BMI—body mass index; CIMT—carotid intima-media thickness; ICAM—intercellular adhesion molecules; IL6—interleukin 6; tPA—tissue plasminogen activator; vWF—von Willebrand factor; hsCRP—C reactive protein.
n = 39.
Table 2.
Rotated factor matrix from PCA of lipid fractions.
| Component |
|||
|---|---|---|---|
| TAG factor | LDL factor | HDL factor | |
| Triglycerides | .975 | .013 | .012 |
| VLDL | .955 | .045 | − .054 |
| LDL | − .196 | .963 | .015 |
| Apo B | .293 | .932 | − .088 |
| HDL | − .337 | − .103 | .920 |
| Apo A1 | .240 | .025 | .958 |
High factor loadings to the components are depicted in bold.
Extraction method: Principal component analysis.
Rotation method: Varimax with Kaiser normalisation.
VLDL—very low density lipoprotein; LDL—low density lipoprotein; HDL—high density lipoprotein; APO—apoprotein; BMI—body mass index.
Fig. 1.
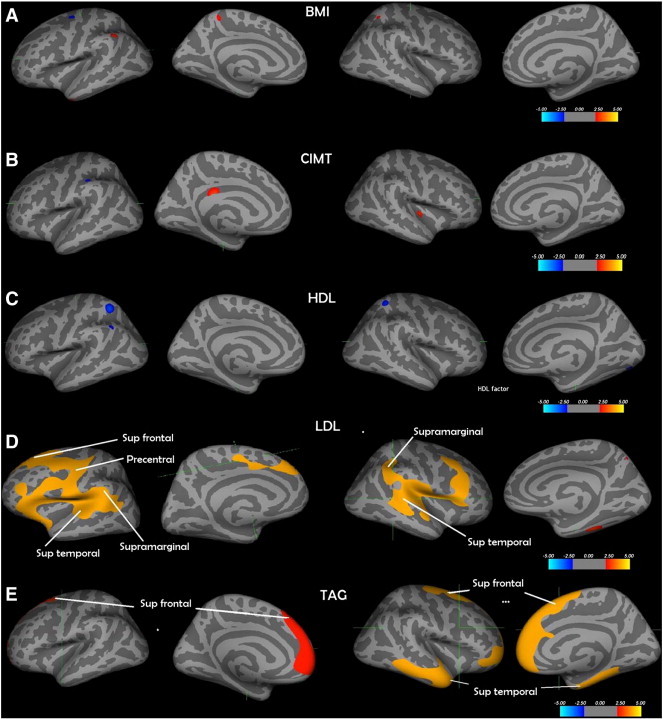
a) BMI—body mass index; b) CIMT—carotid intima-media thickness; c) HDL factor—HDL and Apo A1; d) LDL factor—LDL and Apo B; e) TAG factor—triglycerides and VLDL—* Only the relationship between LDL factor and cortical thickness and TAG factor levels and cortical thickness survived multiple correction using the Monte Carlo Null-Z simulation technique. The regions that survived are labelled with * for p < 0.05; ** if p < 0.01 and *** if p < 0.005. The cortical surface is inflated, and the dark grey areas represent sulci, and light grey represents gyri.
Table 3.
Details of the clusters that survived the Monte Carlo Z simulation at various thresholds.
| Risk factor | Threshold p value | Cluster no | Region | Size of cluster (mm2) | Tal X | Tal Y | Tal Z | Number of vertices |
|---|---|---|---|---|---|---|---|---|
| LDL factor | 0.05 | 1 | Lh superior frontal | 16225.72 | − 11.5 | − 7.7 | 47.3 | 34,785 |
| 0.01 | 1 | Lh precentral | 2997.09 | − 57.2 | − 0.1 | 10.7 | 6863 | |
| 0.005 | 1 | Lh precentral | 2290.76 | − 57.2 | − 0.1 | 10.7 | 5209 | |
| 0.05 | 1 | Rh banks sts | 9061.66 | 45.9 | − 43.8 | 7.5 | 20,217 | |
| TAG factor | 0.05 | 1 | Lh superior frontal | 4291.85 | − 6.6 | 33.8 | 49.8 | 6781 |
| 0.05 | 1 | Rh precentral | 9071.69 | 27.7 | − 14.4 | 60.2 | 15,680 | |
| 0.05 | 2 | Rh superior temporal | 5446.62 | 47.5 | 5.0 | − 27.2 | 9395 | |
| 0.01 | 1 | Rh rostral middle frontal | 3269.26 | 27.7 | 57.8 | − 9.5 | 4964 | |
| 0.01 | 2 | Rh superior temporal | 2343.63 | 47.5 | 5.0 | − 27.2 | 3610 | |
| 0.005 | 1 | Rh superior frontal | 2064.68 | 9.3 | 41.1 | 30.0 | 3149 | |
| 0.005 | 2 | Rh superior temporal | 1701.21 | 47.5 | 5.0 | − 27.2 | 2572 | |
| hsCRP | 0.05 | 1 | Lh precentral | 6662.41 | − 57.2 | − 0.1 | 10.7 | 14,860 |
| 0.01 | 1 | Lh post central | 1543.87 | − 62.6 | − 15.0 | 19.0 | 3489 | |
| ICAM | 0.05 | 1 | Lh precentral | 4890.49 | − 57.2 | − 0.1 | 10.7 | 11,789 |
| 0.01 | 1 | Lh superior temporal | 2134.62 | − 52.1 | − 24.0 | − 4.0 | 5232 | |
| 0.005 | 1 | Lh supramarginal | 1353.83 | − 48.6 | − 28.2 | 19.3 | 3334 |
Tal—Talairach coordinates of the vertex corresponding to the strongest association; Lh—left hemisphere; Rh—right hemisphere; hsCRP—C-reactive protein; b) ICAM—intercellular adhesion molecule; LDL factor—LDL and Apo B; TAG factor—VLDL and TAG.
Fig. 3.
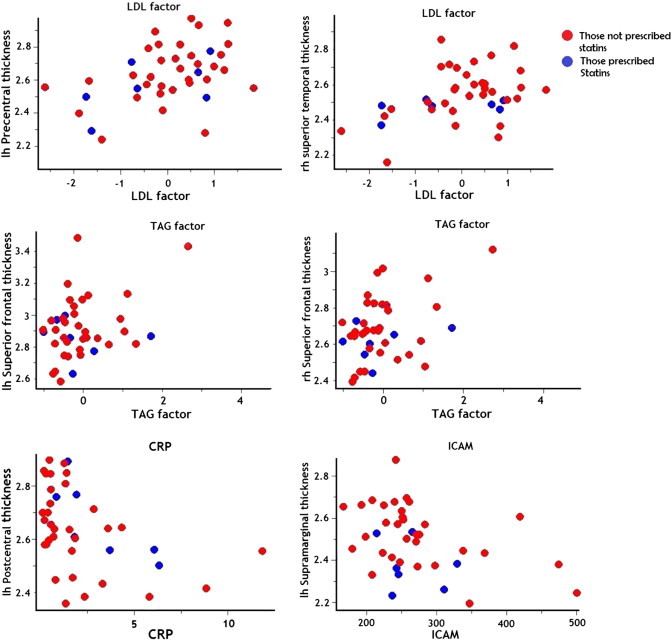
Scatter plots of relationship between cortical thickness and risk factors. Scatter plots pertaining to the vertex showing the strongest association are shown. Those prescribed statins are shown in blue. Details of the clusters and vertex location are shown in Table 2.
3.2. Emerging risk factors
Table 1 shows the details of emerging risk factors explored in the study. The cluster-wise analysis showed a number of regions of significant association. Only those for CRP and ICAM remained significant after multiple comparison correction. The regions corresponding to those that survived multiple testing are labelled in Fig. 2(a and b). CRP and ICAM showed a significant inverse association with CT (blue). Although a number of regions showed up on initial analysis with the other inflammatory and clotting markers, none of them survived multiple testing corrections. Some of the associations between the markers and CT were positive (red). Table 3 shows the details of the significant clusters that were associated with each risk factor across various thresholds. Fig. 3 shows the scatter plots of individual predictors plotted against CT pertaining to the most significant voxel that survived multiple testing corrections.
Fig. 2.
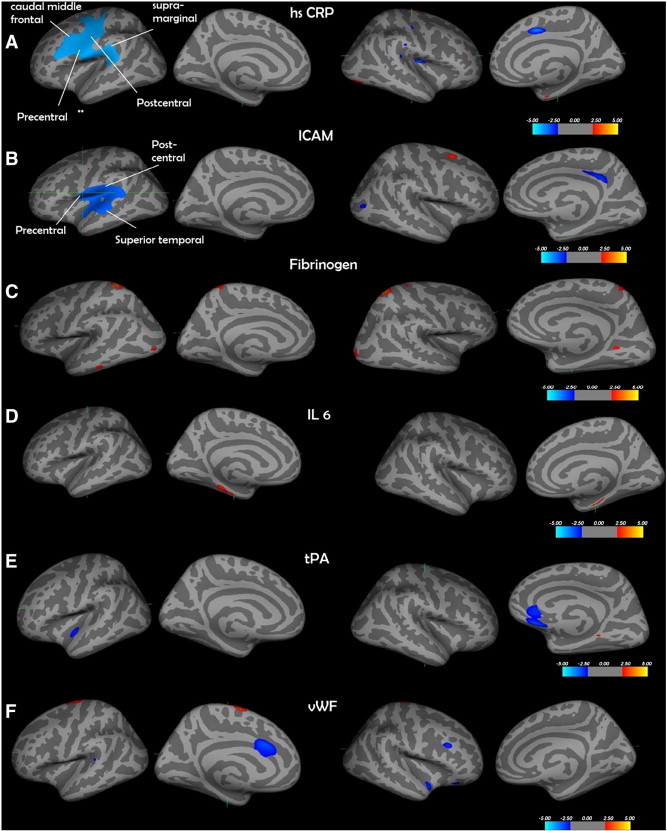
a) hsCRP—C-reactive protein; b) ICAM—intercellular adhesion molecule; c) fibrinogen; d) IL6—interleukin 6; e) tPA—tissue plasminogen activator; f) vWF—von Willebrand factor. Only the relationship between ICAM and cortical thickness and IL-6 levels and cortical thickness in the lateral aspects of the brain survived multiple correction using the Monte Carlo Null-Z simulation technique. The regions that survived are labelled. The cortical surface is inflated, and the dark grey areas represent sulci, and light grey represents gyri.
3.2.1. Covariate analysis
The relationship between LDL factor, ICAM, CRP and CT remained even after including FTE as a covariate in the model. However, the size of the clusters was reduced (Table 4). Similarly, the relationship between LDL factor, CRP and CT remained even after including smoking status as a covariate in the model. With LDL, the size of the clusters reduced, while with CRP, the size of the cluster increased (Table 4). However, the relationship between and ICAM and CT disappeared completely when smoking status was added as a covariate in the model.
Table 4.
Details of the clusters that survived after including smoking status or education status as covariates.
| Risk factor | Region | Maxima (negative log of p value)* | Size of cluster (mm2) | Tal X | Tal Y | Tal Z | Number of vertices |
|---|---|---|---|---|---|---|---|
| Covariate: Smoking status | |||||||
| LDL factor | Lh precentral | 4.00 | 9736 | − 57.2 | − 0.1 | 10.7 | 22,012 |
| Rh rostral middle frontal | 3.39 | 4587.95 | 43.7 | 24.0 | 28.2 | 10,309 | |
| CRP | Lh precentral | − 4.00 | 7715.55 | − 57.2 | − 0.1 | 10.7 | 17,163 |
| ICAM | – | ||||||
| Covariate: Education status | |||||||
| LDL factor | Lh precentral | 4.00 | 13069.22 | − 57.2 | − 0.1 | 10.7 | 28,224 |
| Rh supramarginal | 3.15 | 4438.65 | 55.1 | − 38.4 | 27.5 | 10,719 | |
| CRP | Lh precentral | − 2.85 | 4531.2 4 | − 52.5 | − 6.6 | 38.5 | 10,086 |
| ICAM | Lh insula | − 2.01 | 3502.00 | − 32.4 | − 31.9 | 17.1 | 8525 |
Tal—Talairach coordinates of the vertex corresponding to the strongest association; Lh—left hemisphere; Rh—right hemisphere; *survived p < 0.05 Monte Carlo Z simulation; hsCRP—C-reactive protein; b) ICAM—intercellular adhesion molecule; LDL factor—LDL and Apo B.
4. Discussion
The aim of the paper was to examine the relationship between cardio-metabolic risk factors and CT. We have shown that in a sample of healthy middle-aged male subjects, lipid fractions—particularly those pertaining to TAG, VLDL and LDL explained significant variance in CT across a number of regions in the brain. We have also shown that inflammatory markers, particularly CRP and ICAM-1 explained significant variance in CT across a number of regions in the brain.
4.1. Classic risk factors
While obesity has a strong effect on lipoprotein metabolism, recent studies have shown that the relationship between BMI and lipid fractions may not be consistent and therefore, this may indeed be independent risk factors for cerebrovascular and cardiovascular risk (Nicholls et al., 2006; Shamai et al., 2011). Hence the effects of BMI and cholesterol were examined separately. The results of the data reduction using PCA enabled us to examine the effect of broad domains within the markers that are statistically independent. The factors extracted from PCA were found to be meaningful—HDL cholesterol and Apo A1 formed a single factor (HDL) and LDL and Apo B formed a second factor (LDL). Apolipoprotien A1 and Apolipoprotien B are the major protein component of HDL and LDL respectively in plasma. VLDL and triglycerides, which contain most of the triglycerides, formed the third factor (TAG). The density of a lipoprotein that carries the cholesterol depends on the amount of triglyceride in the fraction. Therefore we found that the lipoprotein fractions with greater triglyceride fraction (TAG, LDL and VLDL) were associated with greater CT, while HDL, which contains the least triglycerides, showed the smallest association. While BMI, and HDL showed associations with CT in some regions, none of these clusters survived multiple testing corrections. These relationships were contrary to our expectations. We expected the presence of greater risk factors (LDL and TAG factors) to be associated with cortical thinning in a number of regions. Our findings are in contrast to a number of previous studies that have found a negative association between greater risk factors and grey matter morphology. Both cross sectional and longitudinal studies have shown significant negative association between BMI and regional grey matter volume (Gunstad et al., 2008; Raji et al., 2010; Walther et al., 2010; Yokum et al., 2012). Although Ward et al., in their study found no relationship between non HDL cholesterol and grey matter volume, they found that those with decreased levels of HDL cholesterol showed GM volume reductions pertaining to a number of cortical and subcortical structures (Ward et al., 2010). All of the above studies used techniques (voxel/tensor based morphometry) that do not decompose cortical volume into thickness and surface area. Cortical volume is a construct that is derived from two distinct properties of the cortical sheet: CT and surface area and have distinct cellular and genetic bases (Panizzon et al., 2009; Rakic, 2009). This highlights the importance of studying CT independently in morphometric studies, as highlighted recently (Palaniyappan and Liddle, 2012). Further, CT appears to be highly susceptible to various environmental influences such as exposure to smoking, metabolic risk factors and cannabis, while surface area seems to be more stable (Habets et al., 2011; Kuhn et al., 2010; Leritz et al., 2011).
More recent studies that have used similar image analysis techniques as used in the present study have found interesting results. In the first study, Isaac et al., found a negative association between visceral abdominal fat measured using MRI and CT pertaining to frontal, parietal and occipital cortices (Isaac et al., 2011). They however, did not measure lipid fractions in the blood. A second larger study, which examined the association between CT and peripheral cholesterol levels in an older population (mean age 68.3 years), found a similar relation to our study. They found that an increase in cholesterol factor with high loadings from total cholesterol and LDL was significantly associated with an increase in CT. However, a second factor which included HDL and BMI did not show such an association (Leritz et al., 2011). They suggest that the results in their study could be explained by other studies that have shown that neurodegeneration (and hence cortical thinning) is associated with lower serum cholesterol due to disruption in brain cholesterol production (Solomon et al., 2009). The fact that we found a similar relationship in a smaller sample suggests that the relationship is more than trivial (Friston, 2012). Our sample was also younger suggesting that the relationship between risk factors and cortical morphology may be evident earlier on in life. In another study, the same group has found higher HDL and LDL cholesterol in normo-lipidemic individuals to be associated with compromised regional white matter integrity. These findings suggest that the relationships between cholesterol, white matter and grey matter are complex (Williams et al., 2012).
Although it accounts for only 2% of total body weight, the human brain contains as much as 25% of total body cholesterol. Cholesterol in the brain is primarily synthesised by glia. It is an essential component of cell membrane and myelin in the white matter. In this context, cholesterol abnormalities have been implicated in a number of neurodegenerative illnesses, where the primary pathogenesis seems to involve deregulated cholesterol trafficking (Liu et al., 2010). Leritz et al. therefore suggest that a bidirectional mechanism between cholesterol and the brain may exist, such that higher levels in the brain predispose an individual to have higher levels in circulating blood (Leritz et al., 2011). Therefore the positive relationship between cholesterol and CT is a reverse epiphenomenon. It is also not clear if the association between CT and peripheral cholesterol level is related to pathological processes. Consistent with our findings, more recently, Hoogendam et al. examined the relationship between cardiovascular risk factors and cerebral volume measured using FreeSurfer in a community dwelling non-demented elderly sample of 3962 people. They found that higher total cholesterol levels were related to a larger cerebral volume. They found no association between HDL cholesterol and cerebral volume (Hoogendam et al., 2012).
CIMT measured using carotid ultrasound is an efficient and validated method for assessing the degree of atherosclerosis in an individual. While previous studies have found an association between CIMT and a risk of stroke, we did not find a relationship between CIMT and CT (Lorenz et al., 2007). Recently, Cardenas et al. (2012) examined this relationship in an older sample. Using similar technique to ours, they found no relationship between CIMT and most measures of brain volume or CT (Cardenas et al., 2012). They however found CIMT to be associated with regional thinning pertaining to the parietal cortex. In their analysis, they divided the whole cortex into lobes, considering each lobe separately as a region of interest. This may have increased the power to detect subtle changes in individual lobes. None of the clusters survived multiple corrections in our sample. This may however be due to our small sample size.
4.2. Emerging risk factors
There is a growing body of evidence linking peripheral inflammatory markers to brain structure and function. Molecular imaging studies have shown that peripheral inflammation immune/metabolic markers are directly associated with greater inflammation markers in the brain. Drake et al. used PET tracer PK 11195 to examine the relationship between cerebrovascular risk factors (but no stroke) and brain inflammation. They found that people with greater risk factors showed greater microglial activation in the brain, compared to normal controls (Drake et al., 2011). Similarly, a few studies have shown that modulating peripheral inflammation is associated with both functional and structural changes in the brain. Harrison et al. showed that inducing a peripheral inflammatory response using typhoid vaccine in normal adults is associated with change in bold signals in regions pertaining to modulation of mood in the brain (Harrison et al., 2009). More recently, Hannestad et al. found that systemic inflammation induced by endotoxin in humans was associated with higher normalised glucose metabolism in the insula. This change was associated with change in peak cytokine levels and also changes in social interest, suggesting that these may be linked to each other (Hannestad et al., 2012). We have previously shown that modulating peripheral inflammation in patients with rheumatoid arthritis, using adalimumab (a TNF inhibitor) is associated with a reduction in serotonin transporter availability in the brain (Cavanagh et al., 2010). A few structural MRI studies have shown an association between inflammatory markers and cortical and subcortical grey matter volume. Jefferson et al. in the Framingham cohort showed that inflammatory markers including IL6 were inversely associated with total brain volume (Jefferson et al., 2007). Marsland et al., showed an association between peripheral IL-6 levels and smaller grey matter volume in the hippocampus in middle aged adults (Marsland et al., 2008). Although we found an association between IL6 levels and CT pertaining to the parahippocampal gyrus, these clusters did not survive multiple testing corrections.
Our findings reflect those of a more recent study that found an association between hsCRP and cortical grey matter volume pertaining to perisylvian regions in a large cohort of healthy ageing subjects (Taki et al., 2012). We have replicated the finding in a smaller and younger sample. However, our clusters were more extensive than those described by the study. While most of the above studies have shown an inverse relationship between peripheral markers and cortical morphology, a few recent studies have suggested that the relationship between peripheral risk factors and cortical morphology may be more complex than earlier thought. For example, greater peripheral blood levels of TGF beta, an apoptotic and anti-proliferative factor have been associated with greater CT (Piras et al., 2012). We found similar relationships in the case of fibrinogen, IL6 and a few other clusters in other markers. None of them however survived multiple testing corrections, suggesting that the relationship between them and CT may not be as robust for these measures. However, this could be due to type 2 error due to the small sample size.
To our knowledge, no previous study has shown an association between ICAM-1 and CT. ICAM-1 is an adhesion molecule expressed by endothelial cells in response to inflammation—particularly pro-inflammatory cytokines like tumour necrosis factor (TNF) (which also is a potent stimulator of CRP) and physiological stress (Dietrich, 2002; Frank and Lisanti, 2008). Inflammatory activation of ICAM-1 has been shown to be associated with an increase in leukocyte migration and region specific (frontal and parietal) microglial activation in the brain (Dietrich, 2002; Huber et al., 2006). While this has mostly been demonstrated in primary inflammatory conditions of the brain, there are few studies examining the role of ICAM-1 in situations where inflammatory pathology is less manifested like major depression (Krishnadas and Cavanagh, 2012). A recent study has shown that selective serotonin reuptake inhibitors (SSRIs), medications primarily used in the treatment of depression, may have cardio-protective properties by directly inhibiting TNF induced ICAM-1 expression (Lekakis et al., 2010). The clusters in our study that correlated with CRP and ICAM-1 were in the inferior frontal and parietal cortices similar to that shown by Dietrich (2002). While we could postulate that these findings could represent a region specific relation between peripheral inflammatory and cell adhesion markers and the brain, causal assumptions cannot be made due to the cross sectional nature of our data.
4.3. Exploring covariates in the model
We found a significant positive relationship between education status and CT. This is similar to previous studies (Liu et al., 2012). Since education status was also related to LDL, ICAM and CRP, we explored the relationship between the above predictors and CT with education status as a potential covariate. All the predictors remained significantly associated with CT however, the strength of some of the relationships reduced, denoted by a reduction in the cluster size, suggesting that at least part of the variance explained by education status and the risk factors were shared. With regard smoking we found a significantly strong negative association between smoking status and CT, similar to previous studies (Kuhn et al., 2010). Just as education status, smoking status also showed significant association with LDL, ICAM and CRP. Surprisingly, the relationship between smoking status and LDL cholesterol was contrary to previous studies (Habets et al., 2011). Those who smoked had lower LDL cholesterol. The relationship between CRP and CT remained significant even with smoking status as covariate in the model. However, the relationship between ICAM and CT disappeared. This suggests that almost all of the variance explained by ICAM and CT was shared with smoking status. Theoretically we could argue that greater ICAM levels may be statistically mediating the relationship between smoking and CT. Smoking has indeed been shown to induce adhesion molecules in both pulmonary and peripheral blood (Noguchi, 1999; Schaberg et al., 1996). While this is mechanistically plausible, causal mediation cannot be attributed to our findings due to the cross sectional nature of the study.
Seven subjects in our study were prescribed statins. It could be argued that those with greater cholesterol were prescribed with statins, which have anti-inflammatory properties and may have contributed to an increase in regional CT. Our sample was underpowered to examine the effect of statin intake. On examining the scatter plot, in general, the distribution of those on statins was similar to those not on statins. However, at least in certain cases (TAG and ICAM), there seems to be an interaction between statin intake status and the relationship between the variables and cortical thickness. Our result differs from the previous study that used similar technique to ours and showed no effect of medication on CT. They found that the association was purely due to the cholesterol factor itself (Leritz et al., 2011). The relationship between medication status and CT should be further explored in studies with larger sample size.
4.4. Relevance of measuring the association between cardiovascular risk markers and cortical morphology
Quantifying the variance in cortical parameters that could be attributable to risk markers in health and illness is key to the understanding of the relationship between cardiovascular health and neural health. As mentioned above, PET studies have shown that greater levels of cardiovascular risk markers in the peripheral blood are associated with greater microglial activation in neurologically normal subjects (Drake et al., 2011). This suggests that pathophysiological processes are in play even in normal subjects who are at high risk of developing cardio/cerebrovascular diseases. Interestingly, psychiatric morbidity is often associated with greater cardiovascular risk and mortality. While this has traditionally been attributed to poor health choices and health care utilisation by this population, recent research suggests that such simplistic modelling of physical health co-morbidities or multi-morbidity may not be useful and may indeed be misleading (de Jonge and Roest, 2012). There is now a call to examine the role of cardiovascular and metabolic risk markers as common endophenotypes of both physical and psychiatric illnesses. In other words, there may be common genetic and environmental factors that may contribute to chronic metabolic illnesses like obesity and psychiatric illnesses like major depression (Bornstein et al., 2006). The link between peripheral cardiovascular risk markers and cortical thickness in our study may therefore be the independent phenotypic representation of a common genes or environment. It is now known that the brain is not an immune privileged organ, and proinflammatory cytokines like TNF alpha, which are potent stimulators of CRP, are also produced by astrocytes and microglia within the central nervous system and are important in synapse formation and synaptic neurotransmission and in turn neurocognitive function (McAfoose and Baune, 2009). Indeed, there is increasing evidence that inflammatory markers contribute to the pathophysiology of psychiatric illnesses (Krishnadas and Cavanagh, 2012).
More importantly, the lack of progress in developing effective treatments in psychiatry has led to the search for markers that may aid diagnosis or predict treatment response in what are highly heterogeneous conditions (Krishnadas and Cavanagh, 2012). Recently there has been an emphasis on combining imaging markers with peripheral blood risk markers in order to identify what may provide a “biological signature” that may help predict treatment response (Linden, 2012; Schmidt et al., 2011).
Exploring the relationship between cardio-metabolic risk factors and cortical morphology can also give us clues as to the pathophysiological link between high risk environmental situations like poor socioeconomic status (SES) and mental illnesses. For example, SES has been consistently associated with cognitive and mental health—which is thought to be the result of coordinated activity of large-scale networks across the whole cortex. SES has also been associated with greater cardio metabolic risk. Therefore an emerging question is whether the association between SES and cortical substrates of neurocognitive functions is mediated by the presence of greater cardio-metabolic risk in this population. Current evidence suggests that cumulative (both in time and across multiple physiological systems) physiological risk across the life span associated with socioeconomic deprivation may contribute to both mental and physical health over the life span (Gruenewald et al., 2012). McEwen et al. describe a process of allostasis, where physiological systems operate within and outside a given range of parameters in order to maintain homeostasis (McEwen and Seeman, 1999). In this context, “allostatic load” is thought to be the wear and tear that the body experiences as a result of activation of the above systems. This wear and tear represents either the ‘excess’ or the ‘inefficient’ operation of the above physiological systems. It is not surprising that, in this context, metabolic and inflammatory systems play a key role in the process of allostasis. A number of studies have shown a significant association between allostatic load (measured using a composite score of inflammatory and metabolic markers) and medical health (for e.g. cardiovascular disease) and neurocognitive function(Juster et al., 2010). These potential mechanisms may provide insight into how chronic adversity can affect physical and mental wellbeing (Kin et al., 2007). It is therefore reasonable to quantify any association between cardiovascular health and neural health in terms of gross cortical morphology.
4.5. Limitations
While the positive features of this study include a well-characterised community-based cohort, there are limitations to be acknowledged, there is some selection bias in that the participants opted in. We deliberately included only males in our study. The rationale behind this was to decrease variability in CT that could be attributable to gender (Sowell et al., 2007). Similarly, cardio-metabolic risk factors covary significantly with gender. For example, during the third and fourth decade of life, cholesterol levels show a sharper increase in men than in women. In addition, the same cardiovascular risk factors may impact differently on men and women. For example, HDL cholesterol and Triglycerides have been found to have a greater impact on cardiovascular disease risk in women compared to men (Roeters van Lennep et al., 2002). However, this meant that the findings of our study are less generalizable to the population. The parent study – PSOBID – was designed to explore the differences in a number of biomarkers between the least and most deprived groups with the greatest power. Therefore, the nature of the sampling technique used for recruiting subjects led to a bimodal distribution of a number of independent variables used in this study. However, CT (the dependent variables) did not differ between the most and the least deprived groups. Indeed, the mean CT (contributed by the DV) was normally distributed. Nevertheless, a sampling technique with equal distribution from all socioeconomic status with a larger sample size may have been more appropriate, in order to explore a dose dependent relationship between cardio-metabolic risk markers and CT. With regards multiple testing correction, we used the cluster wise approach when examining the relationship between risk markers and cortical thickness. This approach has been validated and used in recent studies exploring variance in cortical thickness (Ehrlich et al., 2012; Leritz et al., 2011). We opted for this approach, as the primary aim of our study was to look for any evidence for a “signal” in the cortex that could be attributable to the risk markers. For this, a cluster wise approach was thought to be sensitive and appropriate (Poldrack et al., 2011). We were not primarily interested in the spatial specificity or location of the significant clusters, and hence did not opt for a voxel wise approach. While this is not a limitation per se, when we repeated our analysis using a voxel wise FDR (0.05) approach for multiple testing corrections, none of the above regions survived the FDR correction. In other words, the test statistic at none of the voxels crossed the required significance threshold after multiple testing corrections using the FDR procedure. This could be either due to the small sample size or due to the fact that the relationship between the risk markers and the cortical thickness is spread across the cortex, but the magnitude of the relationship is modest at best. Previous cross sectional studies suggest that cerebrovascular disease may mediate the relationship between cardiovascular risk factors like diabetes and hypertension and cortical thickness in cognitively impaired individuals (Seo et al., 2012a, 2012b). It is therefore possible that the relationship between high CRP and ICAM and cortical thinning in our study was mediated by the presence of cerebrovascular pathology. None of our participants showed significant pathology on the scans. Moreover, the small sample size and the cross sectional nature of our data precludes us from making any meaningful conclusions regarding the role of causal mediation or mediators. In addition, greater LDL and TAG factor levels (generally associated with greater cardiovascular risk) were associated with greater cortical thickness. It is unlikely that this relationship was mediated by cerebrovascular pathology in our sample. In order to explore the role of causal mediators in this complex relationship, our findings should be replicated in larger study with greater variation in peripheral risk markers and a longitudinal design. Further work should also involve replication of the study in a larger population, including younger population, targeting critical periods of brain growth. Finally, future work to develop a clearer biological framework of a more comprehensive investigation of metabolic and inflammatory markers may be more informative.
5. Conclusion
In conclusion, this study has demonstrated the existence of a relationship between classic and emerging cardiovascular risk factors and CT involving a number of regions in the brain. The findings reinforce a body of existing literature increasingly showing a link between cardiovascular risk factors and the brain. A focussed investigation of factors determining inter-individual variations in regional CT in the adult brain could provide further clarity in our understanding of the relationship between various determinants of cardio-metabolic risk and cortical structures.
Acknowledgements
We would like to thank all the volunteers. We would also like to thank the Radiographers at the Institute of Neurological Sciences for performing the MRI scans.
Footnotes
This is an open-access article distributed under the terms of the Creative Commons Attribution-NonCommercial-No Derivative Works License, which permits non-commercial use, distribution, and reproduction in any medium, provided the original author and source are credited.
Funding: We thank Dr Mortimer and Theresa Sackler foundation for their support. This work was funded by the Glasgow Centre for Population Health, a partnership between NHS Greater Glasgow and Clyde, Glasgow City Council and the University of Glasgow, supported by the Scottish Government. The Glasgow Centre for Population Health had a role in the study design, data collection and analysis, decision to publish and preparation of the manuscript.
References
- Bender R., Lange S. Adjusting for multiple testing—when and how? Journal of Clinical Epidemiology. 2001;54(4):343–349. doi: 10.1016/s0895-4356(00)00314-0. [DOI] [PubMed] [Google Scholar]
- Bornstein S.R., Schuppenies A., Wong M.L., Licinio J. Approaching the shared biology of obesity and depression: the stress axis as the locus of gene-environment interactions. Molecular Psychiatry. 2006;11:892–902. doi: 10.1038/sj.mp.4001873. [DOI] [PubMed] [Google Scholar]
- Cardenas V.A., Reed B., Chao L.L., Chui H., Sanossian N., Decarli C.C., Mack W., Kramer J., Hodis H.N., Yan M., Buonocore M.H., Carmichael O., Jagust W.J., Weiner M.W. Associations among vascular risk factors, carotid atherosclerosis, and cortical volume and thickness in older adults. Stroke. 2012;43(11):2865–2870. doi: 10.1161/STROKEAHA.112.659722. [DOI] [PMC free article] [PubMed] [Google Scholar]
- Cavanagh J., Paterson C., McLean J., Pimlott S., McDonald M., Patterson J., Wyper D., McInnes I. Tumour necrosis factor blockade mediates altered serotonin transporter availability in rheumatoid arthritis: a clinical, proof-of-concept study. Annals of the Rheumatic Diseases. 2010;69:1251–1252. doi: 10.1136/ard.2009.107912. [DOI] [PubMed] [Google Scholar]
- Dale A.M., Fischl B., Sereno M.I. Cortical surface-based analysis. I. Segmentation and surface reconstruction. NeuroImage. 1999;9:179–194. doi: 10.1006/nimg.1998.0395. [DOI] [PubMed] [Google Scholar]
- Danesh J., Kaptoge S., Mann A.G., Sarwar N., Wood A., Angleman S.B., Wensley F., Higgins J.P., Lennon L., Eiriksdottir G., Rumley A., Whincup P.H., Lowe G.D., Gudnason V. Long-term interleukin-6 levels and subsequent risk of coronary heart disease: two new prospective studies and a systematic review. PLoS Medicine. 2008;5:e78. doi: 10.1371/journal.pmed.0050078. [DOI] [PMC free article] [PubMed] [Google Scholar]
- de Jonge P., Roest A.M. Depression and cardiovascular disease: the end of simple models. The British Journal of Psychiatry. 2012;201:337–338. doi: 10.1192/bjp.bp.112.110502. [DOI] [PubMed] [Google Scholar]
- Deans K.A., Bezlyak V., Ford I., Batty G.D., Burns H., Cavanagh J., de Groot E., McGinty A., Millar K., Shiels P.G., Tannahill C., Velupillai Y.N., Sattar N., Packard C.J. Differences in atherosclerosis according to area level socioeconomic deprivation: cross sectional, population based study. BMJ. 2009;339:b4170. doi: 10.1136/bmj.b4170. [DOI] [PMC free article] [PubMed] [Google Scholar]
- Denke M.A., Sempos C.T., Grundy S.M. Excess body weight. An under-recognized contributor to dyslipidemia in white American women. Archives of Internal Medicine. 1994;154:401–410. doi: 10.1001/archinte.154.4.401. [DOI] [PubMed] [Google Scholar]
- Dietrich J. The adhesion molecule ICAM-1 and its regulation in relation with the blood–brain barrier. Journal of Neuroimmunology. 2002;128:58–68. doi: 10.1016/s0165-5728(02)00114-5. [DOI] [PubMed] [Google Scholar]
- Dowlati Y., Herrmann N., Swardfager W., Liu H., Sham L., Reim E.K., Lanctot K.L. A meta-analysis of cytokines in major depression. Biological Psychiatry. 2010;67:446–457. doi: 10.1016/j.biopsych.2009.09.033. [DOI] [PubMed] [Google Scholar]
- Drake C., Boutin H., Jones M.S., Denes A., McColl B.W., Selvarajah J.R., Hulme S., Georgiou R.F., Hinz R., Gerhard A., Vail A., Prenant C., Julyan P., Maroy R., Brown G., Smigova A., Herholz K., Kassiou M., Crossman D., Francis S., Proctor S.D., Russell J.C., Hopkins S.J., Tyrrell P.J., Rothwell N.J., Allan S.M. Brain inflammation is induced by co-morbidities and risk factors for stroke. Brain, Behavior, and Immunity. 2011;25:1113–1122. doi: 10.1016/j.bbi.2011.02.008. [DOI] [PMC free article] [PubMed] [Google Scholar]
- Ehrlich S., Brauns S., Yendiki A., Ho B.C., Calhoun V., Schulz S.C., Gollub R.L., Sponheim S.R. Associations of cortical thickness and cognition in patients with schizophrenia and healthy controls. Schizophrenia Bulletin. 2012;38:1050–1062. doi: 10.1093/schbul/sbr018. [DOI] [PMC free article] [PubMed] [Google Scholar]
- Elias M.F., Elias P.K., Sullivan L.M., Wolf P.A., D'Agostino R.B. Obesity, diabetes and cognitive deficit: the Framingham Heart Study. Neurobiology of Aging. 2005;26(Suppl. 1):11–16. doi: 10.1016/j.neurobiolaging.2005.08.019. [DOI] [PubMed] [Google Scholar]
- Elias P.K., Elias M.F., D'Agostino R.B., Sullivan L.M., Wolf P.A. Serum cholesterol and cognitive performance in the Framingham Heart Study. Psychosomatic Medicine. 2005;67:24–30. doi: 10.1097/01.psy.0000151745.67285.c2. [DOI] [PubMed] [Google Scholar]
- Fischl B., Dale A.M. Measuring the thickness of the human cerebral cortex from magnetic resonance images. Proceedings of the National Academy of Sciences of the United States of America. 2000;97:11050–11055. doi: 10.1073/pnas.200033797. [DOI] [PMC free article] [PubMed] [Google Scholar]
- Fischl B., Sereno M.I., Dale A.M. Cortical surface-based analysis. II: inflation, flattening, and a surface-based coordinate system. NeuroImage. 1999;9:195–207. doi: 10.1006/nimg.1998.0396. [DOI] [PubMed] [Google Scholar]
- Fischl B., Rajendran N., Busa E., Augustinack J., Hinds O., Yeo B.T.T., Mohlberg H., Amunts K., Zilles K. Cortical folding patterns and predicting cytoarchitecture. Cerebral cortex (New York, N Y: 1991) 2008;18:1973–1980. doi: 10.1093/cercor/bhm225. [DOI] [PMC free article] [PubMed] [Google Scholar]
- Frank P.G., Lisanti M.P. ICAM-1: role in inflammation and in the regulation of vascular permeability. American Journal of Physiology. Heart and Circulatory Physiology. 2008;295:H926–H927. doi: 10.1152/ajpheart.00779.2008. [DOI] [PMC free article] [PubMed] [Google Scholar]
- Friston K. Ten ironic rules for non-statistical reviewers. NeuroImage. 2012;61:1300–1310. doi: 10.1016/j.neuroimage.2012.04.018. [DOI] [PubMed] [Google Scholar]
- Gallacher J., Bayer A., Lowe G., Fish M., Pickering J., Pedro S., Dunstan F., White J., Yarnell J., Ben-Shlomo Y. Is sticky blood bad for the brain? Hemostatic and inflammatory systems and dementia in the Caerphilly Prospective Study. Arteriosclerosis, Thrombosis, and Vascular Biology. 2010;30:599–604. doi: 10.1161/ATVBAHA.109.197368. [DOI] [PubMed] [Google Scholar]
- Gruenewald T.L., Karlamangla A.S., Hu P., Stein-Merkin S., Crandall C., Koretz B., Seeman T.E. History of socioeconomic disadvantage and allostatic load in later life. Social Science & Medicine. 2012;74:75–83. doi: 10.1016/j.socscimed.2011.09.037. [DOI] [PMC free article] [PubMed] [Google Scholar]
- Gunstad J., Paul R.H., Cohen R.A., Tate D.F., Spitznagel M.B., Grieve S., Gordon E. Relationship between body mass index and brain volume in healthy adults. The International Journal of Neuroscience. 2008;118:1582–1593. doi: 10.1080/00207450701392282. [DOI] [PubMed] [Google Scholar]
- Habets P., Marcelis M., Gronenschild E., Drukker M., van Os J. Reduced cortical thickness as an outcome of differential sensitivity to environmental risks in schizophrenia. Biological Psychiatry. 2011;69:487–494. doi: 10.1016/j.biopsych.2010.08.010. [DOI] [PubMed] [Google Scholar]
- Hagler D.J., Jr., Saygin A.P., Sereno M.I. Smoothing and cluster thresholding for cortical surface-based group analysis of fMRI data. NeuroImage. 2006;33:1093–1103. doi: 10.1016/j.neuroimage.2006.07.036. [DOI] [PMC free article] [PubMed] [Google Scholar]
- Hannestad J., Subramanyam K., Dellagioia N., Planeta-Wilson B., Weinzimmer D., Pittman B., Carson R.E. Glucose metabolism in the insula and cingulate is affected by systemic inflammation in humans. Journal of Nuclear Medicine. 2012;53:601–607. doi: 10.2967/jnumed.111.097014. [DOI] [PMC free article] [PubMed] [Google Scholar]
- Harrison N.A., Brydon L., Walker C., Gray M.A., Steptoe A., Critchley H.D. Inflammation causes mood changes through alterations in subgenual cingulate activity and mesolimbic connectivity. Biological Psychiatry. 2009;66:407–414. doi: 10.1016/j.biopsych.2009.03.015. [DOI] [PMC free article] [PubMed] [Google Scholar]
- Helfand M., Buckley D.I., Freeman M., Fu R., Rogers K., Fleming C., Humphrey L.L. Emerging risk factors for coronary heart disease: a summary of systematic reviews conducted for the U.S. Preventive Services Task Force. Annals of Internal Medicine. 2009;151:496–507. doi: 10.7326/0003-4819-151-7-200910060-00010. [DOI] [PubMed] [Google Scholar]
- Hoogendam Y.Y., van der Geest J.N., van der Lijn F., van der Lugt A., Niessen W.J., Krestin G.P., Hofman A., Vernooij M.W., Breteler M.M., Ikram M.A. Determinants of cerebellar and cerebral volume in the general elderly population. Neurobiology of Aging. 2012;33:2774–2781. doi: 10.1016/j.neurobiolaging.2012.02.012. [DOI] [PubMed] [Google Scholar]
- Huber J., Campos C., Mark K., Davis T. Alterations in blood-brain barrier ICAM-1 expression and brain microglial activation after lambda-carrageenan-induced inflammatory pain. American Journal of Heart and Circulation Physiology. 2006;290 doi: 10.1152/ajpheart.00747.2005. [DOI] [PMC free article] [PubMed] [Google Scholar]
- Isaac V., Sim S., Zheng H., Zagorodnov V., Tai E.S., Chee M. Adverse associations between visceral adiposity, brain structure, and cognitive performance in healthy elderly. Frontiers in Aging Neuroscience. 2011;3:12. doi: 10.3389/fnagi.2011.00012. [DOI] [PMC free article] [PubMed] [Google Scholar]
- Jefferson A.L., Massaro J.M., Wolf P.A., Seshadri S., Au R., Vasan R.S., Larson M.G., Meigs J.B., Keaney J.F., Lipinska I., Kathiresan S., Benjamin E.J., DeCarli C. Inflammatory biomarkers are associated with total brain volume: the Framingham Heart Study. Neurology. 2007;68:1032–1038. doi: 10.1212/01.wnl.0000257815.20548.df. [DOI] [PMC free article] [PubMed] [Google Scholar]
- Juster R.P., McEwen B.S., Lupien S.J. Allostatic load biomarkers of chronic stress and impact on health and cognition. Neuroscience and Biobehavioral Reviews. 2010;35:2–16. doi: 10.1016/j.neubiorev.2009.10.002. [DOI] [PubMed] [Google Scholar]
- Kin T., Yamano S., Sakurai R., Kajitani M., Okahashi Y., Nishiura N., Saito Y., Ueno S. Carotid atherosclerosis is associated with brain atrophy in Japanese elders. Gerontology. 2007;53:1–6. doi: 10.1159/000095385. [DOI] [PubMed] [Google Scholar]
- Knox S., Welsh P., Bezlyak V., McConnachie A., Boulton E., Deans K.A., Ford I., David Batty G., Burns H., Cavanagh J., Millar K., McInnes I.B., McLean J., Velupillai Y., Shiels P., Tannahill C., Packard C.J., Michael Wallace A., Sattar N. 25-Hydroxyvitamin D is lower in deprived groups, but is not associated with carotid intima media thickness or plaques: results from pSoBid. Atherosclerosis. 2012;223:437–441. doi: 10.1016/j.atherosclerosis.2012.05.001. [DOI] [PubMed] [Google Scholar]
- Krauss R.M., Winston M., Fletcher R.N., Grundy S.M. Obesity: impact of cardiovascular disease. Circulation. 1998;98:1472–1476. [PubMed] [Google Scholar]
- Krishnadas R., Cavanagh J. Depression: an inflammatory illness? Journal of Neurology, Neurosurgery, and Psychiatry. 2012;83:495–502. doi: 10.1136/jnnp-2011-301779. [DOI] [PubMed] [Google Scholar]
- Kuhn S., Schubert F., Gallinat J. Reduced thickness of medial orbitofrontal cortex in smokers. Biological Psychiatry. 2010;68:1061–1065. doi: 10.1016/j.biopsych.2010.08.004. [DOI] [PubMed] [Google Scholar]
- Lekakis J., Ikonomidis I., Papoutsi Z., Moutsatsou P., Nikolaou M., Parissis J., Kremastinos D.T. Selective serotonin re-uptake inhibitors decrease the cytokine-induced endothelial adhesion molecule expression, the endothelial adhesiveness to monocytes and the circulating levels of vascular adhesion molecules. International Journal of Cardiology. 2010;139:150–158. doi: 10.1016/j.ijcard.2008.10.010. [DOI] [PubMed] [Google Scholar]
- Leritz E.C., Salat D.H., Williams V.J., Schnyer D.M., Rudolph J.L., Lipsitz L., Fischl B., McGlinchey R.E., Milberg W.P. Thickness of the human cerebral cortex is associated with metrics of cerebrovascular health in a normative sample of community dwelling older adults. NeuroImage. 2011;54:2659–2671. doi: 10.1016/j.neuroimage.2010.10.050. [DOI] [PMC free article] [PubMed] [Google Scholar]
- Linden D.E. The challenges and promise of neuroimaging in psychiatry. Neuron. 2012;73:8–22. doi: 10.1016/j.neuron.2011.12.014. [DOI] [PubMed] [Google Scholar]
- Liu J.-P., Tang Y., Zhou S., Toh B.H., McLean C., Li H. Cholesterol involvement in the pathogenesis of neurodegenerative diseases. Molecular and Cellular Neurosciences. 2010;43:33–42. doi: 10.1016/j.mcn.2009.07.013. [DOI] [PubMed] [Google Scholar]
- Liu Y., Julkunen V., Paajanen T., Westman E., Wahlund L.O., Aitken A., Sobow T., Mecocci P., Tsolaki M., Vellas B., Muehlboeck S., Spenger C., Lovestone S., Simmons A., Soininen H. Education increases reserve against Alzheimer's disease—evidence from structural MRI analysis. Neuroradiology. 2012;54:929–938. doi: 10.1007/s00234-012-1005-0. [DOI] [PMC free article] [PubMed] [Google Scholar]
- Lorenz M.W., Markus H.S., Bots M.L., Rosvall M., Sitzer M. Prediction of clinical cardiovascular events with carotid intima-media thickness: a systematic review and meta-analysis. Circulation. 2007;115:459–467. doi: 10.1161/CIRCULATIONAHA.106.628875. [DOI] [PubMed] [Google Scholar]
- Luc G., Arveiler D., Evans A., Amouyel P., Ferrieres J., Bard J.M., Elkhalil L., Fruchart J.C., Ducimetiere P. Circulating soluble adhesion molecules ICAM-1 and VCAM-1 and incident coronary heart disease: the PRIME study. Atherosclerosis. 2003;170:169–176. doi: 10.1016/s0021-9150(03)00280-6. [DOI] [PubMed] [Google Scholar]
- Marsland A.L., Gianaros P.J., Abramowitch S.M., Manuck S.B., Hariri A.R. Interleukin-6 covaries inversely with hippocampal grey matter volume in middle-aged adults. Biological Psychiatry. 2008;64:484–490. doi: 10.1016/j.biopsych.2008.04.016. [DOI] [PMC free article] [PubMed] [Google Scholar]
- McAfoose J., Baune B.T. Evidence for a cytokine model of cognitive function. Neuroscience and Biobehavioral Reviews. 2009;33:355–366. doi: 10.1016/j.neubiorev.2008.10.005. [DOI] [PubMed] [Google Scholar]
- McEwen B.S., Seeman T. Protective and damaging effects of mediators of stress. Elaborating and testing the concepts of allostasis and allostatic load. Annals of the New York Academy of Sciences. 1999;896:30–47. doi: 10.1111/j.1749-6632.1999.tb08103.x. [DOI] [PubMed] [Google Scholar]
- McGuinness D., McGlynn L.M., Johnson P.C., MacIntyre A., Batty G.D., Burns H., Cavanagh J., Deans K.A., Ford I., McConnachie A., McGinty A., McLean J.S., Millar K., Packard C.J., Sattar N.A., Tannahill C., Velupillai Y.N., Shiels P.G. Socio-economic status is associated with epigenetic differences in the pSoBid cohort. International Journal of Epidemiology. 2012;41:151–160. doi: 10.1093/ije/dyr215. [DOI] [PubMed] [Google Scholar]
- McLean J., Krishnadas R., Batty G.D., Burns H., Deans K.A., Ford I., McConnachie A., McGinty A., McLean J.S., Millar K., Sattar N., Shiels P.G., Tannahill C., Velupillai Y.N., Packard C.J., Condon B.R., Hadley D.M., Cavanagh J. Early life socioeconomic status, chronic physiological stress and hippocampal N-acetyl aspartate concentrations. Behavioural Brain Research. 2012;235:225–230. doi: 10.1016/j.bbr.2012.08.013. [DOI] [PubMed] [Google Scholar]
- Miller B.J., Buckley P., Seabolt W., Mellor A., Kirkpatrick B. Meta-analysis of cytokine alterations in schizophrenia: clinical status and antipsychotic effects. Biological Psychiatry. 2011;70:663–671. doi: 10.1016/j.biopsych.2011.04.013. [DOI] [PMC free article] [PubMed] [Google Scholar]
- Nicholls S.J., Tuzcu E.M., Sipahi I., Schoenhagen P., Hazen S.L., Ntanios F., Wun C.-C., Nissen S.E. Effects of obesity on lipid-lowering, anti-inflammatory, and antiatherosclerotic benefits of atorvastatin or pravastatin in patients with coronary artery disease (from the REVERSAL study) The American Journal of Cardiology. 2006;97:1553–1557. doi: 10.1016/j.amjcard.2005.12.042. [DOI] [PubMed] [Google Scholar]
- Noguchi T. Soluble intercellular adhesion molecule-1 and vascular cell adhesion molecule-1 concentrations, and leukocyte count in smokers. Environmental Health and Preventive Medicine. 1999;4:71–74. doi: 10.1007/BF02931997. [DOI] [PMC free article] [PubMed] [Google Scholar]
- Packard C.J., Bezlyak V., McLean J.S., Batty G.D., Ford I., Burns H., Cavanagh J., Deans K.A., Henderson M., McGinty A., Millar K., Sattar N., Shiels P.G., Velupillai Y.N., Tannahill C. Early life socioeconomic adversity is associated in adult life with chronic inflammation, carotid atherosclerosis, poorer lung function and decreased cognitive performance: a cross-sectional, population-based study. BMC Public Health. 2011;11:42. doi: 10.1186/1471-2458-11-42. [DOI] [PMC free article] [PubMed] [Google Scholar]
- Palaniyappan L., Liddle P.F. Differential effects of surface area, gyrification and cortical thickness on voxel based morphometric deficits in schizophrenia. NeuroImage. 2012;60:693–699. doi: 10.1016/j.neuroimage.2011.12.058. [DOI] [PubMed] [Google Scholar]
- Panizzon M.S., Fennema-Notestine C., Eyler L.T., Jernigan T.L., Prom-Wormley E., Neale M., Jacobson K., Lyons M.J., Grant M.D., Franz C.E., Xian H., Tsuang M., Fischl B., Seidman L., Dale A., Kremen W.S. Distinct genetic influences on cortical surface area and cortical thickness. Cerebral Cortex. 2009;19:2728–2735. doi: 10.1093/cercor/bhp026. [DOI] [PMC free article] [PubMed] [Google Scholar]
- Phillips A.C., Batty G.D., van Zanten J.J.C.S.V., Mortensen L.H., Deary I.J., Calvin C.M., Carroll D. Cognitive ability in early adulthood is associated with systemic inflammation in middle age: the Vietnam experience study. Brain, Behavior, and Immunity. 2011;25:298–301. doi: 10.1016/j.bbi.2010.09.022. [DOI] [PubMed] [Google Scholar]
- Piras F., Salani F., Bossu P., Caltagirone C., Spalletta G. High serum levels of transforming growth factor beta1 are associated with increased cortical thickness in cingulate and right frontal areas in healthy subjects. Journal of Neuroinflammation. 2012;9:42. doi: 10.1186/1742-2094-9-42. [DOI] [PMC free article] [PubMed] [Google Scholar]
- Poldrack R.A., Mumford J.A., Nichols T.E. Cambridge University Press; Cambridge: 2011. Handbook of Functional MRI Data Analysis. [Google Scholar]
- Quinn T.J., Gallacher J., Deary I.J., Lowe G.D., Fenton C., Stott D.J. Association between circulating hemostatic measures and dementia or cognitive impairment: systematic review and meta-analyzes. Journal of Thrombosis and Haemostasis. 2011;9:1475–1482. doi: 10.1111/j.1538-7836.2011.04403.x. [DOI] [PubMed] [Google Scholar]
- Raji C.A., Ho A.J., Parikshak N.N., Becker J.T., Lopez O.L., Kuller L.H., Hua X., Leow A.D., Toga A.W., Thompson P.M. Brain structure and obesity. Human Brain Mapping. 2010;31:353–364. doi: 10.1002/hbm.20870. [DOI] [PMC free article] [PubMed] [Google Scholar]
- Rakic P. Evolution of the neocortex: a perspective from developmental biology. Nature Reviews Neuroscience. 2009;10:724–735. doi: 10.1038/nrn2719. [DOI] [PMC free article] [PubMed] [Google Scholar]
- Roeters van Lennep J.E., Westerveld H.T., Erkelens D.W., van der Wall E.E. Risk factors for coronary heart disease: implications of gender. Cardiovascular Research. 2002;53:538–549. doi: 10.1016/s0008-6363(01)00388-1. [DOI] [PubMed] [Google Scholar]
- Rosas H.D., Liu A.K., Hersch S., Glessner M., Ferrante R.J., Salat D.H., van der Kouwe A., Jenkins B.G., Dale A.M., Fischl B. Regional and progressive thinning of the cortical ribbon in Huntington's disease. Neurology. 2002;58:695–701. doi: 10.1212/wnl.58.5.695. [DOI] [PubMed] [Google Scholar]
- Schaberg T., Rau M., Oerter R., Liebers U., Rahn W., Kaiser D., Witt C., Lode H. Expression of adhesion molecules in peripheral pulmonary vessels from smokers and nonsmokers. Lung. 1996;174:71–81. doi: 10.1007/BF00177702. [DOI] [PubMed] [Google Scholar]
- Schmidt H.D., Shelton R.C., Duman R.S. Functional biomarkers of depression: diagnosis, treatment, and pathophysiology. Neuropsychopharmacology. 2011;36:2375–2394. doi: 10.1038/npp.2011.151. [DOI] [PMC free article] [PubMed] [Google Scholar]
- Seo S.W., Lee J.M., Im K., Park J.S., Kim S.H., Kim S.T., Ahn H.J., Chin J., Cheong H.K., Weiner M.W., Na D.L. Cortical thinning related to periventricular and deep white matter hyperintensities. Neurobiology of Aging. 2012;33:1156–1167. doi: 10.1016/j.neurobiolaging.2010.12.003. [DOI] [PubMed] [Google Scholar]
- Seo S.W., Lee J.M., Im K., Park J.S., Kim S.H., Kim S.T., Ahn J.H., Kim M.J., Kim G.H., Kim J.H., Roh J.H., Cheong H.K., Na D.L. Cardiovascular risk factors cause cortical thinning in cognitively impaired patients: relationships among cardiovascular risk factors, white matter hyperintensities, and cortical atrophy. Alzheimer Disease and Associated Disorders. 2012;26:106–112. doi: 10.1097/WAD.0b013e31822e0831. [DOI] [PubMed] [Google Scholar]
- Shamai L., Lurix E., Shen M., Novaro G.M., Szomstein S., Rosenthal R., Hernandez A.V., Asher C.R. Association of body mass index and lipid profiles: evaluation of a broad spectrum of body mass index patients including the morbidly obese. Obesity Surgery. 2011;21:42–47. doi: 10.1007/s11695-010-0170-7. [DOI] [PubMed] [Google Scholar]
- Shiels P.G., McGlynn L.M., MacIntyre A., Johnson P.C., Batty G.D., Burns H., Cavanagh J., Deans K.A., Ford I., McConnachie A., McGinty A., McLean J.S., Millar K., Sattar N., Tannahill C., Velupillai Y.N., Packard C.J. Accelerated telomere attrition is associated with relative household income, diet and inflammation in the pSoBid cohort. PLoS One. 2011;6:e22521. doi: 10.1371/journal.pone.0022521. [DOI] [PMC free article] [PubMed] [Google Scholar]
- Smith A., Patterson C., Yarnell J., Rumley A., Ben-Shlomo Y., Lowe G. Which hemostatic markers add to the predictive value of conventional risk factors for coronary heart disease and ischemic stroke? The Caerphilly Study. Circulation. 2005;112:3080–3087. doi: 10.1161/CIRCULATIONAHA.105.557132. [DOI] [PubMed] [Google Scholar]
- Solomon A., Leoni V., Kivipelto M., Besga A., Öksengård A.R., Julin P., Svensson L., Wahlund L.-O., Andreasen N., Winblad B., Soininen H., Björkhem I. Plasma levels of 24S-hydroxycholesterol reflect brain volumes in patients without objective cognitive impairment but not in those with Alzheimer's disease. Neuroscience Letters. 2009;462:89–93. doi: 10.1016/j.neulet.2009.06.073. [DOI] [PubMed] [Google Scholar]
- Sowell E.R., Peterson B.S., Kan E., Woods R.P., Yoshii J., Bansal R., Xu D., Zhu H., Thompson P.M., Toga A.W. Sex differences in cortical thickness mapped in 176 healthy individuals between 7 and 87 years of age. Cerebral Cortex. 2007;17:1550–1560. doi: 10.1093/cercor/bhl066. [DOI] [PMC free article] [PubMed] [Google Scholar]
- Stein J.H., Korcarz C.E., Hurst R.T., Lonn E., Kendall C.B., Mohler E.R., Najjar S.S., Rembold C.M., Post W.S., American Society of Echocardiography Carotid Intima-Media Thickness Task Force Use of carotid ultrasound to identify subclinical vascular disease and evaluate cardiovascular disease risk: a consensus statement from the American Society of Echocardiography Carotid Intima-Media Thickness Task Force. Endorsed by the Society for Vascular Medicine. Journal of the American Society of Echocardiography. 2008;21:93–111. doi: 10.1016/j.echo.2007.11.011. (quiz 189-190) [DOI] [PubMed] [Google Scholar]
- Taki Y., Thyreau B., Kinomura S., Sato K., Goto R., Wu K., Kakizaki M., Tsuji I., Kawashima R., Fukuda H. Correlation between high-sensitivity C-reactive protein and brain gray matter volume in healthy elderly subjects. Human Brain Mapping. 2012 doi: 10.1002/hbm.22073. [DOI] [PMC free article] [PubMed] [Google Scholar]
- Teunissen C.E., van Boxtel M.P., Bosma H., Bosmans E., Delanghe J., De Bruijn C., Wauters A., Maes M., Jolles J., Steinbusch H.W., de Vente J. Inflammation markers in relation to cognition in a healthy aging population. Journal of Neuroimmunology. 2003;134:142–150. doi: 10.1016/s0165-5728(02)00398-3. [DOI] [PubMed] [Google Scholar]
- Toth P.P. High-density lipoprotein and cardiovascular risk. Circulation. 2004;109:1809–1812. doi: 10.1161/01.CIR.0000126889.97626.B8. [DOI] [PubMed] [Google Scholar]
- Umemura T., Kawamura T., Umegaki H., Mashita S., Kanai A., Sakakibara T., Hotta N., Sobue G. Endothelial and inflammatory markers in relation to progression of ischaemic cerebral small-vessel disease and cognitive impairment: a 6-year longitudinal study in patients with type 2 diabetes mellitus. Journal of Neurology, Neurosurgery, and Psychiatry. 2011;82:1186–1194. doi: 10.1136/jnnp.2010.217380. [DOI] [PubMed] [Google Scholar]
- van der Meer I.M., Bots M.L., Hofman A., del Sol A.I., van der Kuip D.A., Witteman J.C. Predictive value of noninvasive measures of atherosclerosis for incident myocardial infarction: the Rotterdam Study. Circulation. 2004;109:1089–1094. doi: 10.1161/01.CIR.0000120708.59903.1B. [DOI] [PubMed] [Google Scholar]
- Velupillai Y.N., Packard C.J., Batty G.D., Bezlyak V., Burns H., Cavanagh J., Deans K., Ford I., McGinty A., Millar K., Sattar N., Shiels P., Tannahill C. Psychological, social and biological determinants of ill health (pSoBid): study protocol of a population-based study. BMC Public Health. 2008;8:126. doi: 10.1186/1471-2458-8-126. [DOI] [PMC free article] [PubMed] [Google Scholar]
- Walther K., Birdsill A.C., Glisky E.L., Ryan L. Structural brain differences and cognitive functioning related to body mass index in older females. Human Brain Mapping. 2010;31:1052–1064. doi: 10.1002/hbm.20916. [DOI] [PMC free article] [PubMed] [Google Scholar]
- Wannamethee S.G., Whincup P.H., Lennon L., Rumley A., Lowe G.D. Fibrin D-dimer, tissue-type plasminogen activator, von Willebrand factor, and risk of incident stroke in older men. Stroke. 2012;43:1206–1211. doi: 10.1161/STROKEAHA.111.636373. [DOI] [PubMed] [Google Scholar]
- Ward M.A., Bendlin B.B., McLaren D.G., Hess T.M., Gallagher C.L., Kastman E.K., Rowley H.A., Asthana S., Carlsson C.M., Sager M.A., Johnson S.C. Low HDL cholesterol is associated with lower gray matter volume in cognitively healthy adults. Frontiers in Aging Neuroscience. 2010;2 doi: 10.3389/fnagi.2010.00029. [DOI] [PMC free article] [PubMed] [Google Scholar]
- Wersching H., Duning T., Lohmann H., Mohammadi S., Stehling C., Fobker M., Conty M., Minnerup J., Ringelstein E.B., Berger K., Deppe M., Knecht S. Serum C-reactive protein is linked to cerebral microstructural integrity and cognitive function. Neurology. 2010;74:1022–1029. doi: 10.1212/WNL.0b013e3181d7b45b. [DOI] [PubMed] [Google Scholar]
- Williams V.J., Leritz E.C., Shepel J., McGlinchey R.E., Milberg W.P., Rudolph J.L., Lipsitz L.A., Salat D.H. Interindividual variation in serum cholesterol is associated with regional white matter tissue integrity in older adults. Human Brain Mapping. 2012 doi: 10.1002/hbm.22030. [DOI] [PMC free article] [PubMed] [Google Scholar]
- Wright C.B., Sacco R.L., Rundek T.R., Delman J.B., Rabbani L.E., Elkind M.S.V. Interleukin-6 is associated with cognitive function: the Northern Manhattan Study. Journal of Stroke and Cerebrovascular Diseases. 2006;15:34–38. doi: 10.1016/j.jstrokecerebrovasdis.2005.08.009. [DOI] [PMC free article] [PubMed] [Google Scholar]
- Yaffe K., Lindquist K., Penninx B.W., Simonsick E.M., Pahor M., Kritchevsky S., Launer L., Kuller L., Rubin S., Harris T. Inflammatory markers and cognition in well-functioning African-American and white elders. Neurology. 2003;61:76–80. doi: 10.1212/01.wnl.0000073620.42047.d7. [DOI] [PubMed] [Google Scholar]
- Yokum S., Ng J., Stice E. Relation of regional gray and white matter volumes to current BMI and future increases in BMI: a prospective MRI study. International journal of obesity. 2012;36:656–664. doi: 10.1038/ijo.2011.175. (2005) [DOI] [PMC free article] [PubMed] [Google Scholar]