Abstract
Due to the inherently flexible nature of a protein – protein interaction surface, it is difficult both to inhibit the association with a small molecule, and to predict how it might bind to the surface. In this study, we have examined small molecules that mediate the interaction between a WWI motif on the C-helix of HIV-1 glycoprotein-41 and a deep hydrophobic pocket contained in the interior N-helical trimer. Association between these two components of gp41 leads to virus–cell and cell–cell fusion, which could be abrogated in the presence of an inhibitor that binds tightly in the pocket. We have studied a comprehensive combinatorial library of α-helical peptidomimetics, and found that compounds with strongly hydrophobic side chains had the highest affinity. Computational docking studies produced multiple possible binding modes due to the flexibility of both the binding site and the peptidomimetic compounds. We applied a transferred paramagnetic relaxation enhancement (PRE) experiment to two selected members of the library, and showed that addition of a few experimental constraints enabled definitive identification of unique binding poses. Computational docking results were extremely sensitive to side chain conformations, and slight variations could preclude observation of the experimentally validated poses. Different receptor structures were required for docking simulations to sample the correct pose for the two compounds. The study demonstrated the sensitivity of predicted poses to receptor structure and indicated the importance of experimental verification when docking to a malleable protein – protein interaction surface.
Introduction
Mediation of protein – protein interactions is important in current drug discovery, due to their ubiquitous involvement in cellular mechanisms, for example in signaling pathways and viral interactions.[1] Inhibiting protein – protein interactions with small molecules requires the identification of druggable targets or “hotspots” along the interaction surface. Computational modeling, often used to guide rational drug design, is complicated by the conformational flexibility of these sites. Furthermore, protein – protein interaction inhibitors are often larger than typical enzyme inhibitors, with more degrees of freedom, and can adopt a large number of conformations in the simulations.
An example is the structure of a hydrophobic pocket in HIV-1 glycoprotein-41 (gp41) that has been the target of low molecular weight fusion inhibitors.[2; 3; 4; 5] The pocket is located in the gp41 N-heptad repeat (NHR) trimeric coiled coil (residues 565–581, uniprot entry P04578) and is occupied by C-heptad repeat (CHR) helices (residues 628–635) during the gp41 conformational transition that accompanies fusion.[6] There are over 50 structures that include this pocket in the Protein Data Bank (PDB), and they display a wide variety of side chain conformations depending on the composition of the complexes[7] and even crystal space group.[3; 5] The result is significant variation in shape and electrostatics of the pocket, limiting the accuracy of computational predictions. Crystal structures of gp41 – ligand complexes have not been obtained, due to their low solubility and obstructed binding sites in the crystal packing of NHR trimers. Studies of low molecular weight fusion inhibitors have relied on computational models of binding.[8; 9; 10; 11] In many cases, the ligand was predicted to have a hydrogen bond or electrostatic interaction between a carboxylate group and the pocket lysine-574, similar to the salt bridge predicted for the intrinsic C-peptide at this location.[12; 13]
In this study, we have investigated the binding of peptidomimetic compounds in the hydrophobic pocket of gp41, using AutoDock-Vina to simulate docked conformations, and introducing experimental data on binding and ligand conformation in order to guide the docking results. The purpose of the study was to see whether a handful of experimental constraints enabled discrimination between the computational poses. It has proved feasible to obtain a few distance constraints on ligands in fast exchange, through the use of the transferred paramagnetic relaxation effect (PRE).[14] We have studied two small ligands, each with two rotatable bonds, by a method in which a spin-labeled CHR probe peptide binding adjacent to the hydrophobic pocket on the NHR provided distance constraints which aided in elucidating the bound conformation.[15; 16] The NHR was represented by the coiled coil mimetic structure Fe(env5.0)3, one of several constructs designed to investigate small molecule binding to gp41.[17; 18; 19; 20; 21; 22] The compounds selected for the PRE study are members of a peptidomimetic library designed with an aryl alkoxy - amino acid template and containing all possible combinations of the 20 natural amino acid side chains or related derivatives. These are a promising class of compounds for mediating α-helical protein – protein interactions, including gp41.[23; 24] We have examined the library to determine the optimal side chain combinations for binding in the gp41 hydrophobic pocket, and to study the binding mode. The most potent compounds bind to gp41 and inhibit HIV-1 fusion with low μM potency. As expected, computational docking studies in various receptor structures revealed multiple possible binding modes for the compounds. We carried out PRE studies on two compounds with mid-μM potency that were in fast exchange, with the idea that results obtained might be extrapolated to the larger library. In particular, the ability to designate a particular receptor structure that was validated by experiment could help to narrow down possible poses of other members of the library. Furthermore the study enabled us to extend the application of the transferred PRE method to larger ligands having 5–6 degrees of freedom.
Methods
Materials and library construction
The library of 400 individual compounds was prepared as detailed[23] following protocols previously disclosed.[25; 26; 27; 28] Peptides representing the NHR (Fe(env5.0)3) and CHR (C29-e5.0) were synthesized and used as previously described.[16] MTSL (S-(2,2,5,5-tetramethyl-2,5-dihydro-1H-pyrrol-3-yl)methyl methanesulfonothioate) (Toronto Research Chemicals) was attached using a standard procedure at the N-terminal cysteine of C29-e5.0. Fluorescein was similarly attached at the C-terminal cysteine of C18-e2.0.
Binding studies
A single point screen of the 400-member peptidomimetic library was conducted with a competitive inhibition fluorescence assay for hydrophobic pocket binding.[19] Briefly, the fluorescence intensity in a mixture of 7 μM Fe(env2.0)3 binding sites and 50nM fluorescein-labeled C-peptide C18-e2.0 (C18-e2.0FL) was measured in duplicate in 4% DMSO in the presence or absence of 40 μM compounds. Fluorescence values, which are directly related to the binding affinity of the compounds, were measured relative to control measurements containing no Fe(env2.0)3. The KI’s of some of the most potent compounds were obtained by dose response measurements. The two compounds selected for NMR analysis were tested against the receptor Fe(env2.0K574Nle)3, in which the lysine at position 574 (HXB2 numbering) was replaced with norleucine.
Cell-cell fusion and cytotoxicity testing
Cell-cell fusion was measured following a published procedure,[29] and using cell lines obtained through the NIH AIDS Research and Reference Reagent Program, Division of AIDS, NIAID, NIH. TZM-bl cells (#8129, contributed by J.C. Kappes, X. Wu and Tranzyme Inc.) expressing CD4, CCR5 and CXCR4, [30] and containing an integrated reporter gene for firefly luciferase under control of HIV-1 LTR [31] were used as target cells; HL2/3 (#1294, contributed by B.K. Felber and G.N. Pavlakis) which produce HXB2 Env, Tat and Rev[32] were used as effector cells. Briefly, TZM-bl cells were plated overnight in DMEM, then the medium exchanged with reduced serum medium, and HL2/3 effector cells added in the presence or absence of compounds, in a total final concentration of 1% DMSO. The extent of fusion was measured after 6 hours using Luciferase Assay Reagent (Promega). Cytotoxicity was assessed under similar conditions in a second assay using Cytotox Glo (Promega).
NMR measurements
Samples of O2N-[HoPhe]-Ala-OH and O2N-[Ala]-Nap-OH for NMR measurements contained 4% and 10% d6-DMSO respectively, 25 mM d11-Tris, 25mM d4-acetic acid and 0.1 mM TSP in 100% D2O at pD 6.8. In each experiment, the concentration of ligand was 200μM and the concentrations of Fe(env5.0)3 (binding sites) and C29-e5.0 (spin-labeled and unlabeled) were varied between 2 and 12 μM. NMR relaxation measurements were recorded on a Bruker Avance DMX 600 spectrometer equipped with a cryogenic probe. Transverse relaxation rates were determined from a CPMG experiment with presaturation to suppress the residual water peak [33; 34; 35]. The delay between 180° pulses was 100μs in order to suppress relaxation due to the J-coupling between geminal protons.[36] For O2N-[HoPhe]-Ala-OH, CPMG time points were collected at 0.5, 57, 114, 239, 359, 477, 716, and 954 ms. Selected time points were repeated at the end of the experiments to test for sample stability over the 1–2 hours of measurement. For O2N-[Ala]-Nap-OH, relaxation parameters were fit to two points, with CPMG pulse trains of duration 0.57 and 710 ms with a third point collected at 355 ms to fit fast relaxing resonances.[37] Chemical shift assignments of O2N-[HoPhe]-Ala-OH and O2N-[Ala]-Nap-OH were confirmed with a COSY spectrum.[38]
The transverse relaxation rate R2obs is a weighted average of free and bound states as a function of fractional occupancy for a ligand in fast exchange. In the diamagnetic case:
| (1) |
Subscripts b and f refer to bound and free values respectively. fb is the fraction of bound ligand, calculated from the KD values 65±10 μM and 30±8 μM for O2N-[HoPhe]-Ala-OH and O2N-[Ala]-Nap-OH respectively.. Equation (1) assumes negligible exchange broadening, although the exchange broadening term is proportional to fb to first order and could be included in equation (1).[15] In paramagnetic samples, an additional contribution to R2obs occurs when both ligand and paramagnetic C-peptide are bound to the receptor: [15; 16]
| (2) |
fb′ is the fractional occupancy of labeled C-peptide, which has a KD = 3±0.3 μM. R2bpara, the paramagnetic relaxation enhancement (PRE) of bound ligand protons, was obtained using the following procedure:
Diamagnetic relaxation rates obtained by varying Fe(env5.0)3 and C29-e5.0 concentrations in tandem over the range 2–12μM were fit to a straight line as a function of fb (equation 1). The best-fit lines were then subtracted from the similarly obtained relaxation rates of the ligand in the paramagnetic samples and the resulting data fit to a straight line as a function of the product of fb and fb′ (equation 2). The slope of the line is R2bpara. Errors in fitting the slopes of both diamagnetic and paramagnetic data were added to obtain the error in observed R2bpara. In addition, the calculations were repeated using the maximum and minimum KD for both ligands and probe peptide and extracting the lowest and the highest PRE’s obtained.
The PRE is proportional to the inverse sixth power of the distance between the unpaired electron on the MTSL spin-label and the proton in question according to the Solomon-Bloembergen equation:[39]
| (3) |
| (4) |
KS is composed of nuclear and electronic constants[39] and has the value 1.23375 × 10⁷ Å6 ns−1.
Computational procedures
Low energy solution conformations of O2N-[HoPhe]-Ala-OH and O2N-[Ala]-Nap-OH were obtained from a SMILES string using Omega2 and Szybki (OpenEye Inc.), and docked into the hydrophobic pocket of 3p7k, 2r5d, 2r5b and 2kp8 using AutoDock-Vina.[40] Docked structures were minimized in XPLOR-NIH to obtain a low energy structure, by sequential variation of protein side chain, then ligand, and then protein side chain positions, holding backbone atoms fixed. C29-e5.0 with an N-terminal MTSL-labeled cysteine was docked into 3p7k, 2r5d and 2r5b, which are all structures that do not contain a C-peptide, using homology modeling from 1IF3.[41] In 2kp8, the existing C-peptide starting at T640[42] was extended by two residues in the N-terminal direction in order to include all residues of C29-e5.0 (Figure 5, Figure S2). The MTSL side chain was defined in the XPLOR-NIH protein topology and parameter files. Topology and parameter files for O2N-[HoPhe]-Ala-OH and O2N-[Ala]-Nap-OH were determined using xplo2d,[43] and modified to conform to AutoDock charges. Ligand poses were analyzed with the NMR data, using PRE constraints interpreted as distances by the Solomon-Bloembergen equation[39] at various correlation times τc.[44] Based on previous results,[16] we used one and three conformer representations of the MTSL side chain for evaluation of docked conformations, and a one conformer representation for PRE-based minimization. Final poses discussed in the text were evaluated using τc =12ns[16]. Agreement between observed and calculated PRE was measured using the Q-factor defined by Iwahara et al.[45]
Figure 5.
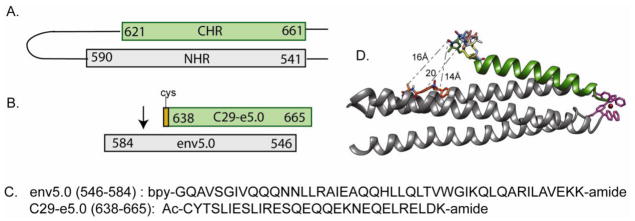
Peptides used in PRE studies. A. Schematic representation of the extracellular hairpin of gp41, with helical residues numbered and shown as rectangles; B. NHR (env5.0) and CHR (C29-e5.0) peptides used to expose ligands binding in the hydrophobic pocket to a paramagnetic relaxation gradient; C. Amino acid sequences of env5.0 and C29-e5.0. Env5.0 includes 4 residues preceding and 3 residues following the gp41 sequence; D. Structural model of C29-e5.0 bound to Fe(env5.0)3 showing a multiconformer representation of the MTSL side chain and representative distances to a bound ligand.
Results and Discussion
Binding studies of a 2-subunit peptidomimetic library revealed a strong propensity for aromatic substituents
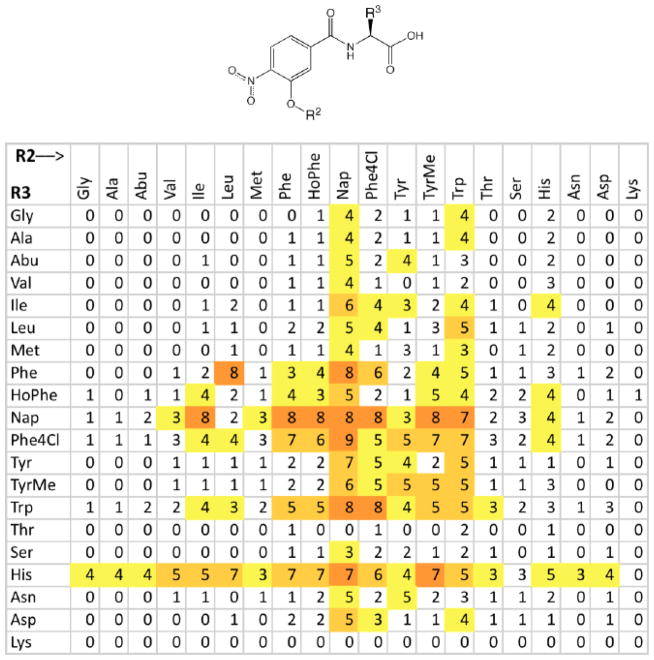
We have recently investigated a 3-subunit α-helical peptidomimetic library[23] for gp41 hydrophobic pocket binding and fusion inhibition, and discovered a requirement for aromatic side chains at a minimum of two of the three subunit positions.[24] In that study, we alluded to the binding characteristics of the two-subunit precursor library O2N-[R2]-R3-COOH (Figure 1, Supplementary Data Figure S1). The relative affinities of the 400 compounds in this library for the gp41 hydrophobic pocket were determined from a competitive inhibition fluorescence intensity assay, which measures displacement of a fluorescent peptide probe C18-e2.0FL from a metallopeptide receptor Fe(env2.0)3 mimicking the gp41 hydrophobic pocket.[17; 19] Increased fluorescence intensity is correlated to higher binding affinity. The results are shown in Figure 1 as a function of aryl-alkoxy and amino acid side chain substituents. There was a clear propensity for aromatic substituents at both positions on the scaffold, most notably Nap or Trp containing molecules. Several high affinity compounds were analyzed further by dose response binding (KI) and cell-cell fusion (IC50) inhibition titrations. A low μM KI (1–6 μM) and mid- to low-μM IC50 (5–20 μM) for fusion was observed for most compounds (Table 1). Potency of three-subunit compounds was not markedly increased above that of the two-subunit compounds.[24]
Figure 1.
A 20×20 matrix of relative fluorescence values for the 400-member peptidomimetic library with structure as shown ((see Supplementary Data Figure S1 for side chain structures).
Table 1.
Observed inhibition constants and 50% inhibitory concentration for cell-cell fusion and cytotoxicity of select peptidomimetic compounds
| Compound | KI (HP)† | IC50 CCF | CC50 |
|---|---|---|---|
| [Ala]-Nap | 30 ± 8 | 313 | > 50 |
| [Nap]-Phe4Cl | 1.0 ± 0.13 | 8 | > 50 |
| [Nap]-Phe | 2.2 ± 0.11 | 16 | ≫ 50 |
| [Nap]-Trp | 1.7 ± 0.12 | 12 | ≫ 50 |
| [Nap]-Nap | 1.7 ± 0.17 | 5 | > 50 |
| [HoPhe]-Nap | 2.9 ± 0.26 | 12 | ≫ 50 |
| [Phe4Cl]-Nap | 2.7 ± 0.21 | 7 | ≫ 50 |
| [Phe]-Nap | 2.0 ± 0.18 | 13 | ≫ 50 |
| [Ile]-Nap | 5.9 ± 0.32 | 26 | ≫ 50 |
| [TyrMe]-Nap | 1.6 ± 0.07 | 12 | ≫ 50 |
| [Trp]-Phe | 2.9 ± 0.31 | 4 | ≫ 50 |
| [Trp]-Nap | 3.6 ± 0.24 | 9 | ≫ 50 |
| [Trp]-Trp | 2.3 ± 0.56 | 19 | ≫ 50 |
| [HoPhe]-Trp | 3.9 ± 0.40 | 16 | ≫ 50 |
| [Phe4Cl]-Trp | 1.5 ± 0.19 | 17 | ≫ 50 |
| [Phe]-Trp | 2.8 ± 0.12 | 9 | ≫ 50 |
| [HoPhe]-Ala | 65 ± 10 | >500 | >500 |
Results are in μM,
inhibition constant for the hydrophobic pocket; experiments were conducted in duplicate; cell-cell fusion results ±50%
Computational modeling did not reveal a unique binding pose
The binding data indicated an important role for aromatic side chain interactions in the pocket, suggesting that the compounds could be mimicking the conformation of the W-W side chains of the intrinsic C-peptide by extending into the pocket.[46; 47; 48] Peptidomimetic compounds were docked into the hydrophobic pockets of four PDB structures of the gp41 NHR: 3p7k, a crystal structure of apo - gp41 formed from three 45-residue N-peptides,[49] 2r5d and 2r5b, crystal structures of IQN17 bound to a D-peptide PIE7,[3] and 2kp8, an NMR-based structure of a truncated helical hairpin with a small molecule [42]. RMS deviations in side chains of pocket residues between these structures averaged around 3Å (residues 565–581, HXB2 numbering), while backbone atoms deviated by ≤ 0.84Å (Supplementary data Figure S2). Several of the docked poses were compact structures with stacked aromatic rings projecting into the pocket, but there were also poses in which the rings were splayed across the binding site, and they included different orientations of the N- and C-termini of the ligands. Examples are shown for O2N-[HoPhe]-[Nap]-COOH in the Supplementary Data Figure S3.
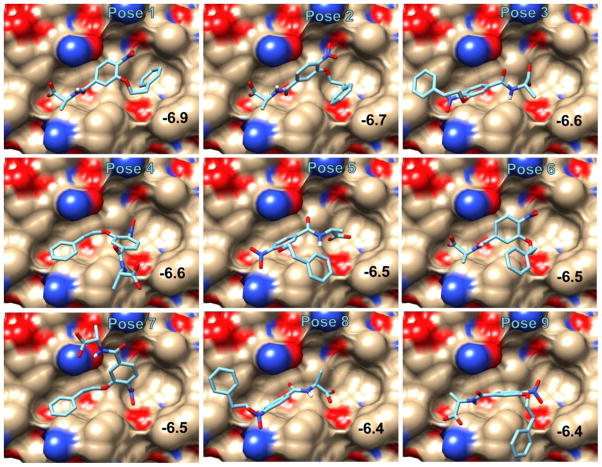
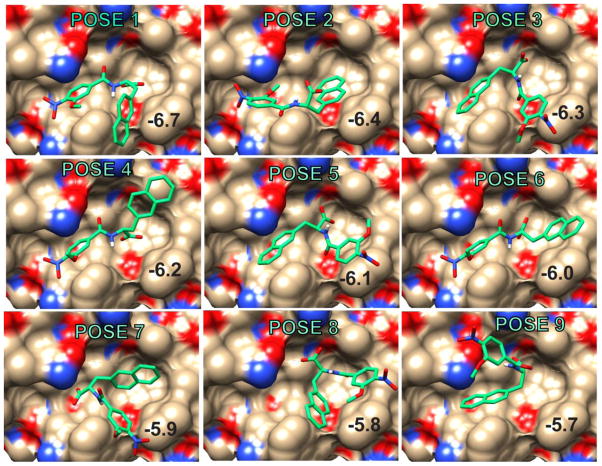
We used paramagnetic NMR methods to evaluate the computational results on two library members, O2N-[HoPhe]-Ala-OH and O2N-[Ala]-Nap-OH. With KI = 65 ± 10 μM and 30 ± 8 μM respectively, these compounds are in fast exchange on the NMR time scale. In fast exchange, properties of the bound ligand are transferred to the free ligand (equations (1) and (2)), allowing the use of low concentrations of the hydrophobic receptor, while enabling study of the mode of interaction of an aromatic subunit. Figures 2 and 3 show the nine lowest energy computational poses adopted by these ligands in receptors 2r5d (O2N-[HoPhe]-Ala-OH) and 2r5b (O2N-[Ala]-Nap-OH). Additional examples are shown in Supplementary Data Figures S3-S6. We collected experimental data to see we if could discriminate between the different poses.
Figure 2.
The nine top poses of O2N-[HoPhe]-Ala-OH produced by AutoDock-Vina docking and scoring in the hydrophobic pocket of 2r5d. The docking score is indicated in each panel.
Figure 3.
The nine top poses of O2N-[Ala]-Nap-OH produced by AutoDock-Vina docking and scoring in the hydrophobic pocket of 2r5b. The docking score is indicated in each panel.
There was no significant energetic contribution from an interaction with the side chain amino group of lysine-574
The hydrophobic pocket is spanned by residues 565–581 (HXB2 numbering) from two parallel NHR helices, and includes several residues which contribute polar interactions around the edge of the pocket. One of these is lysine-574, which is believed to form a salt bridge with the apposing C-peptide.[13] Binding studies were conducted using a receptor in which lysine-574 was substituted with norleucine. This removed the terminal NH3+ group while retaining the hydrophobic properties of the aliphatic chain. This substitution failed to increase the binding constant of the peptide probe C18-e2.0FL, and also caused no discernable change in the inhibition constants of O2N-[HoPhe]-Ala-OH and O2N-[Ala]-Nap-OH. It therefore appears that a hydrogen bond or salt bridge with lysine-574 does not play a key role in stabilizing receptor – ligand or receptor – peptide complexes.
NMR PRE provided constraints on compound orientation
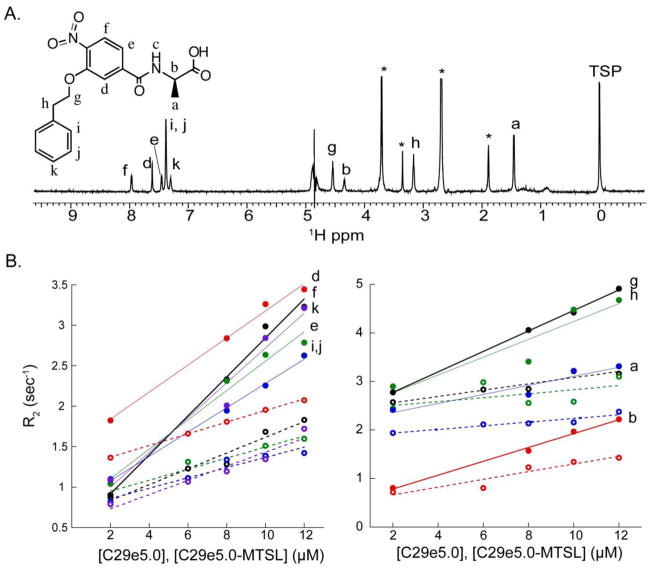
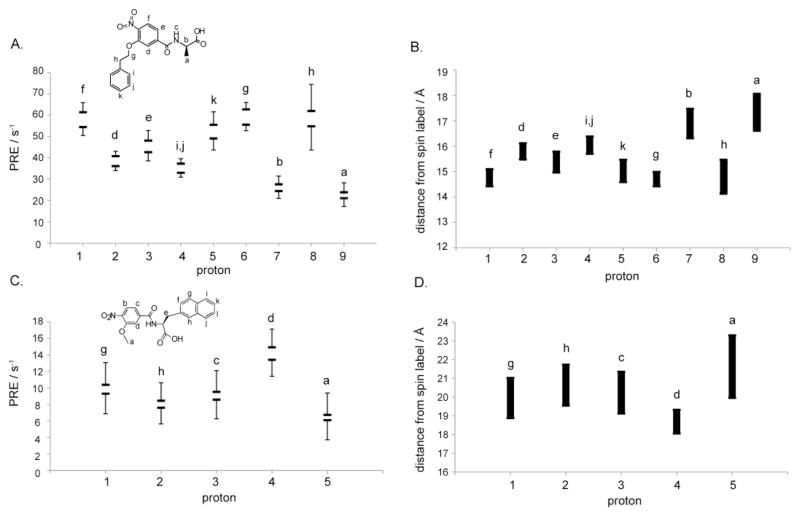
The 1D NMR spectrum of O2N-[HoPhe]-Ala-OH is shown in Figure 4, together with relaxation changes that occurred in the presence of coiled coil receptor Fe(env5.0)3 and either labeled or unlabeled C-peptide C29-e5.0. The label used was MTSL, coupled through an N-terminal cysteine. C29-e5.0 binds adjacent to the hydrophobic pocket in an antiparallel orientation, positioning the label at the N-terminus of the pocket (Figure 5).[15] The effect of the unpaired electrons on MTSL was to broaden (Figure 4B) the resonances of bound ligand compared to a diamagnetic control. Measurements were made over a range of receptor and C-peptide concentrations to improve the accuracy of the experimental data. The final PRE values were obtained by subtracting the diamagnetic best-fit line (equation (1)) from the paramagnetic data and plotting the results against fb·fb′ (equation (2)). The slope of the line gave R2bpara which is related to distance from the spin label according to equations (3) and (4). Errors in R2bpara resulted from the uncertainty in KD’s and from line fitting of the diamagnetic and paramagnetic data. Errors were incorporated into the observed R2bpara by repeating the calculation using ligand and probe peptide KD’s at the extremes of their error range, and adding the sum of the errors of the best fit lines in paramagnetic and diamagnetic data to obtain the maximum range of R2bpara. Constraints on the ortho and meta protons of the HoPhe phenyl ring were absent due to severe overlap of these protons, leaving 8 measured PRE’s. A similar experiment was conducted for O2N-[Ala]-Nap-OH, for which the aromatic spectrum is shown in Figure 6. Due to significant overlap, only 5 proton transverse relaxation rates were measurable. The experimental data are reported in Tables 2 and 3 and in Figure 7. PRE ranges differed for the two compounds, which could be a result of an experimental error in protein concentration or KD or an indication of the variation of the PRE across the binding site (see below).
Figure 4.
NMR data for determination of PRE constraints. A. 1D NMR spectrum of O2N-[HoPhe]-Ala-OH (structure shown inset). *=impurities. B. Transverse relaxation rates plotted as a function of equimolar concentrations of Fe(env5.0)3 and C29-e5.0 (the latter indicated on the x-axis). Diamagnetic rates obtained with unlabeled C29-e5.0 are shown with open circles and dashed lines; paramagnetic rates obtained with MTSL-labeled C29-e5.0 are shown with closed circles and solid lines. Experiments were conducted in 4% DMSO.
Figure 6.
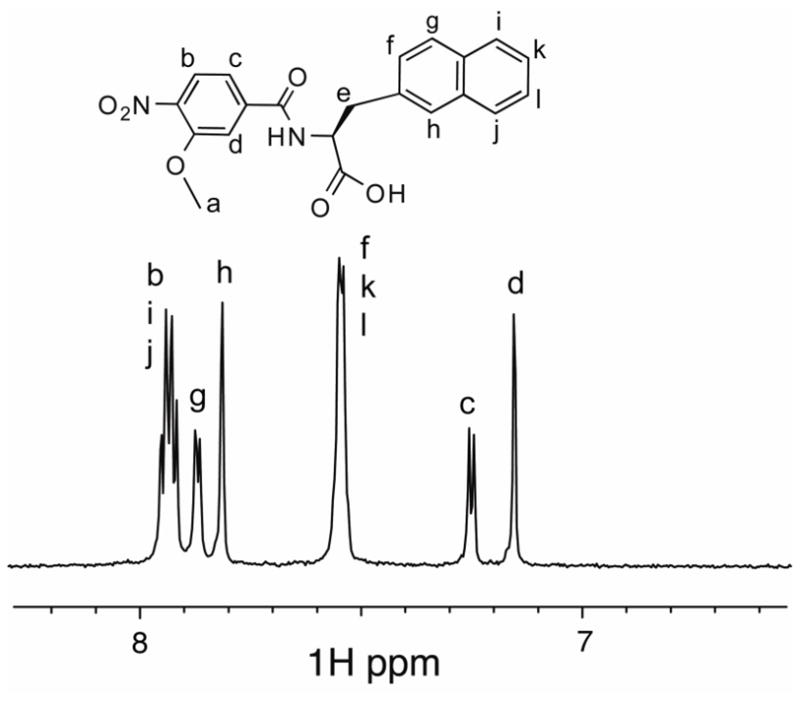
1D NMR spectrum of O2N-[Ala]-Nap-OH (structure shown inset). Experiments were conducted in 10% DMSO.
Figure 7.
Experimental PRE and corresponding distance ranges calculated at 12ns τc for O2N-[HoPhe]-Ala-OH (A, B) and O2N-[Ala]-Nap-COOH (C, D). In A and C, horizontal bars represent the PRE values obtained assuming maximum or minimum values for fb and fb′, and the error bars indicate the sum of the errors in line fitting of diamagnetic and paramagnetic data (see Figure 4).
The lowest energy computationally docked structure of O2N-[HoPhe]-Ala-OH in 2r5d was confirmed by PRE-constrained minimization
The 9 complexes obtained using AutoDock-Vina on each of 4 receptor structures (i.e. Figure 2, Figure S3-S5) were minimized to obtain low XPLOR energies. Relaxing the docked structures in this way typically resulted in sub-Å changes in ligand position, although for a few poses larger shifts were required to minimize intermolecular conflicts. The positional change of each ligand from the original docked pose is given in Table 4. The PRE were introduced as distance constraints using the NOE square well function. 3000 minimization steps were performed, permitting movement of MTSL and protein side chains, to determine if any of the computational poses fit the data directly.
Table 4.
Comparison of AutoDock-Vina poses of O2N-[HoPhe]-Ala-COOH obtained by XPLOR-NIH minimization with PRE-derived distance constraints *
| 2R5D | Ligand fixeda | Ligand allowed to moveb | ||||||
|---|---|---|---|---|---|---|---|---|
|
| ||||||||
| pose | RMSD PRE / s−1 | PRE Q factor† | RMSD Dist. / Å c | Ligand positional RMSD d | RMSD PRE / s−1 | PRE Q factor† | RMSD Dist. / Å c | Ligand positional RMSD d |
|
| ||||||||
| 1 | 11.78 | 0.27 | 1.174 | 0.379 | 2.63 | 0.058 | 0.139 | 1.01 |
|
|
||||||||
| 2 | 11.91 | 0.26 | 1.414 | 0.424 | 3.44 | 0.077 | 0.151 | 1.764 |
| 3 | 27.23 | 0.61 | 4.431 | 0.506 | 16.51 | 0.37 | 2.198 | 3.899 |
| 4 | 23.16 | 0.52 | 3.558 | 0.956 | 12.65 | 0.28 | 1.428 | 2.31 |
| 5 | 21.44 | 0.48 | 3.259 | 1.434 | 17.38 | 0.39 | 2.545 | 1.315 |
|
|
||||||||
| 6 | 12.36 | 0.28 | 0.843 | 0.408 | 3.31 | 0.043 | 0.102 | 1.798 |
|
|
||||||||
| 7 | 16.11 | 0.36 | 1.535 | 1.181 | 1.93 | 0.020 | 0.036 | 2.351 |
| 8 | 24.75 | 0.56 | 3.924 | 0.745 | 22.32 | 0.50 | 2.969 | 2.491 |
|
|
||||||||
| 9 | 19.06 | 0.42 | 3.06 | 0.837 | 1.73 | 0.035 | 0.073 | 1.923 |
|
| ||||||||
| 3P7K | Fixeda | Movedb | ||||||
|
| ||||||||
| 1 | 20.57 | 0.46 | 2.714 | 0.301 | 3.47 | 0.056 | 0.139 | 1.657 |
|
|
||||||||
| 2 | 10.41 | 0.23 | 1.209 | 0.565 | 3.07 | 0.068 | 0.181 | 1.855 |
| 3 | 17.98 | 0.41 | 2.235 | 1.435 | 11.91 | 0.27 | 1.706 | 1.415 |
|
|
||||||||
| 4 | 10.53 | 0.24 | 0.817 | 0.49 | 4.49 | 0.042 | 0.116 | 0.946 |
| 5 | 21.26 | 0.48 | 2.324 | 1.278 | 13.80 | 0.31 | 1.253 | 2.737 |
| 6 | 28.84 | 0.65 | 4.515 | 1.718 | 26.91 | 0.61 | 4.301 | 1.71 |
| 7 | 16.75 | 0.38 | 2.266 | 0.628 | 16.47 | 0.37 | 2.117 | 0.84 |
| 8 | 25.49 | 0.57 | 3.77 | 2.033 | 12.81 | 0.29 | 1.282 | 2.702 |
| 9 | 20.96 | 0.47 | 2.914 | 0.699 | 18.74 | 0.42 | 2.418 | 0.626 |
Experimental error range included in calculation of RMSD and Q factors; low values are shaded in gray; PRE Q factor measures the agreement between observed and calculated PRE according to the equation [Σi = [PREobs(i)- PREcalc(i)]2/[Σ iPREobs(i)2]½.
XPLOR-optimized ligand position fixed during PRE-derived distance - constrained minimization, protein side chains and MTSL allowed to move;
Ligand allowed to move during PRE-derived distance - constrained minimization, weak harmonic constraints (scaling factor 0.2 – 0.8) applied to protein side chains, MTSL side chain unconstrained;
PRE-derived distances calculated at τc=12ns;
Compared to original docked structure, all heavy atom RMSD, in Å
None of the 36 structures agreed a priori with all 8 PRE constraints, with a minimum of two distance violations larger than 1Å. The data are shown on the left-hand side of Table 4, which provides the root mean square deviations in PRE and PRE-derived distances, and the PRE Q factors[45] for simulations in which the ligand was held fixed, and the protein side chains were allowed to move.
The structures were then subjected to restrained minimization with PRE-derived distance constraints while allowing ligand movement, to determine whether small adjustments of ligand position could accommodate the observed PRE. In order to validate the predictive ability of a particular receptor and docking protocol, weak harmonic constraints (0.2 – 0.8) were applied to protein side chains during the simulations and a tolerance of up to ~1Å in ligand positional shift was accepted as corroboration of the docked pose. The MTSL group was allowed to move during restrained minimization while keeping the protein backbone fixed. The right hand side of Table 4 shows the results of the XPLOR simulations in two of the receptors 2r5d and 3p7k.
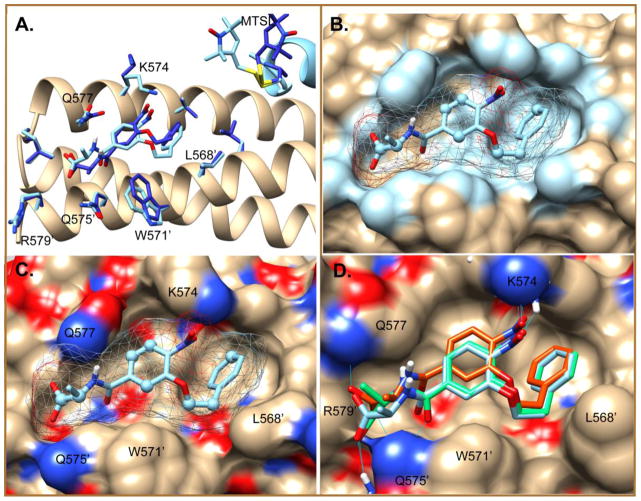
There were two structures that fit the data with minimal adjustment of ligand position (positional RMSD ~1Å or lower). They were the top ranked pose in 2r5d (pose #1) and the fourth ranked pose in 3p7k. Their statistics are given in Table 4, and the data fitting and structures are illustrated in Figures 8, 9 and 10. Pose #1 in 2r5d conformed after minimal positional adjustment (1.01Å) to the PRE-derived distance data, with minimal distortion of the MTSL labeled cysteine side chain (0.09Å displacement of the cysteine thiol). 2r5d pose #1 also agreed with the final minimized pose #1 in 3p7k (Figure 8D, Table 4), with a ligand positional RMSD of 1.267 between the two structures. Pose #1 in 3p7k is therefore included in Figures 8D, 9 and 10, despite a relatively large positional shift (1.657Å) compared to the starting structure. Good agreement between calculated and experimental PRE’s were observed for 2r5d pose #1 and 3p7k pose #1, with PRE Q factors of 0.06 and 0.08. Therefore both of these receptors represented an adequate model for docking the ligand, although 2r5d had a slightly closer starting pose. All other structures which fit the PRE data had a ligand positional RMSD change > 1.7Å and demonstrated a marked change in bound conformation compared to the original docked pose.
Figure 8.
Final low energy PRE-minimized docked poses of O2N-[HoPhe]-Ala-OH. A. The top ranked pose #1 in 2r5d before (dark blue) and after (light blue) minimization to agree with PRE constraints. B and C. Surface representation of 2r5d showing ligand contacts < 4Å highlighted in blue (B) and potential polar interactions with the ligand (C). Ligand carbons defined by a distance constraint on their attached protons are shown as spheres. D. Overlay of pose #1 of 2r5d (light blue) with pose #1X of 2r5d (green) and pose #1 of 3p7k (orange) after PRE-restrained minimization of ligand positions.
Figure 9.
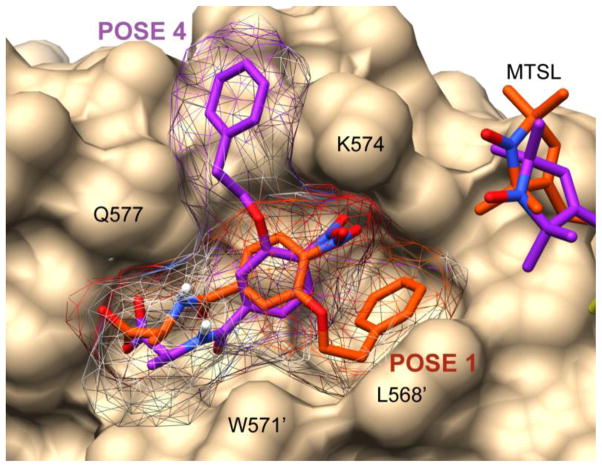
Comparison of poses 1 (orange) and 4 (purple) after PRE-restrained minimization in receptor 3p7k. Corresponding positions of the MTSL group are shown.
Figure 10.
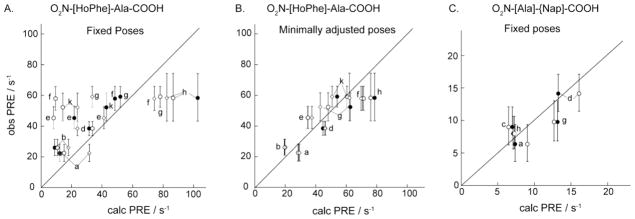
A. Observed vs. calculated PRE for final poses. O2N-[HoPhe]-Ala-COOH poses were A. fixed or B. allowed to move during XPLOR minimization with PRE constraints, with results shown for three poses that fit the experimental data with minimal positional shifts, i.e. 2r5d pose #1 (●), 3p7k pose #1 (○), 3p7k pose 4 (◇) (see Table 4); C. O2N-[Ala]-Nap-COOH, 2r5b pose 9, fixed in the original docked pose (●) or fixed in the XPLOR-minimized docked pose (○) (see Table 5). In each panel, a diagonal line is drawn through y=x.
One additional pose has been included in Figure 8D. This is a pose in 2r5d in which the benzamide dihedral angle was weakly constrained at 30° (force constant 10 kcal.mol−1rad−2) to explore the possibility that the preferred dihedral angle found in benzamides occurs in the bound ligand.[50] This structure (pose #1X) fit the data slightly better (PRE Q factor = 0.045) and had an RMSD of 1.203Å from pose #1 in 2r5d. Therefore the possibly energetically more favorable conformation could be accommodated in this orientation, but our data does not provide enough discrimination to confirm this conformation, giving an idea of the limits of resolution of this method. No restraints on the nitro-aromatic dihedral angle were included in the calculations, and we have observed a tendency for XPLOR-NIH to favor conformations of the nitro group in which an electrostatic interaction with the nearby lysine-574 can prevail (Figure 8A).
In the minimized pose #1, the carboxylate group of the ligand pointed towards the C-terminus of the pocket, and the phenyl ring made strong contacts at the hydrophobic N-terminal end of the pocket, pointing down into the pocket. Putative hydrogen bonds could occur between the ligand carboxylate group and Gln575′ or Gln577. In pose #1X the amide carbonyl could make a hydrogen bond with Gln 575′. The NO2 group was also within hydrogen bonding range of Lys574 εNH, provided the lysine side chain was rotated around into the pocket. Experimentally this hydrogen bond was not indicated. In both starting and refined structures, the methyl group of the Ala subunit pointed away from the surface and the alkoxy-aryl group was buried in the pocket.
A second pose detected in 3p7k is a mirror image of Pose #1
Figure 9 shows the fourth ranked pose in 3p7k, which also agreed with the PRE data. Interestingly, this pose is a mirror image of pose #1 and is permitted because there is no angular component to the PRE data. Flipping the alkoxy-aryl subunit and HoPhe side chain, when accompanied by a similar flip in MTSL, resulted in a structure with equivalent distances. This structure was found by AutoDock-Vina due to a channel along the edge of the pocket alongside the hydrophobic lysine side chain. Although this structure cannot be ruled out, it seems more likely that the hydrophobic phenylalanine ring would be buried into the pocket. Autodock-Vina docking is performed without solvent.
A unique docked pose of O2N-[Ala]-Nap-COOH in 2r5b agreed a priori with the PRE data
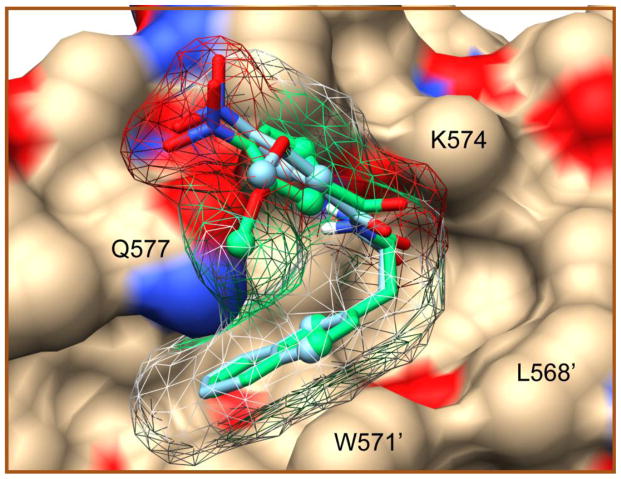
36 computationally docked structures (9 poses in each of the four receptors) were tested against the 5 PRE constraints obtained for O2N-[Ala]-Nap-COOH, using fixed ligand positions, yielding a single structure, pose 9 in 2r5b, with excellent agreement to the data (Table 5, Figure 11). This discrimination was possible despite very few constraints, possibly because they sampled the positions of both substituents and the aryl group on the scaffold. XPLOR energy minimization prior to application of PRE-constraints led to a pose 9 positional shift of 0.957Å and a slightly improved fit to the PRE data. MTSL was represented by a three conformer model in these simulations, and a 1.1Å average positional shift of the cysteine thiol was incurred during the data fitting. A key feature of the structure was the naphthalene ring intercalated deeply into the pocket. Interestingly, this pose was not found in 2r5d, despite its very similar structure. The differences between these two structures are at the C-terminal residues Q575′, Q575 and R579′, and they are sufficient to result in different sampled binding poses.
Table 5.
Comparison of AutoDock-Vina poses of O2N-[Ala]-Nap-COOH obtained by XPLOR-NIH minimization with PRE-derived distance constraints *
| pose | RMSD PRE / s−1 | PRE Q factor | RMSD Dist. / Å | Ligand positional RMSD cf. original docked structure d | ||||
|---|---|---|---|---|---|---|---|---|
| 2R5B | a Docked | b Minimized | a Docked | b Minimized | a Docked | b Minimized | a Docked | b Minimized |
|
| ||||||||
| 1 | 5.94 | 6.12 | 0.39 | 0.42 | 2.446 | 2.727 | 0 | 1.257 |
| 2 | 6.56 | 7.53 | 0.45 | 0.51 | 2.795 | 3.946 | 0 | 1.714 |
| 3 | 5.13 | 5.02 | 0.35 | 0.34 | 2.901 | 2.824 | 0 | 0.864 |
| 4 | 5.35 | 4.28 | 0.36 | 0.29 | 2.472 | 1.573 | 0 | 1.026 |
| 5 | 7.13 | 13.98 | 0.47 | 0.95 | 3.425 | 3.693 | 0 | 2.004 |
| 6 | 6.51 | 6.59 | 0.44 | 0.45 | 3.336 | 3.408 | 0 | 0.702 |
| 7 | 4.10 | 4.19 | 0.27 | 0.28 | 1.129 | 1.219 | 0 | 0.765 |
| 8 | 3.81 | 13.77 | 0.26 | 0.94 | 1.057 | 2.012 | 0 | 1.415 |
| 9 | 1.90 | 0.81 | 0.004 | 0 | 0.007 | 0 | 0 | 0.957 |
Experimental error range included in calculation of RMSD and Q factors, low values are shaded in gray;
Vina-docked ligand pose fixed, protein side chains and MTSL allowed to move during PRE-derived distance constrained minimization;
XPLOR-optimized ligand position fixed during minimization with PRE-derived distance constraints, protein side chains and MTSL side chain allowed to move;
calculated at τc=12ns;
All heavy atom RMSD, in Å
Figure 11.
O2N-[Ala]-Nap-COOH docked into the hydrophobic pocket of 2r5b, and confirmed by experimental PRE data. Original Vina docked poses and poses obtained by energy minimization without PRE constraints are shown in green and blue respectively. Ligand carbons defined by an experimental constraint on their attached protons are shown as spheres. Interacting side chains of the protein are labeled.
The effect of possible errors in protein concentration leading to the low observed PRE of O2N-[Ala]-Nap-COOH was analyzed by repeating calculations assuming half the protein concentration, which would more than double the PRE values, and is a possibility if the 10% DMSO used in this sample had an adverse effect on the protein. Assays have revealed no change in affinity of hydrophobic pocket binding up to 16% DMSO,[19] suggesting that the integrity of the pocket structure is maintained. The same pose 9 was found to fit the data obtained at half protein concentration simply by a 2Å movement of the MTSL group or by altering the τc used in the calculation. This insensitivity of the calculation to exact protein concentration, exact KD and precise knowledge of the correlation time is a result of the interplay between these factors (Figure S7). τc and fb can be varied over a wide range to give the same distance. Therefore it is possible to fit the data equivalently with different values of τc and fb. Variation in either τc or fb alone causes concerted distance shifts for all protons which can be accommodated by small adjustments of the flexible MTSL. Furthermore, fb scales linearly with protein concentration over the error range of the measurement, due to the low amount of receptor compared to ligand, allowing adjustments in protein concentration to be similarly accommodated. RMSD’s obtained between observed and calculated distances for O2N-[Ala]-Nap-COOH suggested a better fit to the data at full protein concentration (Figure S7).
Validated structures enabled limited prediction of the poses of higher affinity peptidomimetic inhibitors
The results obtained for O2N-[HoPhe]-Ala-OH and O2N-[Ala]-Nap-OH could not easily be extrapolated to the entire library, due to the observed strong dependence of even small changes in side chain positions on Vina-docked poses. However, having validated 2r5d and 3p7k for O2N-[HoPhe]-Ala-OH and the related structure 2r5b for O2N-[Ala]-Nap-OH, we could examine subsets of the 400-member peptidomimetic library with these receptors for agreement with observed SAR. We studied the subset O2N-[HoPhe]-X-OH, where X is Phe, Phe4Cl, Nap, Trp or HoPhe. All of these compounds had much greater affinity for the pocket than O2N-[HoPhe]-Ala-OH (Figure 1), and correspondingly higher fusion inhibitory activity (Table 1). Consensus poses indicated that 2r5d and 3p7k could accommodate both aromatic side chains within the pocket, overlapping well with validated pose #1 of O2N-[HoPhe]-Ala-OH, and providing an explanation for the enhanced activity (see Supplementary Data Figure S8). However, there are various scaffold orientations that would permit this intercalation of aromatic subunits, limiting our ability to predict an exact structure. No dual aromatic compounds adopted the same conformation as O2N-[Ala]-Nap-OH, most likely because of steric clashes if alanine is replaced with a bulky aromatic side chain at that location.
Conclusions
In this study, we have evaluated a library of small peptidomimetic compounds designed to emulate a helix with side chains at i and i+4 positions for binding in the hydrophobic pocket of gp41. Binding was strongly correlated to the presence of aromatic side chains at both positions, and also correlated to activity in a cell-cell fusion assay. An NMR study using PRE constraints in docking simulations enabled experimental verification of the orientation of two mid-μM binding peptidomimetic compounds, O2N-[HoPhe]-Ala-OH and O2N-[Ala]-Nap-OH. These compounds have 6 and 5 rotatable bonds, respectively, and were defined by 8 and 5 PRE’s. Despite the low number of constraints, a unique binding pose could be obtained in conjunction with Autodock-Vina simulations. The calculations were relatively insensitive to selected correlation time as well as exact KD and fraction bound, due to the flexibility of the MTSL group, which could accommodate these errors in the system. Out of four receptors tested, 2r5d and 2r5b gave a predicted pose that most closely matched the experimental data for O2N-[HoPhe]-Ala-OH and O2N-[Ala]-Nap-OH respectively. We observed that slight changes in side chain orientations in 2r5d precluded the observation of the pose of O2N-[Ala]-Nap-OH that in the similar receptor 2r5b turned out to be the best fit to the experimental data. The converse was true for O2N-[HoPhe]-Ala-OH. Thus docking predictions cannot with certainty provide an accurate pose unless the receptor structure is definitively known, a requirement that is complicated by ligand-induced fits. Provision of even just a few experimental constraints significantly improved the value of the docking predictions. The technique used here is easily extended to the study of protein – protein interactions in general, since a peptide that binds adjacent to a known hotspot in a receptor can typically be designed from a short segment of the protein binding partner. The method involves straightforward data collection, but complex data fitting. It is limited to the examination of poses that are obtained by computation, and it may be necessary to examine many receptor structures to find a solution. Poses that might agree with experiment but are not found in docking calculations are neglected, pointing to an important need for accuracy in docking algorithms. Compound modifications based on the verified poses and additional NMR experiments focusing on high affinity complexes may help in optimization of this compound class.
Supplementary Material
Table 2.
PRE data for O2N-[HoPhe]-Ala-COOH bound to the gp41 hydrophobic pocket
| Proton | R2bpara / s−1 § |
|---|---|
| a | 17.08 – 28.24 |
| b | 20.88 – 31.43 |
| d | 33.89 – 43.08 |
| e | 38.37 = 52.75 |
| f | 50–17 – 65.85 |
| g | 52.39 – 65.93 |
| h | 43.35 – 74.37 |
| k | 43.37 – 61.53 |
experimental PRE range was calculated from the uncertainty in measured KD and the errors in the best fit lines to paramagnetic and diamagnetic data.
Table 3.
PRE data for O2N-[Ala]-Nap-COOH bound to the gp41 hydrophobic pocket
| Proton | R2bpara / s−1 § |
|---|---|
| a | 3.70 – 9.37 |
| c | 6.25 – 12.08 |
| d | 11.40 – 17.10 |
| g | 6.86 – 13.06 |
| h | 5.63 – 10.62 |
experimental PRE range was calculated from the uncertainty in measured KD and the errors in the best fit lines to paramagnetic and diamagnetic data.
Acknowledgments
We gratefully acknowledge the financial support of the National Institutes of Health (NS059403, GM087998, MG), (CA078045, DLB). We thank E. Balogh and D. Wu for technical assistance in the collection of data for Figure 1 and Table 1. Molecular graphics images were produced using the UCSF Chimera package from the Resource for Biocomputing, Visualization, and Informatics at the University of California, San Francisco (supported by NIH P41 RR-01081). The authors also gratefully acknowledge use of the UC Berkeley Biomolecular NMR facility. The authors thank Dr. Eric Springman at Locus Pharmaceuticals (Ansaris) for providing the coordinates of 3p7k prior to publication.
References
- 1.Ou HD, May AP, O’Shea CC. Wiley Interdiscip Rev Syst Biol Med. 2011;3:48. doi: 10.1002/wsbm.88. [DOI] [PMC free article] [PubMed] [Google Scholar]
- 2.Liu S, Wu S, Jiang S. Curr Pharm Des. 2007;13:143. doi: 10.2174/138161207779313722. [DOI] [PubMed] [Google Scholar]
- 3.Welch BD, VanDemark AP, Heroux A, Hill CP, Kay MS. Proc Natl Acad Sci U S A. 2007;104:16828. doi: 10.1073/pnas.0708109104. [DOI] [PMC free article] [PubMed] [Google Scholar]
- 4.Welch BD, Francis JN, Redman JS, Paul S, Weinstock MT, Reeves JD, Lie YS, Whitby FG, Eckert DM, Hill CP, Root MJ, Kay MS. J Virol. 2010;84:11235. doi: 10.1128/JVI.01339-10. [DOI] [PMC free article] [PubMed] [Google Scholar]
- 5.Eckert DM, Malashkevich VN, Hong LH, Carr PA, Kim PS. Cell. 1999;99:103. doi: 10.1016/s0092-8674(00)80066-5. [DOI] [PubMed] [Google Scholar]
- 6.Naider F, Anglister J. Curr Opin Struct Biol. 2009;19:473. doi: 10.1016/j.sbi.2009.07.003. [DOI] [PMC free article] [PubMed] [Google Scholar]
- 7.Allen KA, Rizzo M, Sadosty AT. Journal of Emergency Medicine. 2012;43:93. doi: 10.1016/j.jemermed.2011.07.032. [DOI] [PubMed] [Google Scholar]
- 8.Jiang S, Lu H, Liu S, Zhao Q, He Y, Debnath AK. Antimicrob Agents and Chemother. 2004;48:4349. doi: 10.1128/AAC.48.11.4349-4359.2004. [DOI] [PMC free article] [PubMed] [Google Scholar]
- 9.Liu K, Lu H, Hou L, Qi Z, Teixeira C, Barbault F, Fan BT, Liu S, Jiang S, Xie L. J Med Chem. 2008;51:7843. doi: 10.1021/jm800869t. [DOI] [PMC free article] [PubMed] [Google Scholar]
- 10.Teixeira C, Barbault F, Rebehmed J, Liu K, Xie L, Lu H, Jiang S, Fan B, Maurel F. Bioorganic and Medicinal Chemistry. 2008;16:3039. doi: 10.1016/j.bmc.2007.12.034. [DOI] [PubMed] [Google Scholar]
- 11.Katritzky AR, Tala SR, Lu H, Vakulenko AV, Chen QY, Sivapackiam J, Pandya K, Jiang S, Debnath AK. J Med Chem. 2009;52:7631. doi: 10.1021/jm900450n. [DOI] [PMC free article] [PubMed] [Google Scholar]
- 12.Jiang S, Debnath AK. Biochem Biophys Res Commun. 2000;270:153. doi: 10.1006/bbrc.2000.2411. [DOI] [PubMed] [Google Scholar]
- 13.He Y, Liu S, Jing W, Lu H, Cai D, Chin DJ, Debnath AK, Kirchhoff F, Jiang S. J Biol Chem. 2007;282:25631. doi: 10.1074/jbc.M703781200. [DOI] [PubMed] [Google Scholar]
- 14.Jahnke W, Rudisser S, Zurini M. J Am Chem Soc. 2001;123:3149. doi: 10.1021/ja005836g. [DOI] [PubMed] [Google Scholar]
- 15.Balogh E, Wu D, Zhou G, Gochin M. J Am Chem Soc. 2009;131:2821. doi: 10.1021/ja8094558. [DOI] [PMC free article] [PubMed] [Google Scholar]
- 16.Gochin M, Zhou G, Phillips AH. ACS Chem Biol. 2010;6:267. doi: 10.1021/cb100368d. [DOI] [PMC free article] [PubMed] [Google Scholar]
- 17.Gochin M, Guy RK, Case MA. Angew Chem Int Ed. 2003;42:5325. doi: 10.1002/anie.200352006. [DOI] [PubMed] [Google Scholar]
- 18.Gochin M, Savage R, Hinckley S, Cai L. Biol Chem. 2006;387:477. doi: 10.1515/BC.2006.063. [DOI] [PMC free article] [PubMed] [Google Scholar]
- 19.Cai L, Gochin M. Antimicrob Agents Chemother. 2007;51:2388. doi: 10.1128/AAC.00150-07. [DOI] [PMC free article] [PubMed] [Google Scholar]
- 20.Gochin M, Cai L. J Med Chem. 2009;52:4338. doi: 10.1021/jm900190q. [DOI] [PMC free article] [PubMed] [Google Scholar]
- 21.Cai L, Balogh E, Gochin M. Antimicrob Agents Chemother. 2009;53:2444. doi: 10.1128/AAC.00150-09. [DOI] [PMC free article] [PubMed] [Google Scholar]
- 22.Gochin M. Assay Drug Dev Technol. 2012;10:407. doi: 10.1089/adt.2012.464. [DOI] [PMC free article] [PubMed] [Google Scholar]
- 23.Shaginian A, Whitby LR, Hong S, Hwang I, Farooqi B, Searcey M, Chen J, Vogt PK, Boger DL. J Am Chem Soc. 2009;131:5564. doi: 10.1021/ja810025g. [DOI] [PMC free article] [PubMed] [Google Scholar]
- 24.Whitby LR, Boyle KE, Cai L, Yu X, Gochin M, Boger DL. Bioorganic and Medicinal Chemistry Letters. 2012;22:2861. doi: 10.1016/j.bmcl.2012.02.062. [DOI] [PMC free article] [PubMed] [Google Scholar]
- 25.Cheng S, Tarby CM, Comer DD, Williams JP, Caporale LH, Myers PL, Boger DL. Bioorganic and Medicinal Chemistry. 1996;4:727. doi: 10.1016/0968-0896(96)00069-7. [DOI] [PubMed] [Google Scholar]
- 26.Boger DL, Tarby CM, Myers PL, Caporale LH. J Am Chem Soc. 1996;118:2109. [Google Scholar]
- 27.Cheng S, Comer DD, Williams JP, Myers PL, Boger DL. J Am Chem Soc. 1996;118:2567. [Google Scholar]
- 28.Boger DL, Desharnais J, Capps K. Angewandte Chemie International Ed In English. 2003;42:4138. doi: 10.1002/anie.200300574. [DOI] [PubMed] [Google Scholar]
- 29.Wexler-Cohen Y, Shai Y. Faseb J. 2007;21:3677. doi: 10.1096/fj.07-8582com. [DOI] [PubMed] [Google Scholar]
- 30.Platt EJ, Wehrly K, Kuhmann SE, Chesebro B, Kabat D. J Virol. 1998;72:2855. doi: 10.1128/jvi.72.4.2855-2864.1998. [DOI] [PMC free article] [PubMed] [Google Scholar]
- 31.Wei X, Decker JM, Liu H, Zhang Z, Arani RB, Kilby JM, Saag MS, Wu X, Shaw GM, Kappes JC. Antimicrob Agents Chemother. 2002;46:1896. doi: 10.1128/AAC.46.6.1896-1905.2002. [DOI] [PMC free article] [PubMed] [Google Scholar]
- 32.Ciminale V, Felber BK, Campbell M, Pavlakis GN. AIDS Res Hum Retroviruses. 1990;6:1281. doi: 10.1089/aid.1990.6.1281. [DOI] [PubMed] [Google Scholar]
- 33.Meiboom S, Gill D. Review of Scientific Instruments. 1958;29:688. [Google Scholar]
- 34.Carr HY, Purcell EM. Physical Review. 1954;94630:LP. [Google Scholar]
- 35.Hoult D. Journal of Magnetic Resonance. 1976;21:337. [Google Scholar]
- 36.Tosner Z, Skoch A, Kowalewski J. Chemphyschem. 2010;11:638. doi: 10.1002/cphc.200900699. [DOI] [PubMed] [Google Scholar]
- 37.Mulder FA, Skrynnikov NR, Hon B, Dahlquist FW, Kay LE. J Am Chem Soc. 2001;123:967. doi: 10.1021/ja003447g. [DOI] [PubMed] [Google Scholar]
- 38.Aue W, Bartholdi E, Ernst R. The Journal of Chemical Physics. 1976;64 [Google Scholar]
- 39.Solomon I, Bloembergen N. J Chem Phys. 1956;25:261. [Google Scholar]
- 40.Trott O, Olson AJ. J Comput Chem. 2010;31:455. doi: 10.1002/jcc.21334. [DOI] [PMC free article] [PubMed] [Google Scholar]
- 41.Caffrey M. Biochim et Biophys Acta. 2001;1536:116. doi: 10.1016/s0925-4439(01)00042-4. [DOI] [PubMed] [Google Scholar]
- 42.Stewart KD, Huth JR, Ng TI, McDaniel K, Hutchinson RN, Stoll VS, Mendoza RR, Matayoshi ED, Carrick R, Mo H, Severin J, Walter K, Richardson PL, Barrett LW, Meadows R, Anderson S, Kohlbrenner W, Maring C, Kempf DJ, Molla A, Olejniczak ET. Bioorg Med Chem Lett. 2010;20:612. doi: 10.1016/j.bmcl.2009.11.076. [DOI] [PubMed] [Google Scholar]
- 43.Kleywegt GJ, Henrick K, Dodson EJ, van Aalten DM. Structure. 2003;11:1051. doi: 10.1016/s0969-2126(03)00186-2. [DOI] [PubMed] [Google Scholar]
- 44.Schwieters CD, Kuszewski JJ, Tjandra N, Clore GM. J Magn Reson. 2003;160:65. doi: 10.1016/s1090-7807(02)00014-9. [DOI] [PubMed] [Google Scholar]
- 45.Iwahara J, Schwieters CD, Clore GM. J Am Chem Soc. 2004;126:5879. doi: 10.1021/ja031580d. [DOI] [PubMed] [Google Scholar]
- 46.Weissenhorn W, Dessen A, Harrison SC, Skehel JJ, Wiley DC. Nature. 1997;387:426. doi: 10.1038/387426a0. [DOI] [PubMed] [Google Scholar]
- 47.Chan DC, Fass D, Berger JM, Kim PS. Cell. 1997;89:263. doi: 10.1016/s0092-8674(00)80205-6. [DOI] [PubMed] [Google Scholar]
- 48.Caffrey M, Cai M, Kaufman J, Stahl SJ, Wingfield PT, Covell DG, Gronenborn AM, Clore GM. Embo Journal. 1998;17:4572. doi: 10.1093/emboj/17.16.4572. [DOI] [PMC free article] [PubMed] [Google Scholar]
- 49.Springman EB. personal communication.
- 50.Penfold BR, White JCB. Acta Cryst. 1959;12:130. [Google Scholar]
Associated Data
This section collects any data citations, data availability statements, or supplementary materials included in this article.


