

Abstract
Posttraumatic stress disorder (PTSD) and mild traumatic brain injury (mTBI) in military personnel is increasing dramatically following the OEF/OIF conflicts and is associated with alterations to brain structure. The present study examined the relationship between PTSD and cortical thickness, and its possible modification by mTBI, in a 104-subject OEF/OIF veteran cohort ranging in age from 20 to 62 years. For each participant, two T1-weighted scans were averaged to create high-resolution images for calculation of regional cortical thickness. PTSD symptoms were assessed using the Clinician Administered PTSD Scale (CAPS) and scores were derived based on the previous month's symptoms (“current”) and a Cumulative Lifetime Burden of PTSD (CLB-P) reflecting the integral of CAPS scores across the lifetime. Mild TBI was diagnosed using the Boston Assessment of TBI-Lifetime (BAT-L). Results demonstrated a clear negative relationship between current PTSD severity and thickness in both postcentral gyri and middle temporal gyri. This relationship was stronger and more extensive when considering lifetime burden (CLB-P), demonstrating the importance of looking at trauma in the context of an individual's lifetime, rather than only at their current symptoms. Finally, interactions with current PTSD only and comorbid current PTSD and mTBI were found in several regions, implying an additive effect of lifetime PTSD and mTBI on cortical thickness.
Keywords: Posttraumatic stress disorder, Mild traumatic brain injury, Cortical thickness, Whole-brain analysis, Neuroimaging, Comorbidity
1. Introduction
Some veterans of Operations Enduring and Iraqi Freedom (OEF/OIF) return from deployment with severe and debilitating conditions attributed to physical and psychological traumas experienced in theater, specifically posttraumatic stress disorder (PTSD) and mild traumatic brain injury (mTBI). PTSD refers to the clinical constellation of symptoms that fall into three clusters: re-experiencing, avoidance, and hyperarousal (Malloy et al., 1983). Symptoms can vary widely, be difficult to treat, and be functionally debilitating (Buckley et al., 2000; Rubin et al., 2008; Vasterling and Verfaellie, 2009). More than 20% of returning OEF/OIF military personnel present with PTSD (Hoge et al., 2004), much higher than the 6% reported in the civilian population (Kessler et al., 2005), and this prevalence is increasing (Atkinson et al., 2009).
The core clinical characteristics of PTSD (i.e., re-experiencing, avoidance, and hyperarousal Malloy et al., 1983), as well as early evidence of the abnormal metabolism of stress hormones (Mason et al., 1986), seem to implicate an underlying disorder of the central nervous system. Early findings of hippocampal volume reductions in patients with combat-related PTSD (Bremner et al., 1995) led to many studies that sought to determine the role of this structure in the development of the symptomatology of PTSD. Additionally, other studies have reported volumetric alterations in amygdala (Karl et al., 2006), anterior cingulate (Woodward et al., 2006; Yamasue et al., 2003) and cerebellum (De Bellis and Kuchibhatla, 2006). Findings pertaining to PTSD-associated structural changes are discrepant, however, with several studies reporting negative findings (Fennema-Notestine et al., 2002; Woodward et al., 2006; Yehuda et al., 2007).
To date, no studies have examined the cumulative effect that PTSD may have on cortical thickness. Thus, the primary goals of the present study were to first examine the effect of a current PTSD diagnosis, and then the effect of a lifetime burden of PTSD on cortical thickness in a large group of OEF/OIF veterans. A previous study found correlations with gray matter reduction and lifetime trauma load using a trauma questionnaire to measure lifetime load (Nardo et al., 2010), and another found reduced volume of cortical and subcortical structures with higher current PTSD symptoms as well as a higher childhood trauma load (Herringa et al., 2012). We aimed to examine the impact of both current PTSD symptoms (i.e., prior month), and a measure of lifetime PTSD symptoms we refer to as Cumulative Lifetime Burden of PTSD (CLB-P) in an attempt to capture the effect of cumulative burden on brain structure.
The secondary goal was to examine how comorbid mTBI would impact the observed relationships between stress symptoms and brain structure. Non-penetrating concussive mTBI is another common insult in OEF/OIF veterans, with estimates of 15–20% sustaining a probable mTBI during deployment (Belanger et al., 2009; Hoge et al., 2008; Vasterling et al., 2006). In addition, mTBI is known to contribute to PTSD, and many of their symptoms are overlapping (Ishibe et al., 2009). Therefore, it is possible that mTBI causes similar neural changes as traumatic stress, or that mTBI contributes to a neural environment in which the brain is more vulnerable to traumatic stress. The comorbidity of PTSD and mTBI is strikingly common in the OEF/OIF veteran population. A prior study found that 43.9% of OEF/OIF veterans who experienced an mTBI with loss-of-consciousness also met criteria for PTSD, compared to only 9.1% meeting criteria for PTSD with no mTBI (Hoge et al., 2008). Consequently, consideration of mTBI is important when examining the impact of PTSD on brain structure. Evidence of structural brain changes in individuals with mTBI is also inconsistent, with some studies failing to document significant changes (Johnson et al., 2012; Tate et al., 2012).
Given the inconsistent findings regarding the regional effects of both PTSD and mTBI, we adopted a robust whole-brain approach to our analysis. We predicted that individuals with a positive diagnosis of PTSD would show a reduction in cortical thickness when compared to a control group of veterans who were deployed and exposed to trauma, but did not develop PTSD nor did they incur an mTBI (deployed controls). We further predicted that this reduction would correlate with PTSD severity. Specifically, given prior findings of PTSD and brain structure, we predicted reductions in areas of the limbic system, including the anterior cingulate and temporal lobe. In addition, we hypothesized that our measure of Cumulative Lifetime Burden of PTSD, CLB-P, would show stronger negative associations with cortical thickness. Since few studies have examined the impact of the comorbidity of PTSD and mTBI on the brain, our predictions for these interactions were less clear. Given the known psychological effects of multiple mTBIs, we expected that the presence of mTBI would exacerbate any effects seen due to PTSD.
2. Materials and methods
2.1. Participants
One hundred and four service members enrolled in The Translational Research Center for TBI and Stress Related Disorders (TRACTS), a Veterans Administration (VA) Rehabilitation Research and Development (RR&D) supported TBI Center of Excellence (CoE) at VA Boston Healthcare System, were included in this study. Participants had been deployed on at least one OEF/OIF tour and were recruited from throughout the Boston Metropolitan area through outreach at Yellow Ribbon and other military-associated events. Individuals were excluded from participation in TRACTS if they had a history of serious illness outside of the study conditions including history of seizures, cerebrovascular accident, myocardial infarction, diabetes, current active suicidal and/or homicidal ideation, intent, or plan requiring crisis intervention, current DSM-IV diagnosis of bipolar disorder, schizophrenia, or any other psychotic disorder (except psychosis NOS due to trauma-related hallucinations), or cognitive disorder due to general medical condition other than TBI. For each participant, a wide range of information was collected on his or her health, daily lifestyle, and deployment history, which are shown in Table 1.
Table 1.
Demographics for all subjects and the two diagnosis groups, for both “full” and “lifetime” groups. Values provided are mean and standard error of the mean. CAPS = Clinician Administered PTSD Scale; OEF/OIF = Operation Enduring Freedom/Operation Iraqi Freedom; CLB-P = Cumulative Lifetime Burden of PTSD; LDH = Lifetime Drinking History.
| Age | Gender (M/F) | Current CAPS score | Years of education | Total length of OEF/OIF deployments (months) | CLB-P | LDH total⁎ | |
|---|---|---|---|---|---|---|---|
| All subjects (n = 104/n = 85) | 33.70 (0.94)/33.84 (1.00) | (90/14)/(73/12) | 49.90 (2.93)/51.08 (3.10) | 13.61 (0.17)/13.54 (0.18) | 13.18 (6.87)/12.42 (6.18) | (n/a)/952.57 (82.35) | 9.09 (0.99)/9.33 (1.16) |
| Control (n = 39/n = 30) | 35.49 (1.65)/35.43 (1.69) | (34/5)/(26/4) | 21.10 (2.31)/21.33 (2.80) | 13.95 (0.29)/14.00 (0.34) | 13.69 (7.17)/13.16 (6.43) | (n/a)/567.17 (87.54) | 8.02 (1.48)/7.79 (1.65) |
| PTSD (n = 65/n = 55) | 32.63 (1.11)/32.96 (1.24) | (56/9)/(47/8) | 68.38 (2.46)/67.31 (2.65) | 13.40 (0.21)/13.29 (0.20) | 12.87 (6.71)/12.01 (6.05) | (n/a)/1162.8 (108.34) | 9.77 (1.34)/10.23 (1.22) |
Values divided by 1000.
Out of our 104 participants, 85 had experienced a traumatic event and/or exhibited symptoms of trauma exposure prior to deployment, and so this subset of the sample was used in the CLB-P analyses (Fig. 1). PTSD symptoms and TBI exposure were assessed through the Clinician Administered PTSD Scale (CAPS) (Blake et al., 1995) and the Boston Assessment of TBI-Lifetime (BAT-L) (Fortier et al., 2012; Morra et al., 2011), respectively, and individuals were assigned to one of two groups based on these data as described in Table 1. We will adopt the conventions “full” and “lifetime” as referring to the full subject group of 104 participants and the subset of 85 participants for whom lifetime data was available, respectively.
Deployed Control Group (n = 39/full, n = 30/lifetime): These individuals were deployed on at least one OEF/OIF tour and exposed to trauma during combat, but did not meet criteria for current PTSD or for a deployment-related TBI.
PTSD Group (n = 65/full, n = 55/lifetime): These individuals were deployed on at least one OEF/OIF tour and met DSM-IV criteria for current PTSD. Twenty-nine of these individuals incurred a deployment-related TBI. The influence of deployment-related mTBI was examined in secondary subgroup analyses to determine whether comorbid mTBI influenced the association between stress symptoms and brain structure.
Fig. 1.
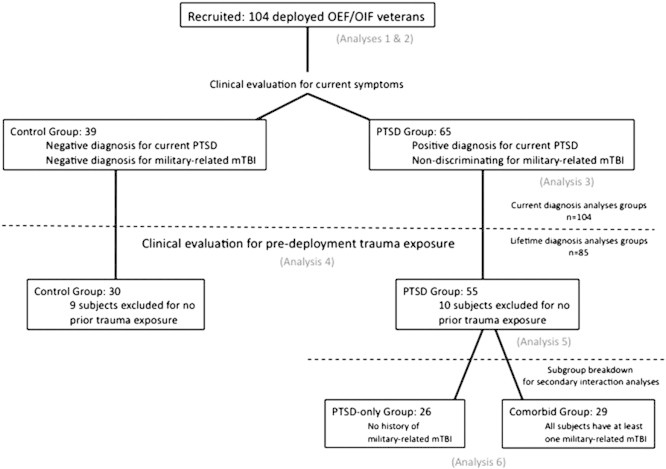
Group assignments and subject selection process for different stages of analyses.
2.2. Clinical assessment
2.2.1. PTSD
The presence and severity of PTSD were assessed using the CAPS. The CAPS is a semi-structured clinical interview used to evaluate the DSM-IV Criteria for PTSD. Participants are asked to identify if they were exposed to an event that was associated with either threat to life, a serious injury, or a threat to physical integrity (i.e., A1 Criteria) and if they reacted to the event with feelings of intense fear, helplessness, or horror (i.e., A2 Criteria). The CAPS also contains 17 questions that evaluate the frequency and intensity of re-experiencing (Criteria B), avoidance (Criteria C), and hyperarousal symptoms (Criteria D). Participants are queried about the frequency (on a scale of 0 (“never”) to 4 (“daily or almost every day”)) and intensity (0 (“none”) to 4 (“extreme, incapacitating distress, cannot dismiss memories, unable to continue activities”)) for each of the possible symptoms. A total score of PTSD symptom severity is also derived from the CAPS (min score = 0, max = 136). The reliability and validity of this assessment tool are well documented (Blake et al., 1995). Participants were diagnosed with PTSD if they met DSM-IV-TR criteria. Diagnoses were made using a standard scoring rule (rule of 3), such that for a given symptom to count toward diagnosis, the participant must score at least a 1 for frequency and a 2 for intensity. PTSD diagnosis was ultimately confirmed via consensus conference.
2.2.2. A Cumulative Lifetime Burden for PTSD
A CLB-P score was derived in an attempt to quantify the cumulative effects of PTSD across and individual's lifetime. We do not purport that this score necessarily reflects the biological severity of trauma, but it allows us to quantify the psychological burden across an individual's lifetime. This is strengthened by evidence that prior exposure to trauma is one of the highest risk factors for developing PTSD from a current traumatic event (Breslau, 2002; Breslau and Peterson, 2010; Brewin et al., 2000; Cougle et al., 2009). Three CAPS scores anchored to separate time periods were used to calculate the CLB-P. The first time point corresponded to the very first month prior to deployment that the participant endorsed exposure to a Criteria A1 event accompanied by a Criteria A2 reaction. As mentioned, 85 individuals in our sample met these criteria; these individuals comprised our “lifetime” subgroup. The second time point corresponded to the month post-deployment during which trauma symptoms were the worst. The third time point reflected symptom severity over the past month (i.e., current). Separate CAPS scores were calculated for each of these pre and post-deployment time periods, in addition to a current CAPS score. Age-score combinations were plotted linearly as three points in an x–y coordinate system; the CLB-P score was then calculated as the total area beneath the curve, taken as the addition of two definite integrals. Fig. 2 demonstrates how CLB-P was determined. Eq. (1) in Appendix A mathematically demonstrates how CLB-P is calculated. History of TBI was not accounted for in the CLB-P calculation. Additionally, the CLB-P is different from existing measures of lifetime PTSD such as the Traumatic Antecedents Questionnaire (TAQ) and the Trauma History Questionnaire (THQ) which have been implemented in other studies of brain structure and lifetime PTSD (Herringa et al., 2012; Nardo et al., 2010). The THQ is a self-administered measure and uses only 24 questions in assessing lifetime trauma (Green, 1996; Hooper et al., 2011), whereas the CLB-P administers the CAPS for three independent time points, for a total of 90 questions. The TAQ is weighted towards childhood traumas (Herman et al., 1989), which loses the specificity that the CLB-P captures by assessing combat-related traumas and the potential remittance or exacerbation of symptoms at the current time.
Fig. 2.
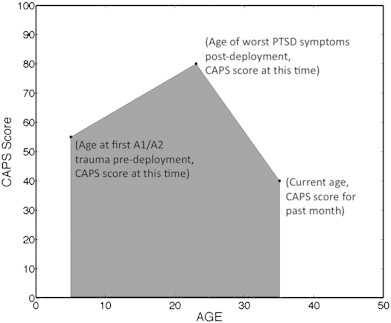
Visual representation of how Cumulative Lifetime Burden of PTSD (CLB-P) score is calculated. The score is determined as the area under the curve created by CAPS scores from pre-deployment, post-deployment, and current trauma symptoms, which are plotted against their respective ages. Age of first trauma and current age are used as boundaries for area (see Appendix A for formula).
2.2.3. mTBI
The BAT-L is an assessment of blast and blunt force TBI across the lifetime (Fortier et al., 2012). Criteria are evaluated through a structured clinical interview using open–ended questions of symptoms. Injuries are graded (mild stage I, II, III; moderate; severe) according to a hybrid classification system that takes loss of consciousness, altered mental state, and peri-traumatic amnesia into account. This measure is not based on independent medical documentation, but is self-report. Information on the number of TBIs, the nature by which they were incurred, and their severity was collected for pre-deployment, post-deployment, and current time periods. Note that these events do not necessarily correspond to the psychologically traumatic events collected during the CAPS interview. Ninety-six percent of participants with TBI had only mTBI. Only 4 TBIs were moderate and 1 severe in the sample, and all 5 of these TBIs of higher severity occurred pre-deployment. There was a good correspondence between the BAT-L assessment scores and the validated Ohio State TBI Assessment Method (Morra et al., 2011). TBI diagnosis was ultimately confirmed via consensus conference.
2.2.4. Lifetime Drinking History (LDH)
Alcohol consumption is a common comorbidity of PTSD which can affect brain structure (Fortier et al., 2011). We therefore examined the influence of alcohol consumption on measures of interest using the LDH scale (Skinner and Sheu, 1982). The LDH is a structured interview to quantify frequency, amount, and duration of alcohol consumption during various phases of an individual's life and aggregates this information to yield lifetime consumption measures.
2.3. MRI acquisition
Two whole-brain high-resolution T1-weighted MPRAGE (T1 = 1000 ms, TR = 2.53 s, TE = 3.32 ms, flip angle = 7°, slice thickness = 1.0 mm, 256 slices, FOV = 256 × 256 mm) images were acquired for each individual on a Siemens 3 T TIM Trio scanner with a 12-channel head coil at the VA Medical Center in Boston, Massachusetts. These two images were averaged for each participant to create a single image volume with high contrast-to-noise. Total imaging time was approximately six minutes for each MPRAGE scan.
2.4. Image analysis
MRI images were processed to create individualized models of each participant's cortical mantle through the cortical reconstruction procedure in the FreeSurfer image analysis suite, which is documented and freely available for download online (http://surfer.nmr.mgh.harvard.edu/). The technical details of these procedures are described in prior publications (Brands et al., 2006; Dale et al., 1999; Fischl and Dale, 2000; Fischl et al., 1999a, 2001, 2002, 2004a, 2004b). Briefly, this processing first involves motion correction and averaging of the two volumetric T1-weighted images, removal of non-brain tissue using a hybrid watershed/surface deformations procedure (Segonne et al., 2004), automated Talairach transformation, intensity normalization (Sled et al., 1998), tessellation of the gray matter white matter boundary, automated topology correction (Fischl et al., 2001; Segonne et al., 2007), and surface deformation following intensity gradients to optimally place the gray/white and gray/CSF borders at the location where the greatest shift in intensity defines the transition to the other tissue class (Dale et al., 1999; Fischl and Dale, 2000). Surface inflation and spherical registration procedures based on the matching of cortical folding patterns across individuals were used for group-based analyses (Fischl et al., 1999a, 1999b). Cortical thickness was computed as the closest distance from the gray matter/white matter boundary to the gray matter/cerebrospinal fluid (CSF) boundary at each vertex on the tessellated surface (Fischl and Dale, 2000). In FreeSurfer the cortical surface boundaries are occasionally slightly misplaced with regard to the boundary of the gray matter/white matter and/or gray matter/CSF border and occasionally need to be manually edited for very small adjustments. Due to this, cortical models are checked slice-by-slice throughout the entire brain image to assure that surfaces are appropriately placed at the gray/white and gray/CSF border (EL). Thickness data was smoothed using a circularly symmetric Gaussian kernel across the surface with a standard deviation of 20 mm. The reliability of obtaining cortical thickness measurements from MRI scans has been well documented in several instances (Dickerson et al., 2008; Han et al., 2006; Jovicich et al., 2009).
2.5. Statistical analysis
Analyses consisted of vertex-wise general linear models of the association between cross-sectional PTSD scores and thickness across the cortical mantle. A vertex refers to the spatial point of measurement resolution on the cortical surface maps, and vertex-wise analysis refers to a statistical analysis at each vertex. Statistical correction for multiple comparisons was performed using a Monte Carlo simulation-based clusterwise procedure to determine the distribution of the maximum cluster size under the null hypothesis as described previously (Hagler et al., 2006). Five thousand iterations of simulation were performed for each comparison, using a threshold of p = 0.05 and a (full-width half-maximum) FWHM of 20 for each analysis. All significance maps shown on cortical surfaces here have been masked to show only the regions that survived correction for multiple comparisons. Descriptions of all six vertex-wise general linear model analyses are given in Table 1 of the Supplementary material.
Analyses consisted of vertex-wise general linear models of the association between cross-sectional PTSD scores and thickness across the cortical mantle. A vertex refers to the spatial point of measurement resolution on the cortical surface maps, and vertex-wise analysis refers to a statistical analysis at each vertex. Statistical correction for multiple comparisons was performed using a Monte Carlo simulation-based clusterwise procedure to determine the distribution of the maximum cluster size under the null hypothesis as described previously (Hagler et al., 2006). Five thousand iterations of simulation were performed for each comparison, using a threshold of p = 0.05 and a full-width half-maximum (FWHM) of 20 for each analysis. All significance maps shown on cortical surfaces here have been masked to show only the regions that survived correction for multiple comparisons. Descriptions of all seven vertex-wise general linear model analyses are given in Table 1 of the Supplementary material.
2.6. ROI creation and statistical analysis
Regions of interest (ROIs) were created based on regions showing a significant effect in the whole-brain analyses comparing groups, CAPS score, and CLB-P to cortical thickness. Maps were corrected for multiple comparisons and thresholded at p < 0.05. Labels were created from clusters of adjacent significant voxels, and these labels were used as ROIs in separate independent analyses to look at potential interactions. For ROI-based analyses, the mean thickness within the ROI was calculated for each subject and used as a dependent variable. The chosen ROIs are a representative sample of all of the potential regions of interest from our general linear model analyses. Similar associations with cortical thickness, CAPS, and CLB-P were seen in all significant areas. The primary goal of the ROI-based analyses was to show the distribution of the effects in regions showing associations or group differences. The secondary goal was to test the hypothesis that CLB-P is a stronger predictor of cortical thickness, even in regions that are defined by current PTSD symptoms. To test this hypothesis we conducted Steiger's Z-tests on the significant correlations between CLB-P and thickness, and CAPS and thickness.
Separate independent analyses were run within ROIs using a standard least squares regression. Cross-sectional PTSD scores were used as independent variables, and mean thickness within the ROI was used as the dependent variable. Our final analysis (Analysis 6) looked at interactions with CLB-P and subgroups of participants that were created from the group that had current PTSD as well as a lifetime trauma history (n = 55). These subgroups were classified by either having current PTSD and a comorbid mTBI (n = 29) or having only current PTSD (n = 26), and were created to determine the effect that mTBI may have on individuals with current and lifetime PTSD symptoms. For these regressions with an interaction term, the interaction of group assignment and cross-sectional PTSD score was also entered as an independent variable.
3. Results
3.1. Group differences for current PTSD diagnosis — Analysis 1
Demographics for the entire sample are reported in Table 1. Unpaired two-sample t-tests revealed no group differences in age (t(102) = 1.48, p = 0.1405), years of education (t(102) = 1.54, p = 0.1266) or LDH total (t(102) = − 0.82, p = 0.4120). Pearson's chi-squared test revealed no significant group differences in gender (C2(1, N = 104) = 0.022, p = 0.88). As expected, groups differed on current CAPS score (t(102) = − 13.52, p < 0.0001), and subgroups with a pre-deployment trauma history (n = 85) differed significantly with regard to CLB-P (t(83) = − 3.71, p < 0.0001).
Cortical thickness comparisons between the PTSD and Deployed Control groups are presented in Fig. 3a. A specific list of all brain structures showing significantly reduced thickness is presented in Table 2 of the Supplementary material. Two ROIs were created from this analysis: the left and right postcentral gyri. Raw and age-adjusted mean thickness values are plotted in Fig. 4. Unpaired two-sample t-tests revealed significantly reduced thickness for the PTSD group in the left hemisphere (LH) insular ROI (t(102) = 2.2892, p < 0.0241) as well as the right hemisphere (RH) postcentral ROI (t(102) = 2.3647, p < 0.0199). These significant differences remained when controlling for age: LH insular ROI (t(102) = 3.2737, p < 0.0014); RH postcentral ROI (t(102) = 2.9743, p < 0.0037).
Fig. 3.
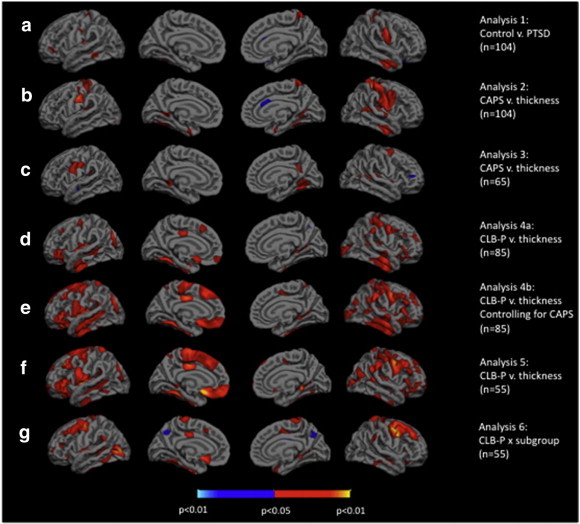
Surface significance maps, all corrected for age and multiple comparisons. a) Group comparison of control subjects (n = 39) vs. PTSD subjects (n = 65), red areas show where there is reduced cortical thickness in the PTSD group (Analysis 1). b) Current CAPS score vs. thickness in all subjects (n = 104), red areas show where cortical thickness is reduced with higher CAPS score (Analysis 2). c) Current CAPS score vs. thickness in all subjects with current PTSD (n = 65), red areas show where cortical thickness is reduced with higher CAPS score (Analysis 3). d) CLB-P vs. thickness in all subjects with lifetime history (n = 85), red areas show where cortical thickness is reduced with higher CLB-P (Analysis 4a). e) CLB-P vs. thickness, controlling for current CAPS, in all subjects with lifetime history (n = 85), red areas show where cortical thickness is reduced with higher CLB-P (Analysis 4b). f) CLB-P vs. thickness in all subjects with current PTSD and lifetime history (n = 55), red areas show where cortical thickness is reduced with higher CLB-P (Analysis 5). g) CLB-P × subgroup interaction in relation to cortical thickness. Subgroups are PTSD-only (n = 26) and comorbid (n = 29). Red areas show where cortical thickness is reduced with higher CLB-P in the comorbid subgroup, while higher CLB-P scores do not lead to reduced cortical thickness in the PTSD-only subgroup (Analysis 6).
Fig. 4.
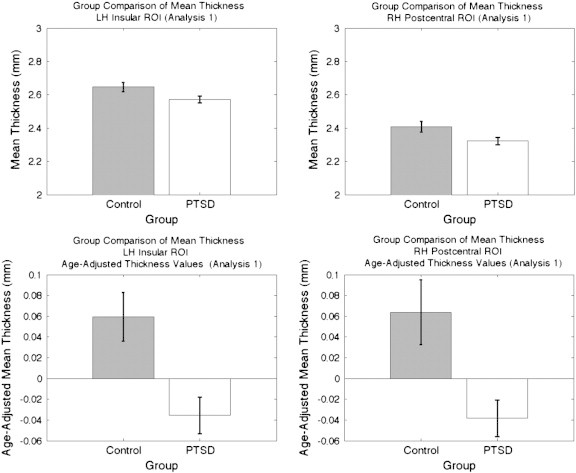
Comparison of mean thickness in the left insular ROI and the right postcentral ROI taken from the control vs. PTSD significance map (Analysis 1). (a − b) Raw thickness values, (c–d) Age-adjusted thickness values. SEM bars shown.
Cortical thickness comparisons between the PTSD and Deployed Control groups are presented in Fig. 3a. A specific list of all brain structures showing significantly reduced thickness is presented in Table 2 of the Supplementary material. Two ROIs were created from this analysis: the left and right postcentral gyri. Raw and age-adjusted mean thickness values are plotted in Fig. 4. Unpaired two-sample t-tests revealed significantly reduced thickness for the PTSD group in the left hemisphere (LH) insular ROI (t(102) = 2.2892, p < 0.0241) as well as the right hemisphere (RH) postcentral ROI (t(102) = 2.3647, p < 0.0199). These significant differences remained when controlling for age: LH insular ROI (t(102) = 3.2737, p < 0.0014); RH postcentral ROI (t(102) = 2.9743, p < 0.0037).
3.2. Cortical thickness associations with current CAPS score — Analysis 2
Associations between current CAPS score and cortical thickness in the entire sample (n = 104) are presented in Fig. 3b; these results are adjusted for age and multiple comparisons. Most regions of significance were similar to those found in the group analysis (above). A specific list of all brain structures showing significantly reduced thickness is presented in Table 2 of the Supplementary material. Two ROIs were extracted from this analysis, encompassing the right and left postcentral gyri. Two simple linear regression analyses were conducted to separately determine the effects of CAPS score and CLB-P score on mean cortical thickness within each of these ROIs. The CLB-P analyses were conducted only in the lifetime subgroup (n = 85). Table 2 (rows 1 and 2) presents the results of these analyses, and Fig. 5a and b present scatterplots of these associations. We note that the statistical values for the associations with CAPS score are biased to be regions showing the greatest association. Although this bias exists, the goal of these ROI-based analyses was to test the hypothesis that CLB-P is a stronger predictor of cortical thickness, even in regions that are defined by current PTSD symptoms. Steiger's Z-test revealed a z of 1.26 (p < 0.21) and a z of 0.29 (p < 0.76) for the left and right ROIs, respectively, indicating that the thickness values in this region were not more strongly correlated with CAPS score or CLB-P.
Table 2.
Statistics for simple regressions run on the 8 ROIs depicted in Fig. 5. Rows 1 and 2: ROIs extracted from the CAPS vs. thickness analysis in the full sample (n = 104). First two columns show regression analysis statistics from the whole sample (n = 104) and second two columns show statistics from lifetime subgroup (n = 85). Rows 3 and 4: ROIs extracted from CAPS vs. thickness in all subjects with current PTSD (n = 65). First two columns show statistics from all subjects with current PTSD (n = 65) and second two columns show statistics from individuals in the lifetime subgroup who also have current PTSD (n = 55). Rows 5 and 6: ROIs from CLB-P vs. thickness in lifetime subgroup (n = 85). Rows 6 and 7: ROIs from CLB-P vs. thickness in subjects with current PTSD (n = 55). Reported F values are Fischer's statistics and R2 values are coefficients of determination.
| ROI | CAPS R2 | CAPS F | CLB-P R2 | CLB-P F |
|---|---|---|---|---|
| LH middle postcentral (Analysis 2) | 0.0699 | 7.6756 | 0.0183 | 1.5492 |
| RH ventral postcentral (Analysis 2) | 0.0886 | 9.9114 | 0.1081 | 10.0646 |
| LH middle precentral/postcentral (Analysis 3) | 0.1405 | 10.2952 | 0.0807 | 4.6497 |
| RH dorsal precentral/superior frontal (Analysis 3) | 0.1307 | 9.4687 | 0.1169 | 7.0159 |
| LH insula (Analysis 4a) | 0.0212⁎⁎ | 2.2062 | 0.1488⁎⁎ | 14.5092 |
| RH dorsal postcentral (Analysis 4a) | 0.0729 | 8.0300 | 0.1612 | 15.9505 |
| LH insula/pars triangularis/lateral orbitofrontal (Analysis 5) | 0.0082⁎⁎ | 0.5201 | 0.2897⁎⁎ | 21.6122 |
| RH precentral/middle frontal (Analysis 5) | 0.0409⁎⁎ | 2.6834 | 0.2696⁎⁎ | 19.5652 |
Correlation values were significantly different between CAPS and CLB-P as tested by Steiger's Z-test at p < 0.05.
Fig. 5.
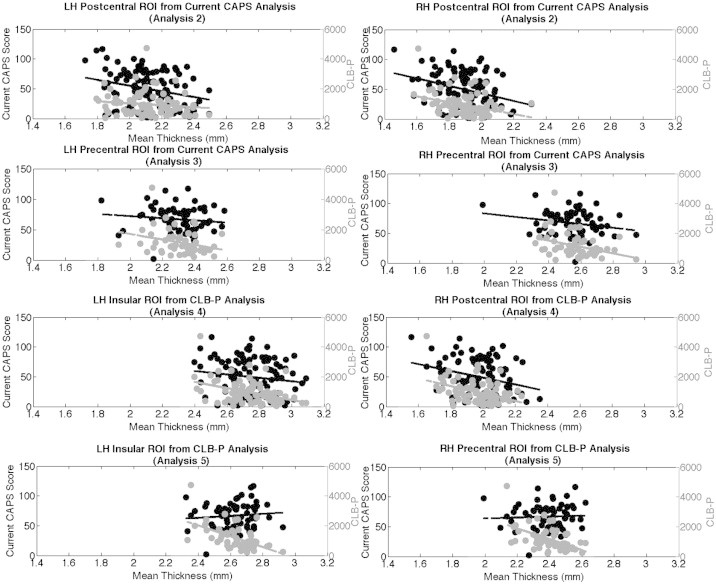
(a–b): Thickness values of ROIs created from all subjects vs. current CAPS score (Analysis 2). (c–d): Thickness values of ROIs created from PTSD subjects vs. current CAPS score (Analysis 3). (e–f): Thickness values of ROIs created from all subjects vs. CLB-P (Analysis 4). (g–h): Thickness values of ROIs created from PTSD subjects vs. CLB-P score (Analysis 5). In all figures, thickness values are plotted against current CAPS score (black, left-hand y-axis) and also against CLB-P (gray, right-hand y-axis).
Associations between current CAPS score and cortical thickness in the entire sample (n = 104) are presented in Fig. 3b; these results are adjusted for age and multiple comparisons. Most regions of significance were similar to those found in the group analysis (Analysis 1). A specific list of all brain structures showing significantly reduced thickness is presented in Table 2 of the Supplementary material. Two ROIs were extracted from this analysis, encompassing the right and left postcentral gyri. Two simple linear regression analyses were conducted to separately determine the effects of CAPS score and CLB-P score on mean cortical thickness within each of these ROIs. The CLB-P analyses were conducted only in the lifetime subgroup (n = 85). Table 2 (rows 1 and 2) presents the results of these analyses, and Fig. 5a and b present scatterplots of these associations. We note that the statistical values for the associations with CAPS score are biased to be regions showing the greatest association. Although this bias exists, the goal of these ROI-based analyses was to test the hypothesis that CLB-P is a stronger predictor of cortical thickness, even in regions that are defined by current PTSD symptoms. Steiger's Z-test revealed a z of 1.26 (p < 0.21) and a z of 0.29 (p < 0.76) for the left and right ROIs, respectively, indicating that the thickness values in these regions were not more strongly correlated with CAPS score or CLB-P.
3.3. Cortical thickness associations with current CAPS score in individuals with PTSD — Analysis 3
We then examined the association between CAPS score and cortical thickness only in individuals with a current PTSD diagnosis (n = 65); these results are presented in Fig. 3c. We conducted this analysis to determine if the low CAPS scores seen in the Deployed Control group were causing the effects on thickness to be more strongly weighted in one direction, and whether or not the effects would still be seen in a smaller range of CAPS scores. Areas of reduced thickness were generally consistent with those found in the whole group (n = 104), except for the right postcentral gyrus, which did not emerge as significant in this analysis. The following ROIs were extracted from these corrected maps: portions of left pre and post-central gyri, and portions of the right dorsal precentral and superior frontal gyri. Two simple linear regressions were then conducted to determine the effects of CAPS and CLB-P scores on cortical thickness within these ROIs; the CLB-P analyses were conducted in the lifetime subgroup of participants with current PTSD (n = 55). Fig. 5c and d show the negative association between both CAPS and CLB-P scores and the mean cortical thickness values in each of these regions. Statistical values for these two regions are reported in rows 3 and 4 of Table 2. Steiger's Z-test revealed a z of 1.30 (p < 0.19) and a z of 2.32 (p < 0.02) for the right and left ROIs, respectively, indicating that in the left insular ROI the correlation with thickness and CLB-P was stronger than that with current CAPS score.
3.4. Cortical thickness associations with CLB-P — Analysis 4a & b
Associations between CLB-P and cortical thickness in our lifetime subgroup (n = 85) are presented in Fig. 3d. These results are statistically corrected for multiple comparisons. A specific list of all brain structures showing significantly reduced thickness is presented in Table 2 of the Supplementary material. ROIs were created in the left insula and the right dorsal postcentral gyrus. Two simple linear regression analyses were conducted to determine the effects of CAPS and CLB-P scores on mean cortical thickness within each ROI. Fig. 5e and f present scatterplots of these associations. Statistical values are reported in rows 5 and 6 of Table 2. Steiger's Z-test revealed a z of 0.60 (p < 0.54) and a z of 0.11 (p < 0.92) for the left and right ROIs, respectively, indicating that in these regions neither current CAPS score nor CLB-P was a stronger predictor of thickness. A Kolmogorov–Smirnov test determined that the distributions of per-vertex significance values between the CAPS score analysis (Analysis 2) and the CLB-P analysis (Analysis 4a) were significantly different (K–S = 0.0383, p = 4.28e − 24), demonstrating that the distribution of significant vertices was greater in Analysis 4a than in Analysis 2.
Associations between CLB-P and cortical thickness in our lifetime subgroup (n = 85) are presented in Fig. 3d. These results are statistically corrected for multiple comparisons. A specific list of all brain structures showing significantly reduced thickness is presented in Table 2 of the Supplementary material. ROIs were created in the left insula and the right dorsal postcentral gyrus. Two simple linear regression analyses were conducted to determine the effects of CAPS and CLB-P scores on mean cortical thickness within each ROI. Fig. 5e and f present scatterplots of these associations. Statistical values are reported in rows 5 and 6 of Table 2. Steiger's Z-test revealed a z of 0.60 (p < 0.54) and a z of 0.11 (p < 0.92) for the left and right ROIs, respectively, indicating that in these regions neither current CAPS score nor CLB-P was a stronger predictor of thickness. A Kolmogorov–Smirnov test determined that the distributions of per-vertex significance values between the CAPS score analysis (Analysis 2) and the CLB-P analysis (Analysis 4a) were significantly different (K–S = 0.0383, p = 4.28e − 24), demonstrating that the distribution of significant vertices was greater in Analysis 4a than in Analysis 2.
We then performed the same analysis with CLB-P in the same group of 85 subjects, but also controlling for current CAPS score. Surface maps of the significant regions are shown in Fig. 3e, results are statistically corrected for multiple comparisons. A Kolmogorov–Smirnov test determined that the distributions of per-vertex significance values between Analysis 4a and Analysis 4b were significantly different (K–S = 0.0824, p = 5.05e − 162), demonstrating that the distribution of significant vertices was greater in Analysis 4b than in Analysis 4a (See Supplementary material, Fig. 1).
Fig. 6.
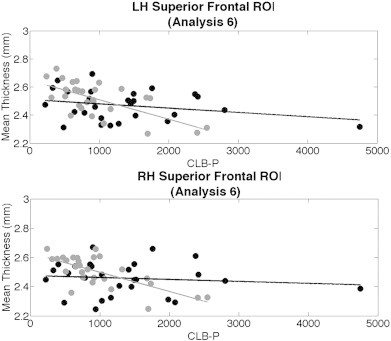
Thickness values of comorbid (gray) subjects and PTSD-only (black) subjects against CLB-P in the 2 superior frontal ROIs from Analysis 6.
3.5. Cortical thickness associations with CLB-P in individuals with PTSD — Analysis 5
An additional analysis focused only on the subset of individuals with both current and lifetime PTSD (n = 55); these results are presented in Fig. 3f. A specific list of all brain structures showing significantly reduced thickness is presented in Table 2 of the Supplementary material. ROIs were extracted from both hemispheres following correction for multiple comparisons; the left hemisphere ROI contained portions of the insula, pars triangularis, and lateral orbitofrontal gyrus; the right ROI contained portions of the middle precentral and middle frontal gyri. The simple linear regressions described above were repeated for these two ROIs. Fig. 5g and h present scatterplots of these associations; statistical values are reported in rows 7 and 8 of Table 2. Steiger's Z-test revealed a z of 2.92 (p < 0.01) and a z of 2.07 (p < 0.03) for the left and right ROIs, respectively, indicating that in both regions CLB-P was more strongly correlated with thickness than current CAPS score.
An additional analysis focused only on the subset of individuals with both current and lifetime PTSD (n = 55); these results are presented in Fig. 3f. A specific list of all brain structures showing significantly reduced thickness is presented in Table 2 of the Supplementary material. ROIs were extracted from both hemispheres following correction for multiple comparisons; the left hemisphere ROI contained portions of the insula, pars triangularis, and lateral orbitofrontal gyrus; the right ROI contained portions of the middle precentral and middle frontal gyri. The simple linear regressions described above were repeated for these two ROIs. Fig. 5g and h present scatterplots of these associations; statistical values are reported in rows 7 and 8 of Table 2. Steiger's Z-test revealed a z of 2.92 (p < 0.01) and a z of 2.07 (p < 0.03) for the left and right ROIs, respectively, indicating that in both regions CLB-P was more strongly correlated with thickness than current CAPS score.
3.6. Interactions with mTBI and PTSD/mTBI comorbidity — Analysis 6
To determine whether mTBI influenced associations between CLB-P scores and cortical thickness, we divided the lifetime PTSD group (n = 55) into two subgroups based on a history of military-related mTBI; PTSD-only (n = 26) and comorbid PTSD/mTBI (n = 29). These groups did not differ significantly in current CAPS score (t(53) = 0.9512, p > .05), CLB-P (t(53) = 1.9321, p > .05), education (t(53) = 0.0261, p > .05), LDH (t(53) = 0.6881, p > .05), deployment length (t(53) = 0.4192, p > 0.05), or gender (C2(1, N = 55) = 2.51, p = .11). They did, however, differ significantly in age ((t(53) = 2.3122, p < 0.0247, comorbid mean = 30.25, PTSD-only mean = 35.78).
We then conducted a final whole-brain general linear model analysis to determine if there was an interactive effect between CLB-P and subgroup on cortical thickness. These associations are shown in Fig. 3g. Significant regions that differed from the analysis encompassing all PTSD subjects with lifetime data (Fig. 3f) were found in bilateral superior frontal regions. We created significance-based ROIs from these two regions, and conducted a standard least squares regression analysis in each. Statistical values are reported in Table 3. Fig. 6 presents scatterplots for these analyses.
Table 3.
Statistics for standard least squares regressions run with interactions between CLB-P and subgroup for the bilateral superior frontal ROIs depicted in Fig. 3f. Reported F values are Fischer's statistics and R2 values are coefficients of determination.
| Group | CLB-P | Group × CLB-P | R2 | F | ||
|---|---|---|---|---|---|---|
| LH superior frontal | B | 0.0056 | − 0.8445e − 4⁎⁎ | 0.54e − 4⁎⁎ | 0.3101 | 7.6446⁎⁎ |
| SE | 0.0138 | 0.1931e − 4 | 0.1931e − 4 | |||
| RH superior frontal | B | 0.0081 | − 0.7228e − 4⁎⁎ | − 0.5916e − 4⁎⁎ | 0.281 | 6.6453⁎⁎ |
| SE | 0.0136 | 0.19e − 4 | 0.19e − 4 |
B values are beta weights and SE values are standard errors of the mean.
p < 0.01
4. Discussion
The current study found that two measures related to an individual's total trauma load, cumulative lifetime stress and mTBI, were important factors linked to neural integrity. First, increasing expression of current PTSD was associated with reduced brain tissue in several cortical regions; however, associations between stress symptoms and brain structure were more widespread across a larger number of cortical surface vertices when considering lifetime burden of PTSD. Second, individuals with comorbid PTSD and mTBI showed stronger associations between stress symptoms and imaging markers of brain health compared to individuals with PTSD only. These data demonstrate the importance of using lifetime history in understanding the relationship between post-traumatic stress symptoms and brain structure. Additionally, the current findings may suggest that mTBI contributes to a neural environment in which brain tissue is more susceptible to stress induced damage, or alternatively, damages brain regions that result in greater expression of PTSD symptoms. While this study is cross-sectional, it provides insight into the potential longitudinal mechanisms of trauma via the lifetime data collected with the CAPS and BAT-L. In addition, it suggests that the presence of an mTBI may compound this effect even further.
To our knowledge, this is the first study that attempts to model the burden of psychological trauma across the lifespan, and to relate this burden to cortical thickness across the entire brain. Prior exposure to trauma is one of the highest risk factors for developing PTSD from a current traumatic event (Breslau, 2002; Breslau and Peterson, 2010; Brewin et al., 2000; Cougle et al., 2009), but how a lifetime load of psychological trauma impacts brain structure is unknown. Duration and severity of symptoms are critical if some brain structures are more susceptible to the effects of stress than others. This idea has been implicated in theories of allostatic load, in which an accumulation of stress throughout the lifetime has shown to have detrimental physiological effects (McEwen and Seeman, 1999), and biological measures of allostatic load have been discovered to be higher in individuals with PTSD (Glover et al., 2006). Prior studies have found decreased hippocampal volume with chronic combat-related PTSD (Apfel et al., 2011; Gurvits et al., 1996), but lifetime PTSD was defined categorically, which does not take into account the potentially additive effect. In the current study, we attempted to address these issues by quantifying the Cumulative Lifetime Burden of psychological trauma with the CLB-P, and using whole-brain cortical thickness approaches to investigate how multiple psychological traumas impact brain structure.
4.1. Patterns of cortical thickness in relation to current CAPS score
Higher current CAPS scores were associated with areas of reduced cortical thickness mainly in the postcentral gyri, insula, precuneus, fusiform, and entorhinal cortices. A common finding in structural PTSD studies is reductions in amygdala volume (Karl et al., 2006). While we did not examine the volumes of subcortical structures, the fusiform and entorhinal cortices are components of the paralimbic system and have strong connections with the amygdala (Gschwind et al., 2012; Kerr et al., 2007; Shi and Cassell, 1999). It is possible that these volumetric and thickness reductions go hand-in-hand in the context of PTSD, and future work will include examining the integrity of the white matter connections between these structures. Several functional neuroimaging studies have showed reduced activity in the precuneus with PTSD (Bluhm et al., 2009; Geuze et al., 2008a; Hayes et al., 2011). The precuneus is part of the resting-state default mode network (DMN) (Raichle et al., 2001), and there is mounting evidence that this network may be disrupted in both PTSD and mTBI (Daniels et al., 2010; Lanius et al., 2010; Mayer et al., 2011; Sripada et al., 2012a; Zhou et al., 2012). These existing studies suggest that reduced resting state connectivity between the precuneus and the anterior cingulate cortex and the right amygdala is related to PTSD severity, and can also predict future symptom severity. In the context of mTBI, the aforementioned studies have demonstrated decreased functional connectivity within the DMN itself, but hyper-connectivity between the DMN and prefrontal regions. Other studies have demonstrated reduced volume of the precuneus in combined PTSD and depression (Kroes et al., 2011). Taken together with our findings of reduced cortical thickness, these additional findings suggest that the precuneus may be particularly vulnerable with worsening symptoms of PTSD as well as with exposure to mTBI.
Diffuse regions of the parietal lobes, namely the postcentral gyri, have also exhibited reduced cortical thickness in subjects with PTSD, similar to our findings with both current CAPS score and CLB-P. Specifically, a study by Liu et al. used a whole-brain analysis technique and found reductions in cortical thickness in the left parietal lobe, overlapping with left postcentral gyrus (Liu et al., 2012). Our results, however, are in contrast with other studies that have found reduced volume in additional brain regions. Anterior cingulate cortex (ACC) volume reduction is a commonly reported finding (Kasai et al., 2008; Woodward et al., 2006), but did not emerge as significant in any of our cortical thickness analyses. The first of these studies differed from ours in that they measured changes in gray matter volume of the isolated ACC, rather than examining changes throughout the entire brain. Examining only a specific ROI can produce very different results from exploratory brain-wide analyses. The second study used voxel-based morphometry to examine gray matter density differences in the ACC in combat-exposed twins with and without PTSD, which differs from our methods of using whole-brain analyses to investigate cortical thickness differences, and their sample size was also only one-fifth of the size of ours. Additionally, our post-hoc ROI-based analyses in regions that are commonly implicated in PTSD did not reveal significant differences. The presence of these discrepancies may thus suggest the influence of other factors, such as difference in the specific demographics of the samples, specific traumatic events and timelines, etc.
4.2. Patterns of cortical thickness in relation to CLB-P
We found additional regions of significantly reduced cortical thickness when modeling the severity of PTSD across the lifetime, including frontal, temporal, occipital, and insular regions, all of which have been associated with current PTSD (Ahmed et al., 2012; Geuze et al., 2008b; Woodward et al., 2009). The appearance of the occipital cortex in these findings is noteworthy, as it did not appear in our analyses involving current PTSD, but these regions have previously been suggested to show reductions in gray matter density and functional connectivity with PTSD (Tavanti et al., 2012; Whalley et al., 2013; Zhang et al., 2011). Many of these have suggested a relationship between lateral occipital cortex differences and the experiencing of flashbacks of traumatic events. In one specific study, Chao et al. found that individuals with PTSD had lower gray matter density in the lateral occipital cortex, and also that the hemodynamic response in this region to novel, aversive visual stimuli was correlated with measures of intrusion symptoms (Chao et al., 2012).
Taken together, previous studies and our findings with CLB-P imply that the longer an individual lives with a trauma-related psychological burden, the greater the observed reduction in thickness will be. Interestingly, when we looked at the relationship between CLB-P and thickness while controlling for current CAPS score in Analysis 4b, the effects appeared stronger and more widespread. We attribute this to the idea CAPS and CLB-P may provide metrics of psychological trauma with different properties, and the fact that a stronger association presents with CLB-P after controlling for CAPS suggests that the two are not simply correlated measures with different noise. Additionally, when our analyses focused solely on subjects with a current and lifetime PTSD diagnosis (Analysis 5), the strength of these relationships was enhanced. Thus, while low CLB-P scores are sufficient to show a relationship with cortical thickness, a current PTSD diagnosis is necessary for the full measure of effects to be seen.
Several other studies have used existing lifetime trauma questionnaires to study brain structure, and have found inverse correlations between brain structure integrity and lifetime or childhood trauma load. One existing study used the TAQ (Nardo et al., 2010) to define individuals categorically based on their self-reported resilience scores to traumas throughout their lifetimes, and did not examine scores on a continuous scale. They found that individuals with current PTSD as well as high lifetime scores for trauma and neglect exhibited lower gray matter densities in the left posterior cingulate and hippocampal gyri; areas that we found significant after examining cortical thickness in the context of CLB-P. These regions comprise part of the limbic system, which is involved in emotional processing and memory-formation, two cognitive domains that are frequently disrupted with PTSD (Buckley et al., 2000; Kashdan et al., 2010). A second study found an inverse relationship with CAPS score and insular volume using THQ to quantify a childhood trauma load, as well as CAPS score for the previous month to determine a current trauma load, but did not examine a point in time immediately following a trauma during adulthood (Herringa et al., 2012). As demonstrated in Table 1 of our Supplementary materials, the left insula is the only structure that repeatedly showed reduced thickness through all six of our analyses. The robustness of both the right and left hemisphere findings in the insula indicate that this structure may be important in both the development of PTSD after traumatic events, and also to the maintenance of PTSD symptoms over time. Furthermore, recent work has shown that there is altered functional connectivity between the amygdala, hippocampus, and insula in male combat veterans with PTSD (Sripada et al., 2012b), tying many previous structural findings to our own.
Several other studies have used existing lifetime trauma questionnaires to study brain structure, and have found inverse correlations between brain structure integrity and lifetime or childhood trauma load. One existing study used the TAQ (Nardo et al., 2010) to define individuals categorically based on their self-reported resilience scores to traumas throughout their lifetimes, and did not examine scores on a continuous scale. They found that individuals with current PTSD as well as high lifetime scores for trauma and neglect exhibited lower gray matter densities in the left posterior cingulate and hippocampal gyri; areas that we found significant after examining cortical thickness in the context of CLB-P. These regions comprise part of the limbic system, which is involved in emotional processing and memory-formation, two cognitive domains that are frequently disrupted with PTSD (Buckley et al., 2000; Kashdan et al., 2010). A second study found an inverse relationship with CAPS score and insular volume using the THQ to quantify a childhood trauma load, as well as CAPS score for the previous month to determine a current trauma load, but did not examine a point in time immediately following a trauma during adulthood (Herringa et al., 2012). As demonstrated in Table 1 of our Supplementary materials, the left insula is the only structure that repeatedly showed reduced thickness through all seven of our analyses. The robustness of both the right and left hemisphere findings in the insula indicate that this structure may be important in both the development of PTSD after traumatic events, and also to the maintenance of PTSD symptoms over time. Furthermore, recent work has shown that there is altered functional connectivity between the amygdala, hippocampus, and insula in male combat veterans with PTSD (Sripada et al., 2012b), tying many previous structural findings to our own.
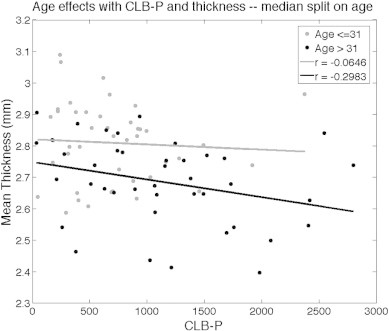
A limitation of the CLB-P measure is that an individual's age is in part a determinant of its calculation. Due to this, age was not corrected for in our CLB-P analyses. To address the issue of age with CLB-P, we conducted two separate post-hoc analyses. In the first post-hoc analysis, we created two groups using a median split on age, and ran the same CLB-P analysis in each group. The effect of CLB-P on cortical thickness did not differ significantly in either age group (see Supplementary material; Fig. 2). In the second post-hoc analysis, we created two groups using a median split on CLB-P, and then age-matched the two groups. We conducted a group-difference GLM analysis and found that the HIGH-CLB-P group had thinner cortex than the LOW-CLB-P group in the same regions that we identified in Analysis 4a (see Supplementary material; Fig. 3).
A limitation of the CLB-P measure is that an individual's age is in part a determinant of its calculation. Due to this, age was not corrected for in our CLB-P analyses. To address the issue of age with CLB-P, we conducted two separate post-hoc analyses. In the first post-hoc analysis, we created two groups using a median split on age, and ran the same CLB-P analysis in each group. The effect of CLB-P on cortical thickness did not differ significantly in either age group (see Supplementary material; Fig. 2). In the second post-hoc analysis, we created two groups using a median split on CLB-P, and then age-matched the two groups. We conducted a group-difference GLM analysis and found that the HIGH-CLB-P group had thinner cortex than the LOW-CLB-P group in the same regions that we identified in Analysis 4a (see Supplementary material; Fig. 3).
4.3. Patterns of cortical thickness with co-morbid mTBI
We found potentially interactive effects of CLB-P and comorbid mTBI on cortical thickness. Prior studies have suggested that cortical changes in conjunction with mTBI are either too miniscule to detect with current imaging techniques, or do not even exist at all (Mac Donald et al., 2011; Shenton et al., 2012). Although our secondary analyses examining mTBI subgroups did not reveal significant differences in those with compared to without mTBI in our eight main ROIs, our analyses within the bilateral superior frontal regions indicate an interaction that physical and psychological trauma may have on cortical thickness. In these instances, participants with comorbid mTBI and current PTSD showed a decrease in thickness with higher CLB-P, while subjects without mTBI retained a constant thickness level regardless of score. Our results are suggestive of an additive effect of CLB-P and mTBI exposure on cortical thickness reduction, but more data is needed to determine whether these differences are regionally specific or more global.
A recent literature review examined the convergence of PTSD and mTBI in both neuropsychological and neuroanatomical domains that may shed some light on our current findings (Stein and McAllister, 2009). They suggest that the orbitofrontal and lateral prefrontal cortices are the two regions that show the most overlap in vulnerability to both PTSD and mTBI. These regions also demonstrated reduced cortical thickness in our Analyses 4–6, all of which included individuals who had both comorbid mTBI and PTSD, as well as a lifetime history of psychological trauma. Future work will include investigation of deep white matter integrity underlying and connecting these structures, as well as analysis of neuropsychological correlates obtained during neuropsychological testing.
In summary, we present novel results on the nature of PTSD and mTBI in the context of cortical thickness, as well as novel methods of quantifying PTSD burden across and individual's lifetime. Multiple psychological trauma exposures seem to have a cumulative effect on the human cortex, and they also appear to interact with a history of mTBI. Our results demonstrate the necessity of taking trauma across the lifespan into account, rather than only looking at a single snapshot of current PTSD symptoms.
4.4. Limitations
The study of veteran populations is greatly limited by challenges due to the heterogeneity of the population and the various medical and other comorbidities that are commonly found in this population. The cortical thickness findings presented in the current study are divergent from many studies in the existing literature, and may in part be due to the nature of our veteran cohort. Participants are recruited through veterans outreach events by a full-time recruiter, and are not necessarily treatment-seeking. This is important to note because many existing studies recruit participants from trauma treatment clinics, and this may therefore add a dimension of variance to our cohort. Additionally, the nature of injuries and exposures in this population is varied, as well as the time elapsed since the injuries were sustained. Thus, even with the large sample presented here, it is therefore still possible that the results presented are specific to this cohort and not generalizable to a broader population. We feel that our matching on several of the most prominent features of the veteran population provides confidence that will be validated in ongoing work. Finally, our new technique of modeling CLB-P has not yet been implemented in other studies, and this also raises the question as to whether our results will generalize across other populations or future subjects within our own cohort. There is no normative data available for the CLB-P, and findings based on this tool should be considered preliminary and require further support from psychometric studies. Additionally, our calculation of CLB-P as based on retrospective CAPS scores may produce varying degrees of measurement error. Work is ongoing in our laboratory to clarify these issues, including longitudinal research.
The following are the supplementary data related to this article.
Supplementary material.
Supplementary material Fig. 1.
Histograms of the distributions of significance values for the surface maps of Analyses 2, 4a, and 4b.
A median split on age was conducted to determine whether age contributes to the effects of CLB-P seen on thickness in the LH insula ROI from Analysis 4a. Fisher's r-to-z transformation determined that the correlation between CLB-P and thickness was not significantly different between the two age groups.
A median split on CLB-P was conducted to further investigate whether age contributes to the effects of CLB-P seen on thickness across the entire cortex. In this analysis we split all 85 of our “lifetime” subjects into HIGH and LOW CLB-P groups. We then age-matched the two groups by removing individuals from each until there was a one-to-one correspondence with age between them. Our final groups each had 22 individuals, with ages in each group ranging from 25 to 58. The mean CLB-P for the LOW group was 452.67, and the mean for the HIGH group was 1687.69. We then conducted a whole-brain GLM analysis on the entire cortical surface to test for group differences between these age-matched groups. We also repeated this analysis controlling for age. Our results demonstrate group differences in the same regions where we saw effects of CLB-P on thickness in Analysis 4a, and age-controlled results looked identical. Red regions on the surface maps demonstrate where the HIGH CLB-P group had thinner cortex than the LOW CLB-P group at p < 0.05.
Supplementary data to this article can be found online at http://dx.doi.org/10.1016/j.nicl.2013.04.009.
Acknowledgments
This research was support by the Translational Research Center for TBI and Stress Disorders (TRACTS), a VA Rehabilitation Research and Development Traumatic Brain Injury Center of Excellence (B6796-C) and VA Merit Review Award to Regina McGlinchey.
Footnotes
This is an open-access article distributed under the terms of the Creative Commons Attribution-NonCommercial-ShareAlike License, which permits non-commercial use, distribution, and reproduction in any medium, provided the original author and source are credited.
Appendix A.
| (1) |
References
- Ahmed F. Relationship between neurocognition and regional brain volumes in traumatized adolescents with and without posttraumatic stress disorder. Neuropsychobiology. 2012;66(3):174–184. doi: 10.1159/000339558. [DOI] [PubMed] [Google Scholar]
- Apfel B.A. Hippocampal volume differences in Gulf War veterans with current versus lifetime posttraumatic stress disorder symptoms. Biological Psychiatry. 2011;69(6):541–548. doi: 10.1016/j.biopsych.2010.09.044. [DOI] [PMC free article] [PubMed] [Google Scholar]
- Atkinson M.P., Guetz A., Wein L.M. A dynamic model for posttraumatic stress disorder among U.S. Troops in Operation Iraqi Freedom. Management Science. 2009;55(9):13. [Google Scholar]
- Belanger H.G., Uomoto J.M., Vanderploeg R.D. The Veterans Health Administration's (VHA's) Polytrauma System of Care for mild traumatic brain injury: costs, benefits, and controversies. The Journal of Head Trauma Rehabilitation. 2009;24(1):4–13. doi: 10.1097/HTR.0b013e3181957032. [DOI] [PubMed] [Google Scholar]
- Blake D.D. The development of a Clinician-Administered PTSD Scale. Journal of Traumatic Stress. 1995;8(1):75–90. doi: 10.1007/BF02105408. [DOI] [PubMed] [Google Scholar]
- Bluhm R.L. Alterations in default network connectivity in posttraumatic stress disorder related to early-life trauma. Journal of Psychiatry & Neuroscience. 2009;34(3):187–194. [PMC free article] [PubMed] [Google Scholar]
- Brands A.M. Cognitive performance, psychological well-being, and brain magnetic resonance imaging in older patients with type 1 diabetes. Diabetes. 2006;55(6):1800–1806. doi: 10.2337/db05-1226. [DOI] [PubMed] [Google Scholar]
- Bremner J.D. MRI-based measurement of hippocampal volume in patients with combat-related posttraumatic stress disorder. The American Journal of Psychiatry. 1995;152(7):973–981. doi: 10.1176/ajp.152.7.973. [DOI] [PMC free article] [PubMed] [Google Scholar]
- Breslau N. Epidemiologic studies of trauma, posttraumatic stress disorder, and other psychiatric disorders. Canadian Journal of Psychiatry. 2002;47(10):923–929. doi: 10.1177/070674370204701003. [DOI] [PubMed] [Google Scholar]
- Breslau N., Peterson E.L. Assaultive violence and the risk of posttraumatic stress disorder following a subsequent trauma. Behaviour Research and Therapy. 2010;48(10):1063–1066. doi: 10.1016/j.brat.2010.07.001. [DOI] [PMC free article] [PubMed] [Google Scholar]
- Brewin C.R., Andrews B., Valentine J.D. Meta-analysis of risk factors for posttraumatic stress disorder in trauma-exposed adults. Journal of Consulting and Clinical Psychology. 2000;68(5):748–766. doi: 10.1037//0022-006x.68.5.748. [DOI] [PubMed] [Google Scholar]
- Buckley T.C., Blanchard E.B., Neill W.T. Information processing and PTSD: a review of the empirical literature. Clinical Psychology Review. 2000;20(8):1041–1065. doi: 10.1016/s0272-7358(99)00030-6. [DOI] [PubMed] [Google Scholar]
- Chao L.L., Lenoci M., Neylan T.C. Effects of post-traumatic stress disorder on occipital lobe function and structure. Neuroreport. 2012;23(7):412–419. doi: 10.1097/WNR.0b013e328352025e. [DOI] [PubMed] [Google Scholar]
- Cougle J.R., Resnick H., Kilpatrick D.G. Does prior exposure to interpersonal violence increase risk of PTSD following subsequent exposure? Behaviour Research and Therapy. 2009;47(12):1012–1017. doi: 10.1016/j.brat.2009.07.014. [DOI] [PMC free article] [PubMed] [Google Scholar]
- Dale A.M., Fischl B., Sereno M.I. Cortical surface-based analysis. I. Segmentation and surface reconstruction. NeuroImage. 1999;9(2):179–194. doi: 10.1006/nimg.1998.0395. [DOI] [PubMed] [Google Scholar]
- Daniels J.K. Switching between executive and default mode networks in posttraumatic stress disorder: alterations in functional connectivity. Journal of Psychiatry & Neuroscience. 2010;35(4):258–266. doi: 10.1503/jpn.090175. [DOI] [PMC free article] [PubMed] [Google Scholar]
- De Bellis M.D., Kuchibhatla M. Cerebellar volumes in pediatric maltreatment-related posttraumatic stress disorder. Biological Psychiatry. 2006;60(7):697–703. doi: 10.1016/j.biopsych.2006.04.035. [DOI] [PubMed] [Google Scholar]
- Dickerson B.C. Detection of cortical thickness correlates of cognitive performance: reliability across MRI scan sessions, scanners, and field strengths. NeuroImage. 2008;39(1):10–18. doi: 10.1016/j.neuroimage.2007.08.042. [DOI] [PMC free article] [PubMed] [Google Scholar]
- Fennema-Notestine C. Brain morphometry in female victims of intimate partner violence with and without posttraumatic stress disorder. Biological Psychiatry. 2002;52(11):1089–1101. doi: 10.1016/s0006-3223(02)01413-0. [DOI] [PubMed] [Google Scholar]
- Fischl B., Dale A.M. Measuring the thickness of the human cerebral cortex from magnetic resonance images. Proceedings of the National Academy of Sciences of the United States of America. 2000;97(20):11050–11055. doi: 10.1073/pnas.200033797. [DOI] [PMC free article] [PubMed] [Google Scholar]
- Fischl B. High-resolution intersubject averaging and a coordinate system for the cortical surface. Human Brain Mapping. 1999;8(4):272–284. doi: 10.1002/(SICI)1097-0193(1999)8:4<272::AID-HBM10>3.0.CO;2-4. [DOI] [PMC free article] [PubMed] [Google Scholar]
- Fischl B., Sereno M.I., Dale A.M. Cortical surface-based analysis. II: inflation, flattening, and a surface-based coordinate system. NeuroImage. 1999;9(2):195–207. doi: 10.1006/nimg.1998.0396. [DOI] [PubMed] [Google Scholar]
- Fischl B., Liu A., Dale A.M. Automated manifold surgery: constructing geometrically accurate and topologically correct models of the human cerebral cortex. IEEE Transactions on Medical Imaging. 2001;20(1):70–80. doi: 10.1109/42.906426. [DOI] [PubMed] [Google Scholar]
- Fischl B. Whole brain segmentation: automated labeling of neuroanatomical structures in the human brain. Neuron. 2002;33(3):341–355. doi: 10.1016/s0896-6273(02)00569-x. [DOI] [PubMed] [Google Scholar]
- Fischl B. Sequence-independent segmentation of magnetic resonance images. NeuroImage. 2004;23(Suppl. 1):S69–S84. doi: 10.1016/j.neuroimage.2004.07.016. [DOI] [PubMed] [Google Scholar]
- Fischl B. Automatically parcellating the human cerebral cortex. Cerebral Cortex. 2004;14(1):11–22. doi: 10.1093/cercor/bhg087. [DOI] [PubMed] [Google Scholar]
- Fortier C.B. Reduced cortical thickness in abstinent alcoholics and association with alcoholic behavior. Alcoholism, Clinical and Experimental Research. 2011;35(12):2193–2201. doi: 10.1111/j.1530-0277.2011.01576.x. [DOI] [PMC free article] [PubMed] [Google Scholar]
- Fortier C.B., Amick M.A., Grande L., McGlynn S., Kenna A., Morra L., Clark A., Milberg W.P., McGlinchey R.E. The Boston Assessment of Traumatic Brain Injury-Lifetime (BAT-L) semi-structured interview: preliminary evidence of research utility and validity. The Journal of Head Trauma. 2012 doi: 10.1097/HTR.0b013e3182865859. (Epub ahead of print) [DOI] [PMC free article] [PubMed] [Google Scholar]
- Geuze E. Precuneal activity during encoding in veterans with posttraumatic stress disorder. Progress in Brain Research. 2008;167:293–297. doi: 10.1016/S0079-6123(07)67026-5. [DOI] [PubMed] [Google Scholar]
- Geuze E. Thinner prefrontal cortex in veterans with posttraumatic stress disorder. NeuroImage. 2008;41(3):675–681. doi: 10.1016/j.neuroimage.2008.03.007. [DOI] [PubMed] [Google Scholar]
- Glover D.A., Stuber M., Poland R.E. Allostatic load in women with and without PTSD symptoms. Psychiatry. 2006;69(3):191–203. doi: 10.1521/psyc.2006.69.3.191. [DOI] [PMC free article] [PubMed] [Google Scholar]
- Green B. Trauma History Questionnaire. In: Stamm B.H., editor. Measurement of Stress, Trauma, and Adaptation. Sidran; Lutherville, MD: 1996. pp. 366–368. [Google Scholar]
- Gschwind M. White-matter connectivity between face-responsive regions in the human brain. Cerebral Cortex. 2012;22(7):1564–1576. doi: 10.1093/cercor/bhr226. [DOI] [PubMed] [Google Scholar]
- Gurvits T.V. Magnetic resonance imaging study of hippocampal volume in chronic, combat-related posttraumatic stress disorder. Biological Psychiatry. 1996;40(11):1091–1099. doi: 10.1016/S0006-3223(96)00229-6. [DOI] [PMC free article] [PubMed] [Google Scholar]
- Hagler D.J., Jr., Saygin A.P., Sereno M.I. Smoothing and cluster thresholding for cortical surface-based group analysis of fMRI data. NeuroImage. 2006;33(4):1093–1103. doi: 10.1016/j.neuroimage.2006.07.036. [DOI] [PMC free article] [PubMed] [Google Scholar]
- Han X. Reliability of MRI-derived measurements of human cerebral cortical thickness: the effects of field strength, scanner upgrade and manufacturer. NeuroImage. 2006;32(1):180–194. doi: 10.1016/j.neuroimage.2006.02.051. [DOI] [PubMed] [Google Scholar]
- Hayes J.P. Reduced hippocampal and amygdala activity predicts memory distortions for trauma reminders in combat-related PTSD. Journal of Psychiatric Research. 2011;45(5):660–669. doi: 10.1016/j.jpsychires.2010.10.007. [DOI] [PMC free article] [PubMed] [Google Scholar]
- Herman J.L., Perry J.C., van der Kolk B.A. Childhood trauma in borderline personality disorder. The American Journal of Psychiatry. 1989;146(4):490–495. doi: 10.1176/ajp.146.4.490. [DOI] [PubMed] [Google Scholar]
- Herringa R. Post-traumatic stress symptoms correlate with smaller subgenual cingulate, caudate, and insula volumes in unmedicated combat veterans. Psychiatry Research. 2012;203(2–3):139–145. doi: 10.1016/j.pscychresns.2012.02.005. [DOI] [PMC free article] [PubMed] [Google Scholar]
- Hoge C.W. Combat duty in Iraq and Afghanistan, mental health problems, and barriers to care. The New England Journal of Medicine. 2004;351(1):13–22. doi: 10.1056/NEJMoa040603. [DOI] [PubMed] [Google Scholar]
- Hoge C.W. Mild traumatic brain injury in U.S. Soldiers returning from Iraq. The New England Journal of Medicine. 2008;358(5):453–463. doi: 10.1056/NEJMoa072972. [DOI] [PubMed] [Google Scholar]
- Hooper L.M., Stockton P., Krupnick J.L., Green B.L. Development, use, and psychometric properties of the Trauma History Questionnaire. Journal of Loss and Trauma: International Perspectives on Stress & Coping. 2011;16(3):258–283. [Google Scholar]
- Ishibe N., Wlordarczyk R.C., Fulco C. Overview of the institute of medicine's committee search strategy and review process for Gulf War and health: long-term consequences of traumatic brain injury. The Journal of Head Trauma Rehabilitation. 2009;24(6):424–429. doi: 10.1097/HTR.0b013e3181c13426. [DOI] [PubMed] [Google Scholar]
- Johnson B.D. The use of magnetic resonance spectroscopy (1H-MRS) in the sub-acute evaluation of athletes recovering from single and multiple MTBI. Journal of Neurotrauma. 2012;29(13):2297–2304. doi: 10.1089/neu.2011.2294. [DOI] [PMC free article] [PubMed] [Google Scholar]
- Jovicich J. MRI-derived measurements of human subcortical, ventricular and intracranial brain volumes: reliability effects of scan sessions, acquisition sequences, data analyses, scanner upgrade, scanner vendors and field strengths. NeuroImage. 2009;46(1):177–192. doi: 10.1016/j.neuroimage.2009.02.010. [DOI] [PMC free article] [PubMed] [Google Scholar]
- Karl A. A meta-analysis of structural brain abnormalities in PTSD. Neuroscience and Biobehavioral Reviews. 2006;30(7):1004–1031. doi: 10.1016/j.neubiorev.2006.03.004. [DOI] [PubMed] [Google Scholar]
- Kasai K. Evidence for acquired pregenual anterior cingulate gray matter loss from a twin study of combat-related posttraumatic stress disorder. Biological Psychiatry. 2008;63(6):550–556. doi: 10.1016/j.biopsych.2007.06.022. [DOI] [PMC free article] [PubMed] [Google Scholar]
- Kashdan T.B., Breen W.E., Julian T. Everyday strivings in war veterans with posttraumatic stress disorder: suffering from a hyper-focus on avoidance and emotion regulation. Behavior Therapy. 2010;41(3):350–363. doi: 10.1016/j.beth.2009.09.003. [DOI] [PMC free article] [PubMed] [Google Scholar]
- Kerr K.M. Functional neuroanatomy of the parahippocampal region: the lateral and medial entorhinal areas. Hippocampus. 2007;17(9):697–708. doi: 10.1002/hipo.20315. [DOI] [PubMed] [Google Scholar]
- Kessler R.C. Lifetime prevalence and age-of-onset distributions of DSM-IV disorders in the National Comorbidity Survey Replication. Archives of General Psychiatry. 2005;62(6):593–602. doi: 10.1001/archpsyc.62.6.593. [DOI] [PubMed] [Google Scholar]
- Kroes M.C. Structural brain abnormalities common to posttraumatic stress disorder and depression. Journal of Psychiatry & Neuroscience. 2011;36(4):256–265. doi: 10.1503/jpn.100077. [DOI] [PMC free article] [PubMed] [Google Scholar]
- Lanius R.A. Default mode network connectivity as a predictor of post-traumatic stress disorder symptom severity in acutely traumatized subjects. Acta Psychiatrica Scandinavica. 2010;121(1):33–40. doi: 10.1111/j.1600-0447.2009.01391.x. [DOI] [PubMed] [Google Scholar]
- Liu Y. Cortical thinning in patients with recent onset post-traumatic stress disorder after a single prolonged trauma exposure. PloS One. 2012;7(6):e39025. doi: 10.1371/journal.pone.0039025. [DOI] [PMC free article] [PubMed] [Google Scholar]
- Mac Donald C.L. Detection of blast-related traumatic brain injury in U.S. military personnel. The New England Journal of Medicine. 2011;364(22):2091–2100. doi: 10.1056/NEJMoa1008069. [DOI] [PMC free article] [PubMed] [Google Scholar]
- Malloy P.F., Fairbank J.A., Keane T.M. Validation of a multimethod assessment of posttraumatic stress disorders in Vietnam veterans. Journal of Consulting and Clinical Psychology. 1983;51(4):488–494. doi: 10.1037//0022-006x.51.4.488. [DOI] [PubMed] [Google Scholar]
- Mason J.W. Urinary free-cortisol levels in posttraumatic stress disorder patients. The Journal of Nervous and Mental Disease. 1986;174(3):145–149. doi: 10.1097/00005053-198603000-00003. [DOI] [PubMed] [Google Scholar]
- Mayer A.R. Functional connectivity in mild traumatic brain injury. Human Brain Mapping. 2011;32(11):1825–1835. doi: 10.1002/hbm.21151. [DOI] [PMC free article] [PubMed] [Google Scholar]
- McEwen B.S., Seeman T. Protective and damaging effects of mediators of stress. Elaborating and testing the concepts of allostasis and allostatic load. Annals of the New York Academy of Sciences. 1999;896:30–47. doi: 10.1111/j.1749-6632.1999.tb08103.x. [DOI] [PubMed] [Google Scholar]
- Morra L., Fortier C.B., Amick M.A., Grande L.J., Milberg W.P., McGlinchey R.E. International Neuropsychological Society Annual Meeting, and Federal Interagency Conference on Traumatic Brain Injury. 2011. Assessment of mild traumatic brain injury in OEF/OIF service members: blast and lifetime TBI semi-structured interview (BLT) (Boston MA, and Washington, DC) [Google Scholar]
- Nardo D. Gray matter density in limbic and paralimbic cortices is associated with trauma load and EMDR outcome in PTSD patients. Journal of Psychiatric Research. 2010;44(7):477–485. doi: 10.1016/j.jpsychires.2009.10.014. [DOI] [PubMed] [Google Scholar]
- Raichle M.E. A default mode of brain function. Proceedings of the National Academy of Sciences of the United States of America. 2001;98(2):676–682. doi: 10.1073/pnas.98.2.676. [DOI] [PMC free article] [PubMed] [Google Scholar]
- Rubin D.C., Berntsen D., Bohni M.K. A memory-based model of posttraumatic stress disorder: evaluating basic assumptions underlying the PTSD diagnosis. Psychological Review. 2008;115(4):985–1011. doi: 10.1037/a0013397. [DOI] [PMC free article] [PubMed] [Google Scholar]
- Segonne F. A hybrid approach to the skull stripping problem in MRI. NeuroImage. 2004;22(3):1060–1075. doi: 10.1016/j.neuroimage.2004.03.032. [DOI] [PubMed] [Google Scholar]
- Segonne F., Pacheco J., Fischl B. Geometrically accurate topology-correction of cortical surfaces using nonseparating loops. IEEE Transactions on Medical Imaging. 2007;26(4):518–529. doi: 10.1109/TMI.2006.887364. [DOI] [PubMed] [Google Scholar]
- Shenton M.E. A review of magnetic resonance imaging and diffusion tensor imaging findings in mild traumatic brain injury. Brain Imaging and Behavior. 2012;6(2):137–192. doi: 10.1007/s11682-012-9156-5. [DOI] [PMC free article] [PubMed] [Google Scholar]
- Shi C.J., Cassell M.D. Perirhinal cortex projections to the amygdaloid complex and hippocampal formation in the rat. The Journal of Comparative Neurology. 1999;406(3):299–328. doi: 10.1002/(sici)1096-9861(19990412)406:3<299::aid-cne2>3.0.co;2-9. [DOI] [PubMed] [Google Scholar]
- Skinner H.A., Sheu W.J. Reliability of alcohol use indices. The Lifetime Drinking History and the MAST. Journal of Studies on Alcohol. 1982;43(11):1157–1170. doi: 10.15288/jsa.1982.43.1157. [DOI] [PubMed] [Google Scholar]
- Sled J.G., Zijdenbos A.P., Evans A.C. A nonparametric method for automatic correction of intensity nonuniformity in MRI data. IEEE Transactions on Medical Imaging. 1998;17(1):87–97. doi: 10.1109/42.668698. [DOI] [PubMed] [Google Scholar]
- Sripada R.K. Neural dysregulation in posttraumatic stress disorder: evidence for disrupted equilibrium between salience and default mode brain networks. Psychosomatic Medicine. 2012;74(9):904–911. doi: 10.1097/PSY.0b013e318273bf33. [DOI] [PMC free article] [PubMed] [Google Scholar]
- Sripada R.K. Altered resting-state amygdala functional connectivity in men with posttraumatic stress disorder. Journal of Psychiatry & Neuroscience. 2012;37(4):241–249. doi: 10.1503/jpn.110069. [DOI] [PMC free article] [PubMed] [Google Scholar]
- Stein M.B., McAllister T.W. Exploring the convergence of posttraumatic stress disorder and mild traumatic brain injury. The American Journal of Psychiatry. 2009;166(7):768–776. doi: 10.1176/appi.ajp.2009.08101604. [DOI] [PubMed] [Google Scholar]
- Tate D.F., Shenton M.E., Bigler E.D. Introduction to the brain imaging and behavior special issue on neuroimaging findings in mild traumatic brain injury. Brain Imaging and Behavior. 2012;6(2):103–107. doi: 10.1007/s11682-012-9185-0. [DOI] [PubMed] [Google Scholar]
- Tavanti M. Evidence of diffuse damage in frontal and occipital cortex in the brain of patients with post-traumatic stress disorder. Neurological Sciences. 2012;33(1):59–68. doi: 10.1007/s10072-011-0659-4. [DOI] [PubMed] [Google Scholar]
- Vasterling J.J., Verfaellie M. Introduction-posttraumatic stress disorder: a neurocognitive perspective. Journal of the International Neuropsychological Society. 2009;15(6):826–829. doi: 10.1017/S1355617709990683. [DOI] [PubMed] [Google Scholar]
- Vasterling J.J. Neuropsychological outcomes of army personnel following deployment to the Iraq War. JAMA: The Journal of the American Medical Association. 2006;296(5):519–529. doi: 10.1001/jama.296.5.519. [DOI] [PubMed] [Google Scholar]
- Whalley M.G. An fMRI investigation of posttraumatic flashbacks. Brain and Cognition. 2013;81(1):151–159. doi: 10.1016/j.bandc.2012.10.002. [DOI] [PMC free article] [PubMed] [Google Scholar]
- Woodward S.H. Decreased anterior cingulate volume in combat-related PTSD. Biological Psychiatry. 2006;59(7):582–587. doi: 10.1016/j.biopsych.2005.07.033. [DOI] [PubMed] [Google Scholar]
- Woodward S.H. Smaller global and regional cortical volume in combat-related posttraumatic stress disorder. Archives of General Psychiatry. 2009;66(12):1373–1382. doi: 10.1001/archgenpsychiatry.2009.160. [DOI] [PubMed] [Google Scholar]
- Yamasue H. Voxel-based analysis of MRI reveals anterior cingulate gray-matter volume reduction in posttraumatic stress disorder due to terrorism. Proceedings of the National Academy of Sciences of the United States of America. 2003;100(15):9039–9043. doi: 10.1073/pnas.1530467100. [DOI] [PMC free article] [PubMed] [Google Scholar]
- Yehuda R. Hippocampal volume in aging combat veterans with and without post-traumatic stress disorder: relation to risk and resilience factors. Journal of Psychiatric Research. 2007;41(5):435–445. doi: 10.1016/j.jpsychires.2005.12.002. [DOI] [PubMed] [Google Scholar]
- Zhang J. Decreased gray matter volume in the left hippocampus and bilateral calcarine cortex in coal mine flood disaster survivors with recent onset PTSD. Psychiatry Research. 2011;192(2):84–90. doi: 10.1016/j.pscychresns.2010.09.001. [DOI] [PubMed] [Google Scholar]
- Zhou Y. Default-mode network disruption in mild traumatic brain injury. Radiology. 2012;265(3):882–892. doi: 10.1148/radiol.12120748. [DOI] [PMC free article] [PubMed] [Google Scholar]
Associated Data
This section collects any data citations, data availability statements, or supplementary materials included in this article.
Supplementary Materials
Supplementary material.
A median split on age was conducted to determine whether age contributes to the effects of CLB-P seen on thickness in the LH insula ROI from Analysis 4a. Fisher's r-to-z transformation determined that the correlation between CLB-P and thickness was not significantly different between the two age groups.
A median split on CLB-P was conducted to further investigate whether age contributes to the effects of CLB-P seen on thickness across the entire cortex. In this analysis we split all 85 of our “lifetime” subjects into HIGH and LOW CLB-P groups. We then age-matched the two groups by removing individuals from each until there was a one-to-one correspondence with age between them. Our final groups each had 22 individuals, with ages in each group ranging from 25 to 58. The mean CLB-P for the LOW group was 452.67, and the mean for the HIGH group was 1687.69. We then conducted a whole-brain GLM analysis on the entire cortical surface to test for group differences between these age-matched groups. We also repeated this analysis controlling for age. Our results demonstrate group differences in the same regions where we saw effects of CLB-P on thickness in Analysis 4a, and age-controlled results looked identical. Red regions on the surface maps demonstrate where the HIGH CLB-P group had thinner cortex than the LOW CLB-P group at p < 0.05.