

Abstract
Slowed processing speed is common in elderly subjects and frequently related to cerebral small vessel disease. Previous studies have demonstrated associations between processing speed and subcortical ischemic lesions as well as cortical alterations but the precise functional–anatomical relationships remain poorly understood. Here we assessed the impact of both cortical and subcortical changes on processing speed by measuring regional cortical thickness and regional lesion volumes within distinct white-matter tracts. To limit confounding effects from age-related pathologies we studied patients with CADASIL, a genetic small vessel disease. General linear model analysis revealed significant associations between cortical thickness in the medial frontal and occipito-temporal cortex and processing speed. Bayesian network analysis showed a robust conditional dependency between the volume of lacunar lesions in the left anterior thalamic radiation and cortical thickness of the left medial frontal cortex, and between thickness of the left medial frontal cortex and processing speed, whereas there was no direct dependency between lesion volumes in the left anterior thalamic radiation and processing speed. Our results suggest that the medial frontal cortex has an intermediate position between lacunar lesions in the anterior thalamic radiation and deficits in processing speed. In contrast, we did not observe such a relationship for the occipito-temporal region. These findings reinforce the key role of frontal–subcortical circuits in cognitive impairment resulting from cerebral small vessel disease.
Abbreviations: SVD, small vessel disease; LL, lacunar lesions; WMH, white-matter hyperintensities; MFC, medial frontal cortex; OTC, occipito-temporal cortex; ATR, anterior thalamic radiation
Keywords: Cortical thickness, Lacunar lesions, Medial frontal cortex, Processing speed, Small vessel disease
Highlights
-
•
Slowed processing speed is a key feature of cerebral small vessel disease.
-
•
Processing speed correlates with cortical thickness in frontal and occipital areas.
-
•
Effects of ischemic lesions on processing speed are mediated by cortical changes.
1. Introduction
Deficits in information processing speed are common in elderly subjects (Eckert, 2011; Salthouse, 2000) and a typical feature of vascular cognitive impairment (O'Brien et al., 2003). They are frequently related to cerebral small vessel disease (SVD) (Jokinen et al., 2009; Peters et al., 2005b; Prins et al., 2005), but the mechanisms are insufficiently understood.
Studies in healthy subjects and in patients with brain injury suggest a key role of frontal–subcortical circuits in information processing speed (Alexander et al., 2007; Chui, 2007; Cummings, 1993; Eckert, 2011; Stuss, 2011). In fact, recent MR imaging studies have shown that processing speed performance correlates with various measures in the frontal lobe including white matter integrity, white matter atrophy, and sulcal span (Bartzokis et al., 2010; Kochunov et al., 2010). These findings are complemented by data demonstrating an inverse relationship between cortical thickness in frontal brain regions and speed scores (Chee et al., 2009).
Processing speed deficits in SVD have been related to the presence of ischemic lesions in brain regions harboring frontal–subcortical circuits (Chui, 2007). In support of this, a recent voxel-based MRI lesion symptom mapping study on lacunar lesions (LL) and white matter hyperintensities (WMH) identified the anterior thalamic radiation and the forceps minor as strategic white matter tracts for processing speed deficits (Duering et al., 2011). Importantly however, this study did not account for cortical alterations.
Brain atrophy is now recognized as a major predictor of cognitive decline in SVD (Jokinen et al., 2012; Prins et al., 2005). A relationship with subcortical ischemic lesions is suggested by recent data showing that incident subcortical infarcts induce cortical atrophy in connected brain regions (Duering et al., 2012). However, the interactions between subcortical lesions and cortical atrophy, and their influence on cognitive symptoms remain largely unexamined (Jouvent et al., 2012; Seo et al., 2012).
We thus set out to combine measurements of cortical thickness with quantification of both LL and WMH within major white matter tracts. We hypothesized i) that deficits in processing speed are related to cortical thinning in frontal brain regions and ii) that thinning in these regions relates to the extent of ischemic lesions in frontal white matter tracts. To assess these relationships we used graph-based methods. To minimize potential confounding by unrecognized neurodegenerative disease we studied patients with CADASIL, an early-onset condition causing pure SVD (Chabriat et al., 2009; Peters et al., 2004).
2. Methods
2.1. Study cohort and neuropsychological testing
313 consecutive CADASIL patients from a two-center study (Klinikum Großhadern, University of Munich, Germany, and Centre Hospitalier Universitaire (CHU) Lariboisière, Paris, France) were evaluated for inclusion. In all subjects, the diagnosis was confirmed either by skin biopsy or genetic testing (Joutel et al., 1997; Peters et al., 2005a).
Patients were excluded from the study for the following reasons: territorial infarctions (n = 3), insufficient quality of T1-weighted images or problems with cortical surface analyses due to subcortical white-matter hyperintensities directly underneath the cortex (n = 150), missing data on neuropsychological measures (n = 13), or a combination of these reasons (n = 49). The final study sample included 98 patients (Table 1). Patients in the final sample were younger (t = 7.34, p < 0.001), had smaller volumes of LL (t = 2.87, p < 0.005) and WMH (t = 8.23, p < 0.001), and a larger brain parenchymal fraction, which is the total brain volume divided by the intracranial cavity (t = 2.93, p < 0.005).
Table 1.
Characteristics of the study sample (n = 98).
| Demographic characteristics | Included (N = 98) | Excluded (N = 215) | Significance |
|---|---|---|---|
| Age, mean (SD, range) | 43.7 (9.6, 22–67) | 53.1 (10.8, 24–77) | p < 0.001 |
| Male sex, n (%) | 38 (38) | 105 (49) | ns |
| Vascular risk factors, n (%) | |||
| Current smoker | 25 (26) | 35 (16) | ns |
| Smoking history | 33 (33) | 67 (31) | ns |
| Hypertension | 19 (19) | 42 (20) | ns |
| Hypercholesterolemia | 25 (26) | 91 (42) | p < 0.01 |
| Diabetes | 4 (4) | 3 (1) | ns |
| Clinical scores, median (IQR) | |||
| Mattis Dementia Rating Scale | 142 (4) | 139 (16.25) | p < 0.001 |
| Modified Rankin scale | 0 (0.8) | 1 (2) | ns |
| Barthel index | 100 (0) | 100 (5) | ns |
| Imaging characteristics, mean (SD) [%] | |||
| Normalized LL volume | 0.0164 (0.0315) | 0.0346 (0.0588) | p < 0.01 |
| Normalized WMH volume | 4.14 (2.69) | 8.82 (5.28) | p < 0.001 |
| Brain parenchymal fraction | 83.7 (4.91) | 81.4 (5.86) | p < 0.01 |
IQR = interquartile range, LL = lacunar lesion, WMH = white matter hyperintensities.
Comparisons between the included and excluded samples were performed by chi-square statistics for categorical variables and t-test statistics for continuous variables.
Cognitive testing included the Mattis Dementia Rating Scale (Schmidt et al., 1994) as a global measure for cognitive performance across multiple cognitive areas. Processing speed was determined using a compound score derived from principle component analysis as previously described (Duering et al., 2011). This score included the timed measures of TMT-A, TMT-B and the block design test. Raw test scores were transformed into age- and education corrected Z-scores based on normative data from healthy subjects (Tombaugh, 2004; Troyer, 2000; Van der Linen et al., 1993; Wechsler, 2006). The mean of these three Z-scores formed the processing speed compound Z score.
2.2. Acquisition of MR images
MRI scans were performed on 1.5 Tesla systems: Siemens Vision (Munich) and General Electric Medical Systems Signa (Paris and Munich). Sequence parameters for the 3D T1 and fluid-attenuated inversion recovery protocols have previously been published (Jouvent et al., 2007) (Supplementary Table A.1).
2.3. Cortical thickness
Surface-based cortical analyses were performed using Freesurfer 5.0.0 (Fischl and Dale, 2000) (http://surfer.nmr.mgh.harvard.edu). Cortical thickness measures by Freesurfer have been validated against autopsy findings (Rosas et al., 2002) and manual measurements (Salat et al., 2004). Using a surface-based protocol, region-specific atrophy has been shown in various patient populations including small-vessel disease (de Laat et al., 2012), multiple sclerosis (Sailer et al., 2003) and neurodegenerative disease (Dickerson et al., 2009; Du et al., 2007; Rosas et al., 2002).
Surface-based analyses in Freesurfer involved the removal of non-brain tissue using a hybrid watershed algorithm, automated Talairach transformation, segmentation of subcortical white and gray matter, intensity normalization, tessellation of gray/white-matter boundary, automated correction of topological defects, and surface deformation to form the gray and white-matter boundary (Dale et al., 1999). Cortical thickness was determined as the difference between the pial and white-matter surface (Fischl and Dale, 2000).
Cortical segmentations were manually inspected for errors and we used the manual edits as provided in Freesurfer to resolve these errors. Dura was removed manually and control points were used to solve problems in intensity normalization. Lesion filling was used for WMH and LL. In many patients the WMH affected the white–gray matter interface and therefore the border between lesion and white–gray matter interface was not always clear, possibly also due to limitations in the imaging parameters. Lesion filling was therefore in these cases not a solution. Since in many cases the insula and temporal cortex were affected with WMH (Auer et al., 2001; Chabriat et al., 2009), which resulted in cortical segmentation problems, we decided to remove these regions from the analysis in all patients. In the temporal region cortical segmentation was in addition hard because of signal drop-out. For the insula it was hard to reconstruct the white-matter surface since the white-matter adjacent to the claustrum is very thin. The boundaries for these regions were determined by using the Desikan–Killiany parcellation atlas as provided in Freesurfer (Desikan et al., 2006). If extensive errors were observed in one or more areas across the cortex (apart from the removed insula and temporal poles), and these errors could not be resolved, we decided to remove the subject from analysis.
The surface of the gray–white matter border was inflated and smoothed across the surface with a Gaussian smoothing kernel using a full width at half maximum of 10 mm. Single patient data were registered to an average spherical surface representation in Freesurfer (fsaverage), which is an average surface template of 40 subjects, optimally aligning sulcal and gyral features of the brain.
2.4. Regional cortical surface analyses
A hypothesis-free vertex-based General Linear Model (GLM) approach of the entire cerebrum was applied for analyzing relations between processing speed and regional cortical thickness using mri_glmfit in Freesurfer. Cortical thickness was (i) validated by comparison with existing literature on regional cortical patterns related to gender and age, and (ii) compared with reported rates of age-related atrophy. The relationship between age and mean global cortical thickness was estimated using univariate linear regression analysis.
Correlations between cortical thickness and speed compound scores were analyzed while correcting for age, gender, total WMH volume, total LL volume, and study center, using mri_glmfit. Significance was set to p < 0.001 without correction for multiple comparisons (Burzynska et al., 2012; Du et al., 2007; Espeseth et al., 2008). Correction for multiple comparisons was not used as it may be overly conservative and result in type II errors (Perneger, 1998). However, increased age-related thinning that was observed across the cortical mantle for CADASIL patients provided further justification for performing regional cortical thickness analyses using uncorrected p-values (Reiss et al., 2012).
Standardized β-values and adjusted R-square values for significant clusters are reported. Robustness of regional effects was tested by splitting the sample in two equally sized groups (split-half analysis) while allotting subjects alternately (Engvig et al., 2010; Espeseth et al., 2008). Regions of interest (ROIs), which were found to be robust in split-half analysis, were created on the Freesurfer average spherical cortical surface (fsaverage). Cortical thickness values within these ROIs were derived for every individual subject and used in Bayesian network analysis (see below).
2.5. Regional lesion loads in white-matter fibers
To investigate whether the regional volumes of WMH and LL in major white-matter tracts were related to regional cortical thinning, lesion maps were generated using 2D and 3D image editing tools provided by BioClinica SAS. LL maps were created using a published protocol (Viswanathan et al., 2007). Hypointense lesions on the T1-weighted images with a signal identical to CSF, sharp delineation and a diameter > 2 mm were segmented as LL. Lesions hyperintense on fluid-attenuated inversion recovery images were labeled WMH (Duering et al., 2011).
Regional lesion load in major white-matter tracts were determined using a probabilistic white-matter tract atlas of the John Hopkins University (JHU) (Hua et al., 2008) (Supplementary Fig. A.1). The atlas is provided in Montreal Neurological Institute (MNI) 152 standard space within the FMRIB software library (Smith et al., 2004). The normalization procedure to MNI 152 standard space involved tools from the FMRIB Software Library (FSL) (Smith et al., 2004; Woolrich et al., 2009) and lesion masking (Brett et al., 2001) and has been previously described (Duering et al., 2011): For registration to standard space, a lesion masking approach was applied to enhance registration quality and to better preserve anatomical structures. Cost-function masks were created by subtracting lesion maps from brain masks in T1 space. Linear and non-linear registration of T1 images were done with standard parameters to a 1 mm MNI 152 template. Rigorous quality checks were done at all steps by superimposing results onto the target image. Where needed, parameters were adjusted to optimize the registration process. Patients were removed because of pronounced image distortion due to atrophy. Registration to MNI space was therefore not possible for 7 patients and these were removed. These patients were not mentioned in the exclusion criteria since they were only excluded from the lesion volume analyses but not from the other analyses.
To account for inaccuracies during normalization and for inter-individual variations in white-matter tracts we used a probabilistic approach as previously described (Duering et al., 2013). Regional volumes for both LL and WHM volume were determined separately for all 20 tracts represented in the John Hopkins University atlas (Hua et al., 2008).
2.6. Bayesian network analysis
To investigate the relationship between regional lesion load in distinct white-matter tracts, regional cortical thinning and processing speed we performed Bayesian network analysis. Bayesian networks capture complex multivariate associations by analyzing probabilistic relations between variables (Duering et al., 2013; Herskovits and Gerring, 2003). In this study analyses were limited to relations between variables. Directionality was not assessed because of the small sample size.
Statistical analysis was conducted with the R software package (version 2.13.2). We analyzed Bayesian networks of conditional dependencies between regional lesion volumes in individual white-matter tracts and cortical thickness in the regions-of-interest (ROIs) of the medial frontal cortex (MFC) and occipito-temporal cortex (OTC). Age and gender were included in the model. All continuous variables were standardized and Gaussian linear Bayesian network analysis was implemented using the bnlearn R package (version 2.9). In order to limit analyses to biologically relevant structure–function relations, age and gender were determined as independent variables and processing speed as a dependent variable.
To test the robustness of the network to sampling variability, a bootstrap approach was used. The strength of each connection (arc) was calculated as a relative frequency in 3000 networks obtained through resampling. A reasonable level of confidence can be assumed at a frequency of 50% or higher (Duering et al., 2013).
3. Results
Demographic, clinical, and imaging characteristics of the study cohort are provided in Table 1. Eighty-six (88%) subjects had clinical manifestations of CADASIL. The mean Mattis Dementia rating scale (MDRS) score was 140.5, with six (6.1%) subjects having a score below or equal to the usual cut-off for dementia (≤ 130) (Schmidt et al., 1994). Sixty-one (62%) subjects had LL whereas WMH were present in all study participants (100%).
3.1. Effects of age and gender on cortical thickness
Because of the reported effects of age and gender on cortical thickness in other populations we first assessed their influence in the current CADASIL cohort. Overall there was a decrease in cortical thickness of about 0.04 mm per decade [left hemisphere: β = − 0.00400, p < 0.001, adjusted R2 = 0.12; right hemisphere: β = − 0.00365, p < 0.005, adjusted R2 = 0.09], which is roughly twice the reported age-related atrophy in healthy subjects (Salat et al., 2004). In GLM analyses higher age was associated with thinning particularly in the prefrontal cortex and the supramarginal cortex (Fig. 1A) consistent with the pattern observed in other populations (Good et al., 2001; Raz et al., 1997; Reid et al., 2010; Salat et al., 2004).
Fig. 1.
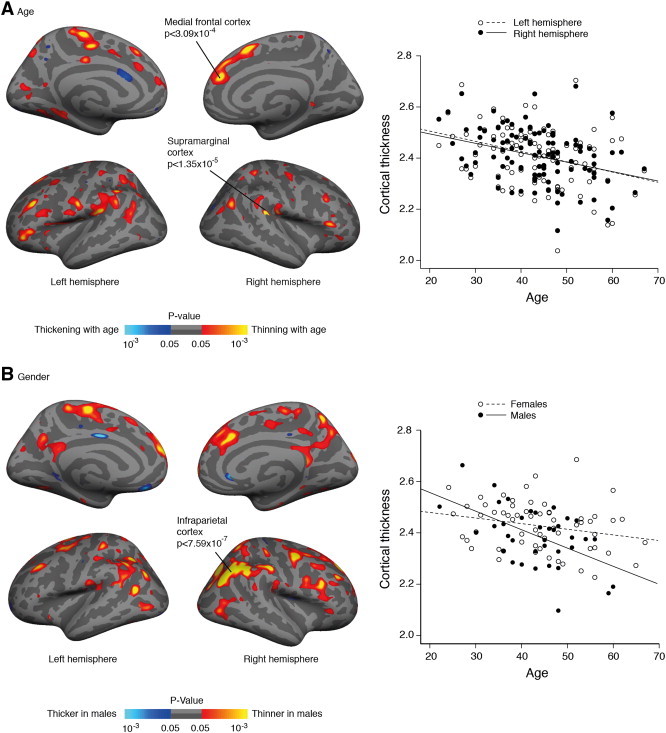
Cortical surface maps displaying a significant correlation between A) age and cortical thickness and B) gender and cortical thickness. Scatterplots represent the average cortical thickness in each hemisphere (in A) or across the whole mantle (in B). Maps are shown on an inflated standard brain in Freesurfer. For display purposes significant cortical regions are shown with a value of p < 0.05.
Male subjects had lower cortical thickness than female subjects, though the differences were not significant across the whole cortical mantle, t(96) = 1.83, p = 0.070 (resp. M = 2.38 mm, SD = 0.12 and M = 2.42 mm, SD = 0.10). GLM analyses with gender showed that male subjects had thinner cortex than female subjects in several brain regions, particularly in the inferior parietal cortex (Fig. 1B), which is consistent with other work (Sowell et al., 2007). The decline in cortical thickness with increasing age was steeper in male subjects [whole cortex: β = − 0.00747, p < 0.001, adjusted R2 = 0.25] as compared with female subjects [whole cortex: β = − 0.00242, p < 0.05, adjusted R2 = 0.05], which is in line with whole brain atrophy rates observed in CADASIL (Gunda et al., 2012).
3.2. Relationship between subcortical ischemic lesions and cortical thickness
Next we determined the relationship between the volume of subcortical ischemic lesions in the whole brain and mean cortical thickness across the whole cortex. After correction for age, gender and study center, cortical thickness correlated with both the LL volume [r = − 0.262, p < 0.05] and the WMH volume [r = − 0.320, p < 0.005], suggesting a reduction in cortical thickness with higher volumes of subcortical ischemic lesions.
3.3. Relationship between global MR measures and processing speed
We then determined correlations between global MR measures and processing speed, while correcting for age, gender and study center. There was no significant correlation between LL volume and processing speed [r = − 0.01, p = 0.97], whereas WMH volume correlated significantly with processing speed [r = − 0.25, p < 0.05]. The results were similar but the correlation for WMH was stronger for the subjects that were excluded from analysis [resp. r = − 0.01, p = 0.89 and r = − 0.37, p < 0.001]. There was no significant correlation between cortical thickness across the whole cortical mantle and processing speed [r = 0.11, p = 0.31].
3.4. Relationship between regional cortical thickness and processing speed
To address our main question, we next investigated the relationship between regional cortical thickness and processing speed. GLM analyses controlling for age, gender, study center, total WMH volume, and total LL volume revealed several clusters of a significant association between cortical thickness and processing speed. Lower cortical thickness values in these areas were associated with slower processing speed across subjects. The clusters were located in the medial frontal cortex (MFC), the superior parietal cortex and the occipito-temporal cortex (OTC) (Fig. 2 and Table 2). The latter cluster included the lingual cortex, the fusiform cortex and the parahippocampal cortex with the peak of the cluster situated in the collateral sulcus. Split half analyses confirmed a significant relation between processing speed and cortical thickness in the MFC and OTC in both samples, whereas this was not the case for the superior parietal cortex.
Fig. 2.
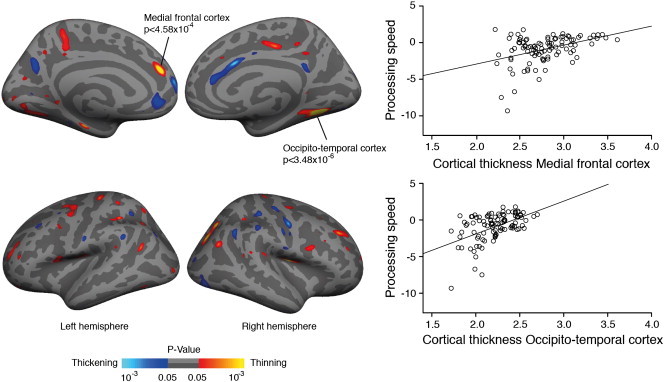
Cortical surface maps showing significant correlations between cortical thickness and processing speed (compound Z score). Cortical thinning in the left medial frontal cortex and right occipito-temporal cortex were related to deficits in processing speed. For display purposes cortical regions with a value of p < 0.05 are shown.
Table 2.
Cortical regions showing a significant relationship between cortical thickness and processing speed.
| Region | Cluster size (mm2) |
Adjusted R2 | Standardized Beta | Peak p-value |
|---|---|---|---|---|
| L medial frontal cortex | 202 | 0.148 | 0.396 | 4.58 × 10− 4 |
| R occipito-temporal cortex | 558 | 0.246 | 0.504 | 3.48 × 10− 6 |
| R superior parietal cortex | 363 | 0.088 | 0.311 | 5.73 × 10− 4 |
3.5. Relationship between subcortical ischemic lesions, regional cortical thinning and processing speed
To investigate how subcortical ischemic lesions in major white matter tracts and changes in cortical thickness in the MFC and OTC act together in determining deficits in processing speed we applied Bayesian network analysis. This was done by adding the regional volumes of LL and WMH within 20 major white matter tracts (Supplementary Fig. A.1). The results showed a conditional dependency between LL volume in the left anterior thalamic radiation (ATR) and cortical thinning in the left MFC (Fig. 3, Supplementary Fig. A.2, and Supplementary Table A.2). Of note, however, there was no direct relationship between LL in the left ATR and processing speed. In fact, the network shows that the left MFC has an intermediate position between LL in the left ATR and deficits in processing speed, while this was not observed for the OTC. Age and gender showed no significant dependency with processing speed, nor did they show a conditional dependency with cortical thickness in the regions of interest nor with LL in the ATR.
Fig. 3.
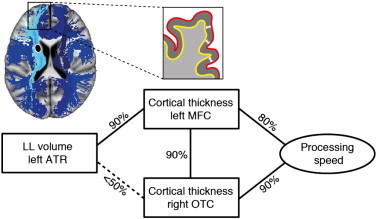
Bayesian network analysis. Robust association between the regional volume of lacunar lesions (LL) in the left anterior thalamic radiation (ATR) and cortical thickness in the left medial frontal cortex (MFC). The network suggests an intermediate role for cortical thinning in the MFC between LL in the ATR and deficits in processing speed, whereas this is not the case for the occipito-temporal cortex. Left upper corner: Illustration of the anatomical relationship between the ATR (in light blue) and the MFC. Other major white-matter tracts are shown in dark blue. The black filled ovoid depicts a lacunar lesion. Zoomed-in is a schematic representation of cortical thickness measures in the MFC; OCT = occipito-temporal cortex.
Post-hoc correlational analysis of the relationship between LL volume in the left ATR and left MFC, after correction for age, gender and study center showed a significant correlation, r = − 0.28, p < 0.01.
4. Discussion
In the current study we performed global and regional measurements of cortical thickness in patients with pure SVD and assessed their relationship with both processing speed and subcortical ischemic lesions. Overall, there was an age-related decline in cortical thickness with a pattern similar to normal aging but with a seemingly steeper slope. The key findings of this study are that i) deficits in processing speed are associated with regional thinning in the left MFC and right OTC, and that ii) thinning in the left MFC has a position in between the volume of LL in the anterior thalamic radiation and slowed processing. No direct relations were observed between lesion load in the anterior thalamic radiation and processing speed. These results have major implications for the understanding of cognitive impairment in patients with cerebral SVD.
To our knowledge, this is the first study showing that regional cortical thinning in the MFC is associated with slowed processing. The MFC fulfills an important role in performance monitoring by signaling the need for response adjustment (Ridderinkhof et al., 2004). It is further involved in “energization”, the process of initiating and sustaining a response (Stuss, 2011). In accord with this, patients with extensive damage in the MFC have been shown to be slow on error correction (Modirrousta and Fellows, 2008) and reaction time tasks (Alexander et al., 2007; Stuss, 2011). Thus, our findings agree with what is known about the MFC and its role in executive function. They further extend on these earlier findings by establishing a link between cortical thinning and processing speed in SVD.
The observed association between thinning in the OTC and deficits in processing speed was rather unexpected. Previous work found a relation between the volume of gray matter in the right lingual cortex (which is partly represented in the OTC cluster) and processing speed in normal aging elderly, although this relation disappeared after correction for age (Chee et al., 2009). Functional neuroimaging studies (fMRI/PET) have shown that the OTC is significantly activated during visual reaction time tasks (Mohamed et al., 2004; Naito et al., 2000), which would agree with an involvement of this region in processing speed tasks. However, additional studies are needed to better understand these findings.
There are at least two potential mechanisms for cortical thinning in SVD: direct damage to the cortex, e.g. by microscopic infarcts, or secondary cortical degeneration following subcortical ischemic lesions in connected white matter. A relationship between microscopic infarcts and brain atrophy has been demonstrated in neuropathological samples from the Honolulu Asia Aging Autopsy Study (Launer et al., 2011). The current imaging protocol precluded the identification of cortical microinfarcts, thus leaving direct damage to the cortex as a possible component (Jouvent et al., 2011). However, this would not explain the observed conditional dependency between cortical thinning in the left MFC and the regional volume of LL in the left anterior thalamic radiation disclosed by the graph-based analysis.
A more likely mechanism is secondary neurodegeneration (Siffrin et al., 2010). Cortical alterations may follow from subcortical ischemic lesions because of a disruption of connecting fiber tracts. In fact, by combining fiber tracking and cortical thickness measurements in CADASIL patients we recently showed that incident LL in the subcortical white-matter causes focal thinning in connected cortical areas (Duering et al., 2012). The present study highlights a relationship between LL in the left anterior thalamic radiation and cortical thinning in the left MFC. The plausibility of this relationship is substantiated by the fact that the anterior thalamic radiation has major connections with the MFC, as documented by human diffusion tractography (Behrens et al., 2003; Hua et al., 2008; Klein et al., 2010; Wakana et al., 2004) and animal tracer studies (Giguere and Goldman-Rakic, 1988; Ray and Price, 1993). Potential mechanisms underlying secondary cortical atrophy include retrograde degeneration as well as anterograde transsynaptic degeneration (Siffrin et al., 2010). The current study did not allow differentiating between these mechanisms but suggests that the consequences are clinically relevant.
Interestingly, we found no direct relationship between LL volume in the anterior thalamic radiation and processing speed in our Bayesian models. This contrasts with our previous work in which we used voxel-based methods to identify strategic locations for subcortical ischemic lesions and processing speed (Duering et al., 2011, 2013). Importantly, however, cortical morphology was not considered in these studies. In conjunction with our earlier results, the current study, which accounted for both subcortical ischemic lesions and cortical morphology, suggests that cortical thinning in the left MFC has an intermediate position between LL volume in the left ATR and deficits in processing speed (Fig. 3).
Our findings broadly agree with those from a recent study that found ischemic lesions in the periventricular white matter to be associated with both frontal cortical thinning and executive dysfunction (Seo et al., 2012). However, there are several methodological differences between that study and the current work. First, the study by Seo et al. assessed global executive functions (phonemic fluency and color-reading task) rather than processing speed. Second, their study did not account for lacunar lesions or lesions in specific white matter tracts but instead differentiated between deep and periventricular white matter. Finally, their study included patients with various diagnoses with the majority being diagnosed as Alzheimer's disease. Notwithstanding these methodological differences, the present work in conjunction with the study by Seo et al. implies an important role of white-matter pathology in frontal cortical thinning and executive dysfunctions in cerebral SVD.
The current study has several methodological strengths: First, patients were drawn from a well-characterized sample of subjects with genetically defined SVD. Second, because of the relatively young age of our patients, confounding age-related pathologies including neurodegenerative pathology are unlikely (Chabriat et al., 2009; Peters et al., 2004). This is particularly important when studying cortical morphology since neurodegenerative pathology is common in aging subjects and associated with cortical thinning (Dickerson et al., 2009). Third, we applied graph-based methods, which allowed analyzing multivariate relationships between regional lesion volumes in multiple white-matter tracts and cortical thickness while accounting for collinearity. Finally, robustness of the multivariate relations was confirmed by using a large number of bootstrap resamplings.
Several limitations should be noted. A considerable number of patients could not be analyzed because of difficulties with performing cortical surface measurements in the presence of extensive subcortical WMH. Reliable cortical thickness analyses were not possible in the insula and temporal lobe and therefore these regions were removed from analysis. While this might have affected the results, the removal of patients with high lesion volumes and pronounced atrophy would be expected to result in an under- rather than overestimation of effect sizes. Therefore, with the current sample there is a possibility that more extensive cortical atrophy was missed. Indeed, the correlational analysis suggests that overall thickness declines with increasing lesion load. Another limitation of the current study is the lack of an own control group with an identical scanning protocol.
In summary, this study demonstrates an association between slowed information processing and regional cortical thinning in the MFC and OTC in patients with pure SVD. Our findings extend on earlier results (Duering et al., 2011) by showing that regional thinning of the MFC has an intermediate role between lacunar lesions in the ATR and deficits in processing speed. Together, these findings reinforce the key role of frontal-subcortical circuits in cognitive impairment resulting from cerebral SVD. Longitudinal studies are now needed to examine the temporal relationship between vascular injury to specific white matter tracts, the emergence of regional cortical thinning in connected brain regions, and cognitive decline.
Acknowledgements
This work was supported by the Vascular Dementia Research Foundation, the German Center for Neurodegenerative Diseases (DZNE), FP6 ERA-NET NEURON grant (01 EW1207 to MD and HC), PHRC grant AOR 02-001 (DRC/APHP) and ARNEVA (Association de Recherche en Neurologie Vasculaire).
Footnotes
This is an open-access article distributed under the terms of the Creative Commons Attribution-NonCommercial-ShareAlike License, which permits non-commercial use, distribution, and reproduction in any medium, provided the original author and source are credited.
Appendix A. Supplementary data
Supplementary materials.
References
- Alexander M.P., Stuss D.T., Picton T., Shallice T., Gillingham S. Regional frontal injuries cause distinct impairments in cognitive control. Neurology. 2007;68:1515–1523. doi: 10.1212/01.wnl.0000261482.99569.fb. [DOI] [PubMed] [Google Scholar]
- Auer D.P., Pütz B., Gössl C., Elbel G.-K., Gasser T., Dichgans M. Differential lesion patterns in CADASIL and sporadic subcortical arteriosclerotic encephalopathy: MR imaging study with statistical parametric group comparison. Radiology. 2001;218:443–451. doi: 10.1148/radiology.218.2.r01fe24443. [DOI] [PubMed] [Google Scholar]
- Bartzokis G., Lu P.H., Tingus K., Mendez M.F., Richard A., Peters D.G., Oluwadara B., Barrall K.A., Finn J.P., Villablanca P., Thompson P.M., Mintz J. Lifespan trajectory of myelin integrity and maximum motor speed. Neurobiology of Aging. 2010;31:1554–1562. doi: 10.1016/j.neurobiolaging.2008.08.015. [DOI] [PMC free article] [PubMed] [Google Scholar]
- Behrens T.E., Johansen-Berg H., Woolrich M.W., Smith S.M., Wheeler-Kingshott C.A., Boulby P.A., Barker G.J., Sillery E.L., Sheehan K., Ciccarelli O., Thompson A.J., Brady J.M., Matthews P.M. Non-invasive mapping of connections between human thalamus and cortex using diffusion imaging. Nature Neuroscience. 2003;6:750–757. doi: 10.1038/nn1075. [DOI] [PubMed] [Google Scholar]
- Brett M., Leff A.P., Rorden C., Ashburner J. Spatial normalization of brain images with focal lesions using cost function masking. NeuroImage. 2001;14:486–500. doi: 10.1006/nimg.2001.0845. [DOI] [PubMed] [Google Scholar]
- Burzynska A.Z., Nagel I.E., Preuschhof C., Gluth S., Bäckman L., Li S.C., Lindenberger U., Heekeren H.R. Cortical thickness is linked to executive functioning in adulthood and aging. Human Brain Mapping. 2012;33:1607–1620. doi: 10.1002/hbm.21311. [DOI] [PMC free article] [PubMed] [Google Scholar]
- Chabriat H., Joutel A., Dichgans M., Tournier-Lasserve E., Bousser M. CADASIL. Lancet Neurology. 2009;8:643–653. doi: 10.1016/S1474-4422(09)70127-9. [DOI] [PubMed] [Google Scholar]
- Chee M.W., Chen K.H., Zheng H., Chan K.P., Isaac V., Sim S.K., Chuah L.Y., Schuchinsky M., Fischl B., Ng T.P. Cognitive function and brain structure correlations in healthy elderly east Asians. NeuroImage. 2009;46:257–269. doi: 10.1016/j.neuroimage.2009.01.036. [DOI] [PubMed] [Google Scholar]
- Chui H.C. Subcortical ischemic vascular dementia. Neurologic Clinics. 2007;25:717–740. doi: 10.1016/j.ncl.2007.04.003. [DOI] [PMC free article] [PubMed] [Google Scholar]
- Cummings J.L. Frontal-subcortical circuits and human behavior. Archives of Neurology. 1993;50:873–880. doi: 10.1001/archneur.1993.00540080076020. [DOI] [PubMed] [Google Scholar]
- Dale A.M., Fischl B., Sereno M.I. Cortical surface-based analysis. I. Segmentation and surface reconstruction. NeuroImage. 1999;9:179–194. doi: 10.1006/nimg.1998.0395. [DOI] [PubMed] [Google Scholar]
- de Laat K.F., Reid A.T., Grim D.C., Evans A.C., Kötter R., van Norden A.G., de Leeuw F.E. Cortical thickness is associated with gait disturbances in cerebral small vessel disease. NeuroImage. 2012;59:1478–1484. doi: 10.1016/j.neuroimage.2011.08.005. [DOI] [PubMed] [Google Scholar]
- Desikan R.S., Ségonne F., Fischl B., Quinn B.T., Dickerson B.C., Blacker D., Buckner R.L., Dale A.M., Maguire R.P., Hyman B.T., Albert M.S., Killiany R.J. An automatic labeling system for subdividing the human cerebral cortex on MRI scans into gyral based regions of interest. NeuroImage. 2006;31:968–980. doi: 10.1016/j.neuroimage.2006.01.021. [DOI] [PubMed] [Google Scholar]
- Dickerson B.C., Bakkour A., Salat D.H., Feczko E., Pacheco J., Greve D.N., Grodstein F., Wright C.I., Blacker D., Rosas H.D., Sperling R.A., Atri A., Growdon J.H., Hyman B.T., Morris J.C., Fischl B., Buckner R.L. The cortical signature of Alzheimer's disease: regionally specific cortical thinning relates to symptom severity in very mild to mild AD dementia and is detectable in asymptomatic amyloid-positive individuals. Cerebral Cortex. 2009;19:497–510. doi: 10.1093/cercor/bhn113. [DOI] [PMC free article] [PubMed] [Google Scholar]
- Du A.T., Schuff N., Kramer J.H., Rosen H.J., Gorno-Tempini M.L., Rankin K., Miller B.L., Weiner M.W. Different regional patterns of cortical thinning in Alzheimer's disease and frontotemporal dementia. Brain. 2007;130:1159–1166. doi: 10.1093/brain/awm016. [DOI] [PMC free article] [PubMed] [Google Scholar]
- Duering M., Zieren N., Herve D., Jouvent E., Reyes S., Peters N., Pachai C., Opherk C., Chabriat H., Dichgans M. Strategic role of frontal white matter tracts in vascular cognitive impairment: a voxel-based lesion-symptom mapping study in CADASIL. Brain. 2011;134:2366–2375. doi: 10.1093/brain/awr169. [DOI] [PubMed] [Google Scholar]
- Duering M., Righart R., Csanadi E., Jouvent E., Herve D., Chabriat H., Dichgans M. Incident subcortical infarcts induce focal thinning in connected cortical regions. Neurology. 2012;79:2025–2028. doi: 10.1212/WNL.0b013e3182749f39. [DOI] [PubMed] [Google Scholar]
- Duering M., Gonik M., Malik R., Zieren N., Reyes S., Jouvent E., Hervé D., Gschwendtner A., Opherk C., Chabriat H., Dichgans M. Identification of a strategic brain network underlying processing speed deficits in vascular cognitive impairment. NeuroImage. 2013;66:177–183. doi: 10.1016/j.neuroimage.2012.10.084. [DOI] [PubMed] [Google Scholar]
- Eckert M.A. Slowing down: age-related neurobiological predictors of processing speed. Frontiers in Neuroscience. 2011;5:1–13. doi: 10.3389/fnins.2011.00025. [DOI] [PMC free article] [PubMed] [Google Scholar]
- Engvig A., Fjell A.M., Westlye L.T., Moberget T., Sundseth O., Larsen V.A., Walhovd K.B. Effects of memory training on cortical thickness in the elderly. NeuroImage. 2010;52:1667–1676. doi: 10.1016/j.neuroimage.2010.05.041. [DOI] [PubMed] [Google Scholar]
- Espeseth T., Westlye L.T., Fjell A.M., Walhovd K.B., Rootwelt H., Reinvang I. Accelerated age-related cortical thinning in healthy carriers of apolipoprotein E epsilon 4. Neurobiology of Aging. 2008;29:329–340. doi: 10.1016/j.neurobiolaging.2006.10.030. [DOI] [PubMed] [Google Scholar]
- Fischl B., Dale A.M. Measuring the thickness of the human cerebral cortex from magnetic resonance images. Proceedings of the National Academy of Sciences of the United States of America. 2000;97:11050–11055. doi: 10.1073/pnas.200033797. [DOI] [PMC free article] [PubMed] [Google Scholar]
- Giguere M., Goldman-Rakic P.S. Mediodorsal nucleus: areal, laminar, and tangential distribution of afferents and efferents in the frontal lobe of rhesus monkeys. The Journal of Comparative Neurology. 1988;277:195–213. doi: 10.1002/cne.902770204. [DOI] [PubMed] [Google Scholar]
- Good C.D., Johnsrude I.S., Ashburner J., Henson R.N., Friston K.J., Frackowiak R.S. A voxel-based morphometric study of ageing in 465 normal adult human brains. NeuroImage. 2001;14:21–36. doi: 10.1006/nimg.2001.0786. [DOI] [PubMed] [Google Scholar]
- Gunda B., Herve D., Godin O., Bruno M., Reyes S., Alili N., Opherk C., Jouvent E., Düring M., Bousser M.G., Dichgans M., Chabriat H. Effects of gender on the phenotype of CADASIL. Stroke. 2012;43:137–141. doi: 10.1161/STROKEAHA.111.631028. [DOI] [PubMed] [Google Scholar]
- Herskovits E.H., Gerring J.P. Application of a data-mining method based on Bayesian networks to lesion-deficit analysis. NeuroImage. 2003;19:1664–1673. doi: 10.1016/s1053-8119(03)00231-3. [DOI] [PubMed] [Google Scholar]
- Hua K., Zhang J., Wakana S., Jiang H., Li X., Reich D.S., Calabresi P.A., Pekar J.J., van Zijl P.C., Mori S. Tract probability maps in stereotaxic spaces: analyses of white matter anatomy and tract-specific quantification. NeuroImage. 2008;39:336–347. doi: 10.1016/j.neuroimage.2007.07.053. [DOI] [PMC free article] [PubMed] [Google Scholar]
- Jokinen H., Kalska H., Ylikoski R., Madureira S., Verdelho A., van der Flier W.M., Scheltens P., Barkhof F., Visser M.C., Fazekas F., Schmidt R., O'Brien J., Waldemar G., Wallin A., Chabriat H., Pantoni L., Inzitari D., Erkinjuntti T. Longitudinal cognitive decline in subcortical ischemic vascular disease — the LADIS Study. Cerebrovascular Diseases. 2009;27:384–391. doi: 10.1159/000207442. [DOI] [PubMed] [Google Scholar]
- Jokinen H., Lipsanen J., Schmidt R., Fazekas F., Gouw A.A., van der Flier W.M., Barkhof F., Madureira S., Verdelho A., Ferro J.M., Wallin A., Pantoni L., Inzitari D., Erkinjuntti T. Brain atrophy accelerates cognitive decline in cerebral small vessel disease: The LADIS study. Neurology. 2012;78:1785–1792. doi: 10.1212/WNL.0b013e3182583070. [DOI] [PubMed] [Google Scholar]
- Joutel A., Vahedi K., Corpechot C., Troesch A., Chabriat H., Vayssiere C., Cruaud C., Maciazek J., Weissenbach J., Bousser M.G., Bach J.F., Tournier-Lasserve E. Strong clustering and stereotyped nature of Notch3 mutations in CADASIL patients. Lancet. 1997;350:1511–1515. doi: 10.1016/S0140-6736(97)08083-5. [DOI] [PubMed] [Google Scholar]
- Jouvent E., Viswanathan A., Mangin J.F., O'Sullivan M., Guichard J.P., Gschwendtner A., Cumurciuc R., Buffon F., Peters N., Pachai C., Bousser M.G., Dichgans M., Chabriat H. Brain atrophy is related to lacunar lesions and tissue microstructural changes in CADASIL. Stroke. 2007;38:1786–1790. doi: 10.1161/STROKEAHA.106.478263. [DOI] [PubMed] [Google Scholar]
- Jouvent E., Poupon C., Gray F., Paquet C., Mangin J.F., Le Bihan D., Chabriat H. Intracortical infarcts in small vessel disease: a combined 7-T postmortem MRI and neuropathological case study in cerebral autosomal-dominant arteriopathy with subcortical infarcts and leukoencephalopathy. Stroke. 2011;42:e27–e30. doi: 10.1161/STROKEAHA.110.594218. [DOI] [PubMed] [Google Scholar]
- Jouvent E., Mangin J.F., Duchesnay E., Porcher R., Düring M., Mewald Y., Guichard J.P., Herve D., Reyes S., Zieren N., Dichgans M., Chabriat H. Longitudinal changes of cortical morphology in CADASIL. Neurobiology of Aging. 2012;33(1002):e1029–e1036. doi: 10.1016/j.neurobiolaging.2011.09.013. [DOI] [PubMed] [Google Scholar]
- Klein J.C., Rushworth M.F., Behrens T.E., Mackay C.E., de Crespigny A.J., D'Arceuil H., Johansen-Berg H. Topography of connections between human prefrontal cortex and mediodorsal thalamus studied with diffusion tractography. NeuroImage. 2010;51:555–564. doi: 10.1016/j.neuroimage.2010.02.062. [DOI] [PMC free article] [PubMed] [Google Scholar]
- Kochunov P., Coyle T., Lancaster J., Robin D.A., Hardies J., Kochunov V., Bartzokis G., Stanley J., Royall D., Schlosser A.E., Null M., Fox P.T. Processing speed is correlated with cerebral health markers in the frontal lobes as quantified by neuroimaging. NeuroImage. 2010;49:1190–1199. doi: 10.1016/j.neuroimage.2009.09.052. [DOI] [PMC free article] [PubMed] [Google Scholar]
- Launer L.J., Hughes T.M., White L.R. Microinfarcts, brain atrophy, and cognitive function: the Honolulu Asia Aging Study Autopsy Study. Annals of Neurology. 2011;70:774–780. doi: 10.1002/ana.22520. [DOI] [PMC free article] [PubMed] [Google Scholar]
- Modirrousta M., Fellows L.K. Dorsal medial prefrontal cortex plays a necessary role in rapid error prediction in humans. Journal of Neuroscience. 2008;28:14000–14005. doi: 10.1523/JNEUROSCI.4450-08.2008. [DOI] [PMC free article] [PubMed] [Google Scholar]
- Mohamed M.A., Yousem D.M., Tekes A., Browner N., Calhoun V.D. Correlation between the amplitude of cortical activation and reaction time: a functional MRI study. AJR American Journal of Roentgenology. 2004;183:759–765. doi: 10.2214/ajr.183.3.1830759. [DOI] [PubMed] [Google Scholar]
- Naito E., Kinomura S., Geyer S., Kawashima R., Roland P.E., Zilles K. Fast reaction to different sensory modalities activates common fields in the motor areas, but the anterior cingulate cortex is involved in the speed of reaction. Journal of Neurophysiology. 2000;83:1701–1709. doi: 10.1152/jn.2000.83.3.1701. [DOI] [PubMed] [Google Scholar]
- O'Brien J.T., Erkinjuntti T., Reisberg B., Roman G., Sawada T., Pantoni L., Bowler J.V., Ballard C., DeCarli C., Gorelick P.B., Rockwood K., Burns A., Gauthier S., DeKosky S.T. Vascular cognitive impairment. Lancet Neurology. 2003;2:89–98. doi: 10.1016/s1474-4422(03)00305-3. [DOI] [PubMed] [Google Scholar]
- Perneger T.V. What's wrong with Bonferroni adjustments. British Medical Journal. 1998;316:1236–1238. doi: 10.1136/bmj.316.7139.1236. [DOI] [PMC free article] [PubMed] [Google Scholar]
- Peters N., Herzog J., Opherk C., Dichgans M. A two-year clinical follow-up study in 80 CADASIL subjects: progression patterns and implications for clinical trials. Stroke. 2004;35:1603–1608. doi: 10.1161/01.STR.0000131546.71733.f1. [DOI] [PubMed] [Google Scholar]
- Peters N., Opherk C., Bergmann T., Castro M., Herzog J., Dichgans M. Spectrum of mutations in biopsy-proven CADASIL: implications for diagnostic strategies. Archives of Neurology. 2005;62:1091–1094. doi: 10.1001/archneur.62.7.1091. [DOI] [PubMed] [Google Scholar]
- Peters N., Opherk C., Danek A., Ballard C., Herzog J., Dichgans M. The pattern of cognitive performance in CADASIL: a monogenic condition leading to subcortical ischemic vascular dementia. The American Journal of Psychiatry. 2005;162:2078–2085. doi: 10.1176/appi.ajp.162.11.2078. [DOI] [PubMed] [Google Scholar]
- Prins N.D., van Dijk E.J., den Heijer T., Vermeer S.E., Jolles J., Koudstaal P.J., Hofman A., Breteler M.M. Cerebral small-vessel disease and decline in information processing speed, executive function and memory. Brain. 2005;128:2034–2041. doi: 10.1093/brain/awh553. [DOI] [PubMed] [Google Scholar]
- Ray J.P., Price J.L. The organization of projections from the mediodorsal nucleus of the thalamus to orbital and medial prefrontal cortex in macaque monkeys. The Journal of Comparative Neurology. 1993;337:1–31. doi: 10.1002/cne.903370102. [DOI] [PubMed] [Google Scholar]
- Raz N., Gunning F.M., Head D., Dupuis J.H., McQuain J., Briggs S.D., Loken W.J., Thornton A.E., Acker J.D. Selective aging of the human cerebral cortex observed in vivo: differential vulnerability of the prefrontal gray matter. Cerebral Cortex. 1997;7:268–282. doi: 10.1093/cercor/7.3.268. [DOI] [PubMed] [Google Scholar]
- Reid A.T., van Norden A.G., de Laat K.F., van Oudheusden L.J., Zwiers M.P., Evans A.C., de Leeuw F.E., Kotter R. Patterns of cortical degeneration in an elderly cohort with cerebral small vessel disease. Hum. Brain Mapping. 2010;31:1983–1992. doi: 10.1002/hbm.20994. [DOI] [PMC free article] [PubMed] [Google Scholar]
- Reiss P.T., Schwartzman A., Lu F., Huang L., Proal E. Paradoxical results of adaptive false discovery rate procedures in neuroimaging studies. NeuroImage. 2012;63:1833–1840. doi: 10.1016/j.neuroimage.2012.07.040. [DOI] [PMC free article] [PubMed] [Google Scholar]
- Ridderinkhof K.R., Ullsperger M., Crone E.A., Nieuwenhuis S. The role of the medial frontal cortex in cognitive control. Science. 2004;306:443–447. doi: 10.1126/science.1100301. [DOI] [PubMed] [Google Scholar]
- Rosas H.D., Liu A.K., Hersch S., Glessner M., Ferrante R.J., Salat D.H., van der Kouwe A., Jenkins B.G., Dale A.M., Fischl B. Regional and progressive thinning of the cortical ribbon in Huntington's disease. Neurology. 2002;58:695–701. doi: 10.1212/wnl.58.5.695. [DOI] [PubMed] [Google Scholar]
- Sailer M., Fischl B., Salat D., Tempelmann C., Schonfeld M.A., Busa E., Bodammer N., Heinze H.J., Dale A. Focal thinning of the cerebral cortex in multiple sclerosis. Brain. 2003;126:1734–1744. doi: 10.1093/brain/awg175. [DOI] [PubMed] [Google Scholar]
- Salat D.H., Buckner R.L., Snyder A.Z., Greve D.N., Desikan R.S., Busa E., Morris J.C., Dale A.M., Fischl B. Thinning of the cerebral cortex in aging. Cerebral Cortex. 2004;14:721–730. doi: 10.1093/cercor/bhh032. [DOI] [PubMed] [Google Scholar]
- Salthouse T.A. Aging and measures of processing speed. Biological Psychology. 2000;54:35–54. doi: 10.1016/s0301-0511(00)00052-1. [DOI] [PubMed] [Google Scholar]
- Schmidt R., Freidl W., Fazekas F., Reinhart B., Grieshofer P., Koch M., Eber B., Schumacher M., Polmin K., Lechner H. The Mattis Dementia Rating Scale: normative data from 1,001 healthy volunteers. Neurology. 1994;44:964–966. doi: 10.1212/wnl.44.5.964. [DOI] [PubMed] [Google Scholar]
- Seo S.W., Lee J.M., Im K., Park J.S., Kim S.H., Kim S.T., Ahn H.J., Chin J., Cheong H.K., Weiner M.W., Na D.L. Cortical thinning related to periventricular and deep white matter hyperintensities. Neurobiology of Aging. 2012;33:1156–1167. doi: 10.1016/j.neurobiolaging.2010.12.003. [DOI] [PubMed] [Google Scholar]
- Siffrin V., Vogt J., Radbruch H., Nitsch R., Zipp F. Multiple sclerosis — candidate mechanisms underlying CNS atrophy. Trends in Neurosciences. 2010;33:202–210. doi: 10.1016/j.tins.2010.01.002. [DOI] [PubMed] [Google Scholar]
- Smith S.M., Jenkinson M., Woolrich M.W., Beckmann C.F., Behrens T.E., Johansen-Berg H., Bannister P.R., De Luca M., Drobnjak I., Flitney D.E., Niazy R.K., Saunders J., Vickers J., Zhang Y., De Stefano N., Brady J.M., Matthews P.M. Advances in functional and structural MR image analysis and implementation as FSL. NeuroImage. 2004;23:S208–S219. doi: 10.1016/j.neuroimage.2004.07.051. [DOI] [PubMed] [Google Scholar]
- Sowell E.R., Peterson B.S., Kan E., Woods R.P., Yoshii J., Bansal R., Xu D., Zhu H., Thompson P.M., Toga A.W. Sex differences in cortical thickness mapped in 176 healthy individuals between 7 and 87 years of age. Cerebral Cortex. 2007;17:1550–1560. doi: 10.1093/cercor/bhl066. [DOI] [PMC free article] [PubMed] [Google Scholar]
- Stuss D.T. Traumatic brain injury: relation to executive dysfunction and the frontal lobes. Current Opinion in Neurology. 2011;24:584–589. doi: 10.1097/WCO.0b013e32834c7eb9. [DOI] [PubMed] [Google Scholar]
- Tombaugh T.N. Trail Making Test A and B: normative data stratified by age and education. Archives of Clinical Neuropsychology. 2004;19:203–214. doi: 10.1016/S0887-6177(03)00039-8. [DOI] [PubMed] [Google Scholar]
- Troyer A. Normative data for clustering and switching on verbal fluency tasks. Journal of Clinical and Experimental Neuropsychology. 2000;22:370–378. doi: 10.1076/1380-3395(200006)22:3;1-V;FT370. [DOI] [PubMed] [Google Scholar]
- Van der Linen M., Wijns C., Bruyer R., Ansay C., Seron X. Educational level and cued recall performance in older and young adults. Psychologica Belgica. 1993;33:37–47. [Google Scholar]
- Viswanathan A., Gschwendtner A., Guichard J.P., Buffon F., Cumurciuc R., O'Sullivan M., Holtmannspotter M., Pachai C., Bousser M.G., Dichgans M., Chabriat H. Lacunar lesions are independently associated with disability and cognitive impairment in CADASIL. Neurology. 2007;69:172–179. doi: 10.1212/01.wnl.0000265221.05610.70. [DOI] [PubMed] [Google Scholar]
- Wakana S., Jiang H., Nagae-Poetscher L.M., van Zijl P.C., Mori S. Fiber tract-based atlas of human white matter anatomy. Radiology. 2004;230:77–87. doi: 10.1148/radiol.2301021640. [DOI] [PubMed] [Google Scholar]
- Wechsler D. The Psychological Corporation; Frankfurt, Germany: 2006. Wechsler Adult Intelligence Scale, German Version (WIE). Instructions Manual Pearson Assessment. [Google Scholar]
- Woolrich M.W., Jbabdi S., Patenaude B., Chappell M., Makni S., Behrens T., Beckmann C., Jenkinson M., Smith S.M. Bayesian analysis of neuroimaging data in FSL. NeuroImage. 2009;45:S173–S186. doi: 10.1016/j.neuroimage.2008.10.055. [DOI] [PubMed] [Google Scholar]
Associated Data
This section collects any data citations, data availability statements, or supplementary materials included in this article.
Supplementary Materials
Supplementary materials.