

Abstract
This review is concerned with how communication calls are processed and represented by populations of neurons in both the inferior colliculus (IC), the auditory midbrain nucleus, and the dorsal nucleus of the lateral lemniscus (DNLL), the nucleus just caudal to the IC. The review has five sections where focus in each section is on inhibition and its role in shaping response selectivity for communication calls. In the first section, the lack of response selectivity for calls in DNLL neurons is presented and discusses why inhibition plays virtually no role in shaping selectivity. In the second section, the lack of selectivity in the DNLL is contrasted with the high degree of response selectivity in the IC. The third section then reviews how inhibition in the IC shapes response selectivities for calls, and how those selectivities can create a population response with a distinctive response profile to a particular call, which differs from the population profile evoked by any other call. The fourth section is concerned with the specifics of inhibition in the IC, and how the interaction of excitation and inhibition creates directional selectivities for frequency modulations, one of the principal acoustic features of communication signals. The two major hypotheses for directional selectivity are presented. One is the timing hypothesis, which holds that the precise timing of excitation relative to inhibition is the feature that shapes directionality. The other hypothesis is that the relative magnitudes of excitation and inhibition are the dominant features that shape directionality, where timing is relatively unimportant. The final section then turns to the role of serotonin, a neuromodulator that can markedly change responses to calls in the IC. Serotonin provides a linkage between behavioral states and processing. This linkage is discussed in the final section together with the hypothesis that serotonin acts to enhances the contrast in the population responses to various calls over and above the distinctive population responses that were created by inhibition.
Keywords: response selectivity, inhibition, in-vivo whole cell recordings, serotonin
1.0 Introduction
Vocal communication is of obvious importance to all animals that hear, and underlies such behaviors as mother-infant interactions, courtship, territorial advertisement and defense as well as a host of other behaviors that are important if not vital for survival both of the individual and of the species. Animals emit a wide variety of signals for communication, and the signals are more often than not, complex. The call elements or syllables are often composed of frequency modulations that sweep upward or downward, or have varying degrees of modulations that first sweep in one direction and then another (Bohn et al., 2008; Kanwal et al., 1994). Complex variations in amplitude, amplitude modulations, are imposed on the signals, and syllables almost always have a harmonic structure. Other signals are composed of harmonic stacks of frequencies that have little or no frequency modulations (Woolley et al., 2005). The various syllables are emitted in more or less stereotyped sequences, or motifs, a feature that is particularly apparent in bird song (Marler, 2004) and in the songs of some bats (Behr, 2004; Bohn et al., 2009). Finally, the syllables and the sequences in which they are emitted are species-specific.
Communication calls convey information, and since the calls are species specific, it follows that the auditory system of each species must exhibit adaptations for discriminating among the various calls that the animals receive. The theme of this chapter is that one of the major mechanisms that endows neurons in the auditory system with the ability to respond selectively to some sounds but not others, or to respond differently to various calls, is inhibition. Specifically, it is the spectral and temporal features of inhibition as they interact with the spectral and temporal features of excitation that creates the response selectivity for communication calls.
Here focus is on the mechanisms in the auditory midbrain, the inferior colliculus (IC), since the IC is the first site in the auditory system where the information from all lower centers converges and where the initial selectivity for communication sounds is formed (Bauer et al., 2002; Casseday, 2002; Pollak et al., 2011b). The following sections consider the processing in the IC of mice and bats, since both the vocal repertoire of communication calls in these animals has been extensively studied and the mechanisms by which neurons in the auditory midbrain process those signals has been also been studied. Particular focus is on bats, because the processing of communication calls in their midbrains has been more extensively studied than the processing in other animals. However, it has become apparent that the mechanisms for processing communication calls in the IC of bats is also present in the IC of other animals, as I illustrate in the following sections.
In the first and second sections below, the difference in processing and call selectivity between a lower nucleus, the dorsal nucleus of the lateral lemniscus (DNLL), and the IC, which is one synaptic station above the DNLL, are discussed. The third section then shows that inhibition is the major mechanism in the IC that shapes the response selectivity for communication sounds from inputs that are far less selective. The fourth section is concerned with one principal acoustic feature of many communication calls, frequency modulations (FM). Here the two main views of how directional selectivity for FM sweeps is created in the IC by the interactions of excitation and inhibition are presented. The fifth, and last section then addresses the role of a neuromodulator, serotonin, and how serotonin influences inhibition and thereby changes the responses to communication calls in the IC and how those changes enhance the contrast in the responses of the IC population for various calls.
2.0 Responses evoked by complex signals in the dorsal nucleus of the lateral lemniscus
The dorsal nucleus of the lateral lemniscus (DNLL) is just caudal to the IC. It receives a complex compliment of both excitatory and inhibitory projections and sends strong, GABAergic inhibitory projections bilaterally to the IC. Although it is only one synapse below the IC, it is a nucleus in which inhibition plays virtually no role in shaping responses to natural communication calls (Bauer et al., 2002; Xie et al., 2005).
The basic way in which DNLL neurons respond to natural signals is shown in Fig. 1. The responses were recorded from 3 DNLL neurons in awake Mexican free-tailed bats and were evoked by 10 species-specific communication and echolocation calls. Each call had a unique spectrotemporal structure, was broadband, had multiple harmonics and each was presented at an intensity that was at least 20 dB above the neuron’s threshold at the frequency to which it was most sensitive, its best frequency (BF). The major point of this figure is to show that the processing of communication calls in the DNLL is simple, linear and straightforward (Bauer et al. 2002).
Fig. 1.
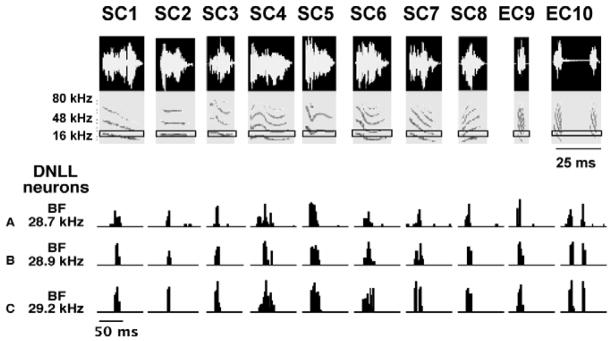
Responses of 3 DNLL neurons to 10 species-specific calls. Eight of the calls (SC1– SC8) are social communication calls and two others (EC9–EC10) are echolocation calls. The 3 DNLL cells are isofrequency since all are tuned close to ~29 kHz. The DNLL cells were unselective and fired to all 10 calls because each of the calls had energy that encroached upon their excitatory tuning curves. Black rectangles in each spectrogram shows the range of frequencies to which each of the neurons fired at the intensity at which the calls were presented. Adapted from Bauer et al., 2002.
The simplicity is illustrated by two features, non-selectivity and homogeneity. Non- selectivity is illustrated in Fig. 1. The 3 neurons were unselective for one or another of the 10 calls because each neuron fired to all 10 calls. Indeed, DNLL neurons respond to any signal so long as the signal has energy that encroaches upon a neuron’s excitatory response region (Bauer et al., 2002). The neuron’s excitatory response region is defined as those frequencies that evoke discharges when presented at a fixed intensity. Moreover, they respond to each signal with the same discharge vigor, whether presented in reversed or normal order (not shown).
2.1 Processing in the dorsal nucleus of the lateral lemniscus is simple and linear
Not only are DNLL neurons unselective, but their responses to species-specific calls are simple, in that the processing is linear and the responses evoked even by complex signals can be predicted from the neuron’s excitatory tuning. These features can be shown by convolving a neuron’s excitatory response region, the range of frequencies that evoke discharges at a fixed intensity, with the spectrotemporal features of each signal (Fig. 2) (Bauer et al., 2002). Convolution is a calculation in which two matrices, one constructed from the excitatory response region and the other from the spectrotemporal features of each call, are slid past each other and the amount of overlap between the matrices at each time point is measured. If, at a point in time, a portion of the response region matrix overlaps with a part of the call matrix, a response is predicted from the sound intensity in that portion of the call matrix and the neuron’s sensitivity to that particular frequency. Thus, the convolution takes into account not only whether the sound contains frequencies that enter the cell’s excitatory response region, but also at what times the spectral components of the sound and the response region overlap. Assuming that the neuron’s responses to complex calls are determined largely by the linear sum of responses to the component frequencies in the call, convolving the excitatory response region with each call provides a prediction of whether the neuron should respond to the call, and if so, how the neuron should respond in terms of relative response magnitude, latency and temporal discharge pattern, i.e., it should predict the neuron’s discharge profile. The response profile predicted by the convolution of the response region and a call, can then be compared to and correlated with the response profile that is actually evoked by the same call, thereby providing a numerical value of correspondence. The convolutions predicted whether or not the cell would respond to any of the calls with about 80% accuracy. This is illustrated for one DNLL neuron in Fig. 2. In this neuron, convolutions accurately predicted response profiles to 19 of 20 species-specific calls.
Fig. 2.

Envelopes of response profiles for predicted responses (black lines) and the responses actually evoked (gray lines) by 20 species-specific calls in a DNLL neuron. The predicted responses were generated by convolving the neuron’s excitatory response region with each of the 20 calls. Numbers in top right corner of each panel show the correlation coefficients for predicted and evoked response to each call. The average correlation for all calls is shown. All signals were presented at 40 dB SPL, which was 40 dB above threshold. Adapted from Bauer et al., 2002.
2.2 Neurons in the dorsal nucleus of the lateral lemniscus have no sideband inhibition
The explanation for this predictive accuracy is that DNLL processing of monaural signals is determined almost exclusively by the linear integration of excitatory innervation. The complete dependence on excitatory innervation also suggests that DNLL neurons have no sideband inhibition. The absence of sideband inhibition was confirmed by recording tuning curves and a suite of 10 natural calls before and while inhibition was blocked. As shown in Fig. 3, blocking inhibition caused no expansion of their tuning curves nor did it change their relative responsiveness to the suite of 10 calls (Xie et al., 2005). DNLL cells receive inhibitory innervation, but the frequencies that evoke inhibition overlap entirely with the frequencies that evoke excitation. Thus, blocking inhibition causes an increase in response magnitude but not an expansion of tuning or a change in the relative responsiveness to the suite of calls. Stated differently, inhibition acts as a gain control of response magnitude, but plays little or no role in shaping tuning or in shaping the responses to complex calls. Consequently, the response profiles evoked by complex signals are accurately predicted from only the excitatory responses to tonal frequencies
Fig. 3.

Blocking inhibition in DNLL cells does not change tuning curves and does not change selectivity for species-specific calls. A: A tuning curve obtained before blocking inhibition (control), while glycinergic inhibition was blocked by strychnine (Strych) and while GABAergic inhibition was blocked by bicuculline (BIC). Except for the increase in spike counts with BIC, the tuning was virtually the same in all three conditions, suggesting that there was no side band inhibition. B: Reponses evoked by 10 species-specific calls before (control) and while GABAergic inhibition was blocked with bicuculline (BIC). These are the same calls presented to the DNLL cells in Fig. 2. C: Blocking inhibition increased spike- counts but did not change the relative responsiveness to the calls, as shown by the virtual overlap of the normalized spike counts before (control) and while inhibition was blocked (BIC). Adapted from Xie et al., 2005.
2.3 The population of dorsal nucleus of the lateral lemniscus neurons is homogeneous
The most impressive, really remarkable, feature of the DNLL in bats is the striking similarity of each DNLL neuron to any other DNLL neuron tuned to the same frequency, i.e., their homogeneity (Bauer et al., 2002; Xie et al., 2005; Yang et al., 1994; Yang et al., 1998). The features of each DNLL neuron are so similar that the excitatory response region of one DNLL neuron can, by convolving it with the species-specific calls, accurately predict how any other DNLL neuron with the same BF will respond to those signals (Bauer et al, 2002). In other words, knowing the excitatory response region for one DNLL neuron is equivalent to knowing how that neuron and all others with the same BF respond to any complex signal. This is illustrated in Fig. 4, which shows the predicted and actual responses to three species- specific calls for five DNLL neurons, each tuned to about the same frequency. In each case, the predicted responses were calculated by convolving the response region of one neuron, neuron 4, with the matrices of the three species-specific signals. The ‘actual’ evoked responses to the 3 calls in Fig. 4 were those recorded from each neuron in response to the 3 calls. The correlations of actual and predicted response profiles were high for neuron 4, since it was this neuron’s response region that was convolved with the calls. The significant features, however, are that the correlations were as high for the other neurons, and in some cases even higher. This shows that the processing in the DNLL is not only linear, but that the population of DNLL neurons has similar excitatory response regions and employ similar processing mechanisms. These features explain the response homogeneity in the DNLL.
Fig. 4.

Predicted responses for any DNLL cell also predicts responses to any other DNLL cell with a similar BF. All predicted responses shown were from the convolution of the excitatory response region of neuron 4 (enclosed by rectangle) and the spectrographs of 3 calls, SC4, SC5, and SC8. The correlation between the predicted responses of neuron 4 and the evoked responses of each neuron are shown in the top right of each panel. Five neurons (1–5) had similar BFs ranging from 29.2 to 28.6 kHz, and the correlations of predicted and evoked responses were high. All signals were between 30 and 40 dB above threshold. Adapted from Bauer et al., 2002.
2.4 The dorsal nucleus of the lateral lemniscus population reproduces the spectrotemporal features of complex signals
The relatively simple, linear features of DNLL neurons allow the DNLL population to accurately reproduce the spectral and temporal structure of a given signal (Bauer et al. 2002). This representation is illustrated in Fig. 5, where the responses of many DNLL neurons to two communication calls are shown. The responses are plotted on the ordinate according to their best frequency and on the abscissa according to their relative latencies and discharge durations evoked by each call. Superimposing the spectrograms of each call on the responses evoked by that call reveals that the DNLL population response recreates both the spectral and the temporal features of each signal. As shown in the following sections, this mode of processing and population coding changes dramatically in the IC.
Fig. 5.

The DNLL population represents the spectral and temporal features of complex signals. Top: the responses of all DNLL neurons to call SC7. The bars that overlay each spectrogram show the latency and response duration evoked by each call. The responses are stacked according to their BF. All responses were evoked by signals presented between 30 and 40 dB above threshold. Adapted from Bauer et al., 2002.
3.0 While neurons in the dorsal nucleus of the lateral lemniscus neurons are homogeneous and unselective for calls, neurons in the inferior colliculus neurons are diverse and selective
In contrast to the homogeneous and non-selective responses to calls in the DNLL, IC neurons in most animals are selective for calls, in that most IC neurons respond only to some calls but not to others. This type of selectivity has been reported for the IC in mice, birds and bats (Andoni et al., 2007; Bauer et al., 2002; Eeuwes, 2009; Holmstrom et al., 2007; Portfors, 2004; Schneider et al.; Woolley et al., 2005; Xie et al., 2005). The only exception is the IC of guinea pigs, in which the proportion of IC neurons selective for calls is far lower than that seen in the IC of other animals (Suta et al., 2003). Whether this is due to a sampling bias or whether it reflects a major difference in the way that communication calls are processed in the IC of guinea pigs compared to other animals is unclear.
In birds, mice and bats, however, the selectivity for calls is prominent but graded. It is graded in that a small number of neurons respond to all calls presented, and thus are unselective, while other neurons respond to only some of the calls presented, and display selectivity. Yet other neurons failed to respond to any of the calls, although they may have responded to some calls if a larger repertoire of calls had been presented. Most neurons, however, respond to only a few of the calls presented, but the subset to which one IC neuron responds is often different from the subset to which another neuron responds. Most importantly, the selectivity is not a consequence of a mismatch between the spectral features of the calls and the range of frequencies that evoked discharges. In other words, the neurons failed to respond to many calls that had suprathreshold energy that fell within the neuron’s excitatory tuning curve.
Selectivity in the IC is illustrated in Fig. 6, which shows the same suite of 10 species- specific communication and echolocation calls that were presented to DNLL neurons in Fig. 1 and the responses that were evoked by these calls from 4 isofrequency neurons in the IC of Mexican free-tailed bats. The differential responses to each of the calls shows that IC cells are not only selective, but their selectivities are diverse, in that the particular subset of calls that evoke discharges varied from neuron to neuron, even though the 4 neurons were all tuned to the same frequency and all the signals had suprathreshold energy that encroached on their excitatory tuning regions.
Fig. 6.
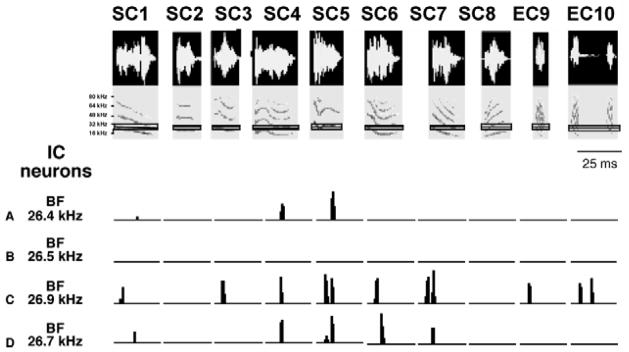
Responses of 4 IC neurons to 10 species-specific calls. Eight of the calls (SC1–SC8) are social communication calls and two others (EC9–EC10) are echolocation calls. These are the same calls presented to DNLL cells in Fig. 1. The 4 IC cells are isofrequency and all are tuned to about 26 kHz. The IC cells were selective in that each fired to only a subset of the 10 calls although each of the calls had suprathreshold energy that swept through each neuron’s excitatory tuning curve. The selectivity was also heterogeneous in that each cell fired to a particular subset of calls that was different from the subset to which the other cells fired. One cell failed to fire to any of the calls. Adapted from Klug et al., 2002.
Since the selectivities among the IC population in each isofrequency contour, or frequency representation, are diverse, the overall population response in each isofrequency region evoked by a given call must be unique, and thus different from the population response evoked by any other call. Moreover, the selectivities across frequency contours must also vary, since each of the neurons in the various isofrequency contours are tuned to different frequencies. The functional advantage gained by creating diversity and selectivity in the IC is that it endows the IC population with the ability to respond to any call with a unique and pronounced spatial pattern of activity. Moreover, selectivity increases the contrast of the spatial pattern across the IC population evoked by any call compared to any other call because it must create regions of activity separated by regions of inactivity, which differ from call to call (Klug et al. 2002). Thus instead of evoking a near-continuous profile of activity across the population of an isofrequency contour, as occurs in the DNLL and other lower nuclei, selectivity imposes regions of inactivity dispersed among active regions, a pattern that is then repeated in each isofrequency contour.
An impression of how such contrast amplification might be expressed is illustrated in Fig. 7, which shows a schematic illustration of how the various isofrequency populations in the DNLL and IC might respond to two signals with exactly the same spectrum but with different temporal features. Since DNLL neurons are unselective and homogeneous, the populations excited by the two signals are similar (note that this figure only shows which neurons are activated and does not incorporate the latencies nor the temporal patterns of their discharges, which would differ for the two signals). In contrast, the IC population response, both within and across isofrequency contours, would be markedly different due to the selectivity and heterogeneity of IC neurons. Whether neurons expressing the same selectivities are grouped or whether they are distributed in some other fashion throughout each isofrequency contour is unknown. In Fig. 7, the selectivities of IC neurons are shown as being randomly distributed, but the same argument would hold if the selectivities were grouped, although the pattern would be different.
Fig. 7.
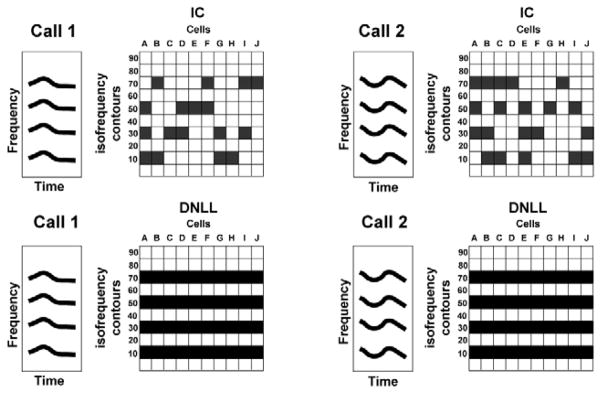
Schematic diagram to illustrate the unique profile of population responses in the IC evoked by 2 signals that have the same spectral content but different temporal features (call 2 is a time reversed version of call 1). For simplicity, the 2 calls are shown as being equally intense and as having equal energy in each of the three harmonics. The figure also compares the homogeneous responses in DNLL is frequency contours with the selective responses both within and among is isofrequency contours of the IC. Call 1 evokes responses in all of the DNLL neurons in those isofrequency contours for which call 1 contains suprathreshold energy and thus which encroach upon their excitatory response regions. Call 1 evokes no responses in the neurons of other isofrequency contours because there is no spectral energy in those frequencies, and thus those frequencies do not stimulate the DNLL neurons tuned to those frequencies. Since IC neurons are selective, only a subset of neurons are driven in corresponding isofrequency contours. Due to selectivity, call 2 excites a different subset of IC neurons than was excited by call 1. In contrast, the same DNLL neurons are excited by call 2 as were excited by call 1, because the two signals have the same spectral content. Thus the frequencies of both calls encroach upon the response regions of the same isofrequency DNLL cells, thereby exciting those neurons, and both signals fail to excite the same populations in other contours. Note that neither the timing of the excitation (the latency of each neuron), the temporal discharge patterns nor the response magnitudes (spike counts) are incorporated in the illustration.
Enhancement of population response differences is significant because communication calls are emitted in specific social situations and convey specific types of information (Bohn et al., 2008; Bohn et al., 2009). The animals, therefore, have to recognize each signal and discriminate that signal from any other signal. Thus the generation of a unique and pronounced population response to a given signal is a neural feature required for such discriminations. The IC is the first site at which such unique patterns of activity are generated and it is these unique patterns of activity that the IC then presents to higher regions in the forebrain, where further processing occurs and new representations emerge.
3.1 Selectivity for calls is shaped by inhibition in the IC
The selectivity for calls is shaped in the IC by the inhibitory innervation that plays upon IC cells (Bauer et al., 2002; Felix et al., 2007; Holmstrom et al.; Mayko et al., 2012; Portfors, 2004; Xie et al., 2005). That selectivity is shaped by inhibition has been shown both in the IC of several species of bats and in mice. The impact of inhibition on the coding of communication calls is illustrated in Fig. 8, which shows the responses of 9 neurons in the IC of Mexican free tailed bats to 2 different calls, social communication call 4 (SC4) and social communication call 6 (SC6). The responses evoked by the 2 calls were recorded before and while inhibition was blocked by the iontophoretic application of bicuculline and/or strychnine. Each of the nine neurons had a different BF and the cells are arranged from low to high BF, which corresponds to the tonotopic organization of the IC. Note that the calls had similar spectrotemporal features but evoked different responses among the population. Before inhibition was blocked, the nine neurons expressed different selectivities, since only three of the nine neurons responded to call SC4 and four different neurons responded to call SC6. Blocking inhibition virtually eliminated selectivity and allowed all nine neurons to respond to both calls.
Fig. 8.

Responses of 9 IC neurons to two calls, SC4 and SC6, before and while inhibition was blocked. The BFs of the neurons are arranged from low to high, which corresponds to the tonotopic organization of the IC. Note that the calls had similar spectrotemporal features but evoked different responses among the “population.” Before inhibition was blocked, the neurons exhibited selectivities for the calls, since each responded to one call but not to the other. Blocking inhibition eliminated selectivities and now all neurons responded to both signals. Adapted from Klug et al., 2002.
3. 2 The role of surround or sideband inhibition
Presumably, the inhibitory features that shaped the selectivities were the spectrotemporal characteristics of each neuron’s sideband inhibition, which, when eliminated, allowed IC neurons to respond in a manner almost as unselectively as DNLL neurons. The idea is that the frequencies that evoke discharges have a much wider bandwidth than indicated by their excitatory tuning curves because the excitatory frequencies on either flank of the excitatory tuning curve are suppressed by the inhibition in the surrounding or flanking regions. If the excitatory tuning curves of IC neurons are sharpened by surround inhibition, then their tuning curves should expand when inhibition is blocked.
Blocking inhibition does indeed cause the excitatory tuning curves to expand in most IC neurons (Klug et al., 2002; LeBeau et al., 2001; Xie et al., 2005; Yang et al., 1992). The expansion of tuning when inhibition is blocked is illustrated in Fig. 9 for IC neurons in Mexican free tailed bats. It should be emphasized that expansion of excitatory tuning when inhibition is blocked is a universal feature of the IC and has been seen in the IC of a wide variety of mammals.
Fig. 9.

The tuning curves of 6 representative neurons recorded from the IC of Mexican free tailed bats before and while inhibition was blocked by bicuculline and strychnine. Adapted from Xie et al., 2005.
Since blocking inhibition in the IC causes a marked reduction in selectivity for calls and a broadening of tuning, it follows that it must be the timing and magnitude of inhibition relative to excitation that underlies selectivity for calls. What is not clear is exactly how those features are expressed in each IC cell and how they differ among IC cells to create the diverse selectivities among isofrequency IC cells, since the detailed features of inhibition could not be determined simply by blocking inhibition. The features of surround inhibition that contribute to response selectivity for calls is considered in more detail in the chapter by Woolley and Portfors in this volume.
4.0 The Importance of Frequency modulations for Call Selectivity
In previous studies of the IC in bats, it was shown that the most important acoustic feature in the calls of bats was the structure of the frequency modulations (FMs) in their calls (Andoni et al., 2011; Andoni et al., 2007). FMs are not only prominent in both the echolocation and social communication calls emitted by bats (Bohn et al., 2008; Bohn et al., 2009; Kanwal et al., 1994), but FMs are also important components of communication signals in most animals, including humans (Doupe et al., 1999; Liberman et al., 1989). The structures the FM component is important because IC cells are tuned for FM features, the velocity of the sweep and its direction, whether it sweeps upward or downward (Andoni et al., 2007; Fuzessery et al.; Gittelman et al., 2012). Indeed, the specific tuning of IC cells for FM features is a principal feature, if not the principal feature, that determines response selectivity for calls in the IC of bats (Andoni et al., 2011).
Directional selectivity is strongly influenced by inhibition, since blocking inhibition greatly reduces or even eliminates directional preferences in IC neurons (Andoni et al., 2007; Fuzessery et al., 1996; Fuzessery et al., 2006). Since call selectivity is largely determined by FM selectivity in bats, it follows that a deeper understanding of how inhibition and excitation interact to create FM selectivity is fundamentally important for understanding the mechanisms that create call selectivity in the IC.
4. 1 Two contrasting views about how the interactions of excitation and inhibition generate FM selectivities
The ways that excitation and inhibition interact in the IC to generate FM selectivity is controversial. There are two major hypotheses. One hypothesis invokes timing, which argues that the precise latency of excitation relative to the latency of inhibition is the critical feature that determines whether a cell is selective for upward or downward sweeping FMs. In this view, IC cells in which surround inhibition is confined largely to the frequencies below excitation will be selective for downward FM sweeps. IC cells in which surround inhibition is confined largely to the frequencies higher than excitation will be selective for upward FM sweeps. The assumptions here are that the system is linear, that the strengths of excitation and inhibition are the same with downward and upward FMs and their arrival times at the IC neuron follow the temporal order of the frequencies in the signal that evokes them. For a neuron that prefers downward FMs, the timing hypothesis posits that the frequencies in a downward FM signal first sweeps through the excitatory field, thereby evoking an initial excitation, and slightly later in time the signal sweeps through the inhibitory field (Covey et al., 1999; Fuzessery et al., 1996; Suga, 1973; Suga et al., 1973; Ye et al.; Zhang et al., 2003). With upward sweeping FMs, inhibition is activated first and the initial inhibition quenches the subsequent excitation. The same arguments apply for upward preferring cells but the frequencies of the excitatory and inhibitory fields are reversed. In this hypothesis the exact timing of excitation and inhibition is of primary importance.
The other view is that the exact timing of excitation and inhibition is of little importance, at least within limits of a few milliseconds. Rather, the feature that determines the FM directional selectivity is the relative magnitudes of excitation and inhibition (Gittelman et al.; Gittelman et al., 2012; Gittelman, 2009). In this view, there is a small degree of directional selectivity already present in the excitatory inputs, but that slight degree of selectivity is greatly amplified by inhibition, where the magnitude of excitation and relative to inhibition is the key feature that determines whether an excitatory response is quenched, rather than their relative timing. In this view, an upward and downward FM evoke different excitatory and inhibitory strengths, even though the two signals have exactly the same spectral content, durations and sweep velocities.
There is considerable evidence to support both viewpoints. Before considering the supporting evidence for each view, the reader should keep four critical points in mind. The first point is that each of the methods used to evaluate directional selectivity have considerable strengths but have weaknesses as well. The second point is that the IC is heterogeneous, and markedly so. The heterogeneity of selectivity to calls, even among isofrequency IC cells was described earlier, but is even more substantial than those data indicate. It is well established that isofrequency cells in the IC receive a highly disparate complement of excitatory and inhibitory projections, and thus express a wide variety of response properties to both monaural and binaural stimulation. And that occurs even with simple stimuli, such as tone bursts. IC neurons also have an almost continuous range of input resistances, from very low to very high (Gittelman, 2009; Xie et al., 2008). They express a wide variety of intrinsic ion channels (Sivaramakrishnan et al., 2001; Tan et al., 2007; Xie et al., 2008), and a wide variety of threshold and subthreshold inputs that do not correlate with the complement of intrinsic ion channels nor with input resistance (Xie et al., 2008). The third point is that a common response property expressed in IC cells can be formed in a variety ways by a variety of different inputs, even though the all the cells appear to express the same sound evoked property (Li et al., 2010; Pollak, 2011; Pollak et al., 2011a). The fourth point follows from the above; namely, that the contrasting views on how FM directionality is formed are not mutually exclusive. Both can be correct, although each would apply to different cells, even though each of the cells expresses the same directional selectivity.
4.2 Evidence for the timing hypothesis
The evidence for timing is based on three principal observations. The first is that neurons selective for downward (or upward) FM sweeps have inhibitory fields that are lower (or higher) in frequency than the frequencies that activate their excitatory fields (Andoni et al., 2007; Brimijoin et al., 2005; Covey et al., 1999; Fuzessery et al., 2006; Razak et al., 2006; Suga, 1973; Suga et al., 1973; Ye et al.; Yue et al., 2007; Zhang et al., 2003). The second observation is that blocking inhibition reduces or eliminates directional preferences (Andoni et al., 2007; Fuzessery et al., 1996; Koch et al., 1998; Razak et al., 2009). Thus, for downward preferring cells, downward FM signals first sweep through the excitatory field, thereby evoking an initial excitation, and slightly later in time the signal sweeps through the inhibitory field. Conversely, upward sweeping FMs first activate inhibition that quenches the subsequent excitation. The same arguments apply for upward preferring cells but the frequencies of the excitatory and inhibitory fields are reversed. The spectral arrangements of the excitatory and inhibitory fields would, in this way, account for FM directionality and explain why blocking inhibition eliminates directionality.
The third observation is based on estimates of the timing of excitation and inhibition using tone bursts (Brimijoin and O’Neill, 2005; Razak and Fuzessery, 2009; Fuzessery et al., 2011; Williams et al., 2012). In this arrangement, an excitatory tone at the cell’s BF is presented while simultaneously presenting a tone in the inhibitory surround that suppresses the BF evoked spikes. The inhibitory tone is then shifted in time to determine the temporal relationships of inhibition and excitation required to suppress spikes. With this paradigm, Fuzessery and his colleagues determined the temporal relationships are consistent with the timing hypothesis. Later studies that used more complex sounds to generate spectrotemporal receptive fields, also confirmed the timing hypothesis, at least in a few IC cells (Andoni et al., 2007).
The timing hypothesis also receives strong support from a study by Kuo and Wu (2012) in which FM directional responses were recorded with patch electrodes in the IC of anesthetized rats. The authors recorded most responses in voltage clamp mode and thereby obtained both the excitatory and inhibitory currents evoked by FM sweeps. The FMs in that study swept from 500 Hz to 64 kHz and covered the entire extent of the rats’ hearing range. They found that like the rat auditory cortex, high frequency IC neurons were selective for downward FM sweeps and low frequency IC neurons were selective for upward sweeps. Most importantly they found that excitation led inhibition by several milliseconds for the preferred FM direction and that inhibition led excitation for the null FM direction in every IC neuron (Fig. 10A); there were no exceptions. They also report that changes in sweep direction had no affect on the magnitudes of either excitation or inhibition. The only influence of sweep direction was on the timing of excitation compared to inhibition. Thus there was no directionality to either excitation or inhibition since the magnitudes were constant with FM direction. Finally, they evaluated the latency of excitatory and inhibitory currents evoked by tone bursts with frequencies that covered the entire receptive fields of the excitatory and inhibitory currents. Remarkably, they found that the latency of excitation was virtually constant from 500 Hz to over 64 kHz, as was the latency of inhibition over a similar frequency range (Fig. 10B). The salient point is that inhibitory inputs were always delayed by 1–3 ms relative to the excitatory inputs. In other words, there was always a 1–3 ms delay between the excitatory and inhibitory inputs, regardless of frequency, and this was a common finding.
Fig, 10.

A, top: A low CF neuron preferring upward sweeps is shown with excitatory (blue) and inhibitory (red) synaptic conductances evoked by two FM directions. Bottom: a high CF neuron preferring downward sweeps is shown with excitatory (blue) and inhibitory (red) synaptic conductance evoked by two FM directions. The relative delay of inhibition to excitation is shown by the relative positions of 50% rise of the excitatory (blue) and inhibitory (red) conductances. B: Onset latencies of excitatory and inhibitory inputs of an IC neuron, which were evoked by tone pips across the whole frequency range at 70 dB SPL. Blue, excitatory inputs; red, inhibitory inputs; black, relative latency computed by subtracting the latency of inhibition from the latency of excitation. Adapted from Kuo and Wu, 2012.
The final piece to the story is that inhibitory tuning was always broader than excitatory tuning, with inhibition extending beyond the high frequency region of the excitatory tuning curve in upward preferring FM cells and inhibition extending beyond the low frequency excitatory region in cells that preferred downward sweeps. Thus, in a cell that preferred upward sweeps, the FM would simultaneously activate excitatory and inhibitory projections, but since the excitation always has a shorter latency, it would arrive at the IC cell 1–3 ms before the inhibition. Downward sweeps, in contrast, would activate inhibitory projections first, because of the extension of the inhibitory receptive field beyond the high frequency region of excitation. The initial inhibition presumably would then cause the inhibition to arrive either before or coincidentally with the excitation. In either case, excitation would be quenched, thereby evoking a smaller response than the upward sweep or no response at all.
The authors propose a simple, nearly perfectly linear system that operates in every IC neuron to produce directional selectivity. The data were in almost every way consistent with the timing hypothesis proposed from previous extracellular studies. In short, there is strong evidence from a variety of different studies in a variety of mammals to support the hypothesis that spectral arrangement of the excitatory and inhibitory fields generates FM directionality, and that hypothesis also explains why blocking inhibition eliminates directionality.
4.3 FM directional selectivity formed by timing disparities of excitation and inhibition does not apply to all IC cells
Based on the results presented above, it would appear that the timing hypothesis has been confirmed and the issue is settled. As pointed out previously, however, the IC is heterogeneous, where the formation of a particular response property is formed in different ways among its neuronal population (Li et al., 2010; Loftus et al., 2010; Pollak et al., 2011b; Xie et al., 2005). With regard to the formation of FM directional preferences, sensitivity for small timing differences between excitation and inhibition requires fast processing and should be effective in cells with the requisite features, namely cells with low input resistances and fast time constants. A recent study of IC cells in bats showed that about half of the cells in the IC do indeed have low input resistances, that range from 40–100 MΩ, and fast time constants (Xie et al., 2008). Presumably these are the cells whose FM preferences are formed by the relative timing of excitation and inhibition. The other side of the finding is that about half of the IC population has high input resistances of 200–400 MΩ and long time constants, features that are inappropriate for sensitivity to small changes in the timing of excitation and inhibition. How could cells with high input resistances and slow time constants possibly generate FM selectivity from the precise timing of excitation relative to inhibition?
4.4 The effects of the timing of excitation and inhibition was explored with in-vivo whole cell recordings
To evaluate the role of the timing of excitation and inhibition in IC cells with high input resistances and long time constants, intracellular recordings with patch electrodes were conducted in the IC of awake Mexican free-tailed bats (Gittelman et al., 2010; Gittelman et al., 2011; Gittelman, 2009). Upward and downward sweeping FMs were presented and the responses, both the spikes and post-synaptic potentials (PSPs) were recorded. With patch recordings, as with extracellular recordings, the discharges evoked in most IC cells exhibited a preference for one FM sweep direction over the other (Gittelman, 2009; Xie et al., 2007) (Fig. 11A).
Fig. 11.

Magnitude is more important than timing for generating PSP directionality. A: top panel shows responses (gray lines) evoked by a downward (preferred) and upward (null) FM sweep. The black lines show the predicted PSPs for the 2 FMs that were computed from the conductances evoked by the 2 signals (lower panel). The predicted PSPs agree closely with the predicted PSPs. B: To determine the relative contribution of magnitude asymmetries compared with temporal asymmetries in generating directional selectivity in the PSPs, the conductance waveforms were manipulated and tested. One swapped conductance had the preferred timing (latency and shape) and the null magnitude (area under the curve; top left). The other had the null timing and the preferred magnitude (top right). The magnitudes of both inhibitory and excitatory conductances were swapped, and the resulting swapped conductances were injected into the same model cell as the control conductances to obtain the predicted responses in the bottom panel. The swapped conductances with the preferred magnitudes evoked a larger PSP compared with those with the null magnitudes, showing that magnitude asymmetries were more important than timing in generating PSP directionality. Adapted from Gittelman et al., 2009.
To gain insights into how inhibition is interacting with excitation to generate the directional preferences, the underlying excitatory and inhibitory conductances evoked by preferred and null sweeping FMs were computed in a subset of IC cells that all had high input resistances and slow time constants (Gittelman et al. 2009). The conductances were computed from FM responses recorded in current clamp mode, where responses evoked by each FM were recorded at a different level of membrane hyperpolarization, as first described by Priebe and Ferster (2005). The conductances were then used in a model to compute predicted responses for the preferred and null FMs (Fig. 11A). The computations do not incorporate voltage gated channels and thus the computations only predict the PSP, either the EPSP or IPSP or both, that would be evoked by preferred or null FM. The justification for modeling the responses is that the predicted PSPs computed from the conductances were in close agreement with the responses actually evoked by the preferred and null FM signals (Fig. 11A, top panel).
The lower panels of Fig. 11A show the excitatory conductances (black) and the inhibitory conductances (gray) that were used to compute the predicted responses. It should be noted that the conductance waveforms evoked by the preferred and null FMs in Fig. 11A have three asymmetries. The first is the asymmetry in the magnitudes (area under the curve) of the excitatory conductances evoked by the upward and downward FMs. The excitatory conductance evoked by the preferred FM in this cell was twice as large as the excitatory conductance evoked by the null FM. The second is the asymmetry in the magnitudes of the inhibitory conductances evoked by the two FMs. The third is the asymmetries in the temporal features of the conductances, the latencies and shapes of the waveforms, where temporal features of the preferred excitatory and inhibitory conductances were different from the temporal features of the null excitatory and inhibitory conductances. The differences in the conductance waveforms generated by an upward and downward FM are noteworthy because each signal had exactly the same duration and the same power spectrum; the only difference was the reversal in the temporal sequence of frequencies. These waveform disparities again show the nonlinear processing in many IC neurons, which is in marked contrast to the linear processing proposed for the timing hypothesis.
4.5 Input magnitudes are more important than the timing
Which of the asymmetries is most important for shaping the difference in the preferred and null evoked responses? Differences in conductance magnitudes evoked by the preferred and null FMs made a larger contribution to the sound evoked PSP amplitudes than temporal differences. This was shown by “swapping” conductance features, where the temporal envelopes (latency and shape) of the conductances were preserved but the magnitudes (area under the curve) of the preferred excitatory and inhibitory conductances were scaled (Fig. 11B)(Gittelman, 2009). The scaling made the preferred excitatory conductance equal to the magnitude of the null excitatory conductance and the magnitude of the preferred inhibitory conductance equal to magnitude of the null inhibitory conductance. These “swapped” conductances had the preferred temporal envelopes, but the null magnitudes. Similarly, the null conductances were scaled to create a swapped conductance with null timings and the preferred magnitudes. Directional preferences were then evaluated from the PSPs computed from the swapped conductances. The conductances with the null timing and preferred magnitudes always generated a larger depolarization than the pair with the preferred timing and the null magnitudes. Directionality followed the magnitude, indicating that magnitude asymmetries play a greater role in determining the directional preference than temporal asymmetries.
These cells are very different from the linear IC cells that support the timing hypothesis. The timing of excitation relative to inhibition was critical for generating directional preferences in the linear IC cells, whereas timing played a minor role in the subset of non-linear cells with high input resistances described above. The role that the latency of inhibition relative to excitation plays in generating FM directionality in that subset of neurons is discussed next.
4.6 The effect of changing the latency of excitation and inhibition was explored with in-vivo whole cell recordings
To more directly evaluate the temporal relationships of excitation and inhibition, the latencies of the excitatory and inhibitory conductances were evaluated in the subset of cells from which conductances were obtained (Gittelman and Pollak, 2011). The major finding was that there was no consistent relationship between the latency of the excitatory and inhibitory conductances evoked by the preferred FM compared to the null FM. The two cells in Fig. 12 illustrate this point. The excitation and inhibition in cell 1, for example, were virtually coincident for both the preferred and null FMs. In cell 2, in contrast, excitation led inhibition in the response to the preferred FM, but excitation led by an even greater degree in the response to the null FM. The same temporal relationships also occurred for the cell in Fig. 11A. In yet other cells, the preferred FM evoked coincident excitatory and inhibitory conductances whereas the null FM evoked an excitatory conductance that led the inhibitory conductance (not shown). For these IC cells at least, the notion that the preferred FM evokes an excitation that leads inhibition whereas the null FM always evokes an inhibition that either leads or is coincident with the excitation is not supported by the relative latencies of the excitatory and inhibitory conductances.
Fig. 12.

Excitatory and inhibitory conductances obtained from 2 IC cells in response to downward (preferred) and upward (null) FM sweeps. In cell 1, the excitatory and inhibitory conductances were nearly coincident in both the preferred and null FMs. For cell 2, in contrast, the excitatory conductances led the inhibitory conductances in both the preferred and null FMs. Notice that the lead time of excitation was even greater for the conductances evoked by the null FM than for the preferred FM. Adapted from Gittelman and Pollak, 2011.
4.7 IC cells are relatively insensitive to timing
In the sections above, the term “timing” was used as if it were synonymous with differences in the latencies of excitation and inhibition. As shown below, “timing” can be more than just the relative latencies of excitation and inhibition. The PSP evoked by a signal can be shaped by the interaction among the temporal features of the inputs, which includes the relative latencies of excitation and inhibition, but also includes the shapes of the excitatory and inhibitory conductances together with their relative magnitudes. Each of those features not only shapes the response evoked by a particular signal, but each also shapes the degree to which PSP amplitudes change due to delaying or advancing inhibition relative to excitation.
The effects of latency shifts alone were explored by obtaining synaptic conductance waveforms evoked by down- and upward FMs, and then evaluating the effects of shifting inhibition relative to excitation on PSP amplitude in a model (Gittelman and Pollak, 2011). As shown in Fig. 13, either advancing or delaying inhibition relative to excitation in steps of 1.0 ms produced only slight changes in the predicted PSP amplitudes, which were often less than 1.0 mV/ms shift.
Fig. 13.

Temporal shifts of inhibition have only small effects on PSP height. Left, Conductance waveforms. Red, Excitation; blue, inhibition. Middle, ComputedPSPs. Black, Control; gray, shifted inhibition. Dashed_gray line is spike threshold. Right, Change in PSP height plotted against the time shift of inhibition. Cell 1. For the null FM, the control PSP was so far from spike threshold that large delays of inhibition (>5 ms) would be needed to evoke spikes. Cell 2: For the null FM, delaying inhibition increased PSP height, and advancing inhibition decreased PSP height. With firing probability at 50%, shifting inhibition would likely affect spiking.
Although shifts in the latency of inhibition relative to excitation caused only small changes in response (PSP) amplitude, those small changes in PSP amplitude could have vastly different effects. In some cases, the small amplitude changes had no effect on discharge probability, whereas in other cases the same amplitude change drove the cell from a subthreshold to a suprathreshold level. The effect of shifting inhibition depended on how far the amplitude of the sound evoked PSP was from spike threshold.
Such differential effects of small changes in latency are illustrated by the 2 cells in Fig. 13. For cell 1 in Fig. 13, the null FM evoked a PSP that was well below threshold (control), and inhibition had to be delayed by at least 5.0 ms before the EPSP reached threshold level. Advancing inhibition caused even smaller changes in PSP amplitude and advances as large as 10 ms were still not sufficient to evoke a threshold response. In contrast, the PSP evoked by the null FM in cell 2 was just at threshold and evoked discharges 50% of the time. Delaying inhibition by 1.0 ms caused a slight increase in the EPSP amplitude, but since the control EPSP was just at threshold level, even that small incremental boost would probably have caused a substantial increase in discharge probability. Conversely, advancing inhibition by 1.0 ms reduced the PSP amplitude, bringing it farther from threshold and thus reducing discharge probability. In this case, small changes in the latency of inhibition could substantially change the discharge probability and hence the cell’s directional selectivity.
In summary, the relative latencies of the excitatory and inhibitory conductances evoked by the preferred and null FMs differed from cell to cell. Consequently, the relative latency of excitation and inhibition by itself provides little or no information about the preferences of these cells for the direction of an FM sweep. In addition, small changes in the timing of inhibition relative to excitation caused only small changes in amplitudes of the predicted PSPs. The effects of “timing”, however, involve more than just the relative latencies of excitation and inhibition. The PSP evoked by a signal is shaped by the interaction among the temporal features of the inputs, the relative latencies of excitation and inhibition, the shapes of the excitatory and inhibitory conductances, together with their magnitudes. Each of those features not only shapes the response evoked by a particular signal, but each also shapes the degree to which PSP amplitudes change due to delaying or advancing inhibition relative to excitation.
The non-linear influence of spike-threshold also needs to be considered. If PSP amplitude is well below threshold, even substantial changes in PSP amplitude would have little or no effect on spike probability. Conversely, if the PSP amplitude is near threshold, then even a PSP increase or decrease as small as a fraction of a millivolt could be amplified by spike threshold into larger changes in the cell’s discharge probability, and thus markedly change the cell’s directional selectivity. There is often, therefore, a disjunction between the effects of “timing” or other changes in signal parameters on the cell’s response. On the one hand, the changes in the timing of excitation and inhibition generate only small changes in PSP amplitudes, but, on the other hand, the small change in PSP amplitude could be amplified by spike threshold into larger changes in the cell’s output, its discharge probability.
5.0 Neuromodulators influence responses to acoustic stimuli that include vocal communication calls
The previous sections focused on how response selectivity for calls and FM sweeps is created by the interactions of excitatory and inhibitory innervation that derive from the ascending projections in the auditory pathway. The processing and representation of acoustic signals must also be context dependent, especially for various behavioral states as occurs during social interactions. One of the linkages between social context and processing can be mediated by neuromodulators. It is significant in this regard that the nuclei in the ascending auditory system are richly innervated by variety of neuromodulators, which include acetylcholine, norepinepherine and serotonin, all of which have pronounced effects on responses to acoustic stimuli. Serotonin, in particular, provides innervation to all auditory nuclei, from cochlea to cortex, and the serotonergic innervation of the IC is especially rich (Hurley et al., 2001a; Hurley et al., 2002; Thompson et al., 1994). Similar to other neuromodulators, many of the effects of serotonin are through second messenger systems (Hurley, 2006; Hurley et al., 2012) that lead to the strengthening or weakening of the responses evoked in the IC by acoustic stimuli that act via the projections from lower order auditory nuclei. Moreover, serotonergic innervation has substantial influences on inhibition in the IC, which in turn affects sound evoked responses including responses evoked by communication calls.
The serotonergic neurons that provide innervation to the IC, as well as to other auditory nuclei, originate in the dorsal raphe nuclei, and thus are located extrinsic to the auditory system. Raphe neurons are activated by a number of factors that include arousal, acoustic stimuli and social interactions among others. Recent studies that monitored serotonin levels in the IC with voltammetry confirm that serotonergic levels in the IC vary with behavioral states (Hurley et al., 2011). It is especially noteworthy that in mice, serotonergic levels in the IC increase during social interactions, which include encounters between a resident and an intruder in both males and females as well as encounters with the opposite sex. It is for these reasons that serotonergic innervation can link behavioral states to neural activity in the auditory system and thus can modify neuronal activity depending on social context.
5.1 Serotonin changes selectivity to communication calls
As was shown in previous sections, IC neurons respond selectively to vocal communication calls, where most neurons respond to some but not all calls. In Mexican free- tailed bats, the iontophoretic application of serotonin markedly changes responses to tones and FM stimuli in about 50% of the IC population (Hurley et al., 1999; Hurley et al., 2001b; Hurley et al., 2005). The changes seen with simpler acoustic stimuli were also found with communication calls (Hurley and Pollak, 2005). The serotonin-induced changes ranged in complexity and were different among the IC population. As shown in Fig. 14, the effects on responses to communication calls in some cells simply produced a uniformly depressing influence on the responses to each of the calls presented, while in other neurons serotonin produced a uniform facilitation or enhancement of the responses evoked by each call. In yet other neurons, serotonin induced a non-uniform influence, where it depressed the responses to some calls but facilitated the responses to other calls.
Fig. 14.

Serotonergic effects on call responses. A: Serotonin uniformly decreases responses to calls in one neuron. PSTH: At the top of the figure, summed PSTHs of a neuron’s response to 20 presentations of 16 different communication calls are plotted in the control and in serotonin. Serotonin reduced the responses to all 14 calls that evoked responses above the criterion of five spikes (50% response). B: Serotonin uniformly increased responses to calls in a different neuron. Note that for 4 calls, calls C3, C5, C15 and E1, the neuron did not respond in the control but did in serotonin. C: A neuron showing mixed effects of serotonin on different calls. Serotonin suppressed the responses to three calls, calls C2, C5 and C8, facilitated the responses to five calls, calls C9, C11, C12, C15 and C16, and had little effect on the responses to four calls, calls C1, C4, C10 and C14. Adapted from Hurley and Pollak, 2005.
To provide a flavor for the complex and variable changes in the population responses that can be induced by serotonin, Fig. 15 shows the control and serotonin-induced responses that were evoked by two calls, call C1 and C13, in a sample of 15 neurons recorded from the IC of Mexican free tailed bats (Hurley et al., 2005). The percentage of the 15 neurons whose spike counts showed uniform depression, uniform facilitation, non- uniform effects or were unchanged by serotonin are the same as the percentages among the IC population. The normalized spike counts evoked by each call are shown as bar graphs in Fig. 15, with the absolute spike counts shown above each bar. The neurons are arranged from top to bottom according to the effect that serotonin had on call C1. The responses to call C1 in neuron 1 to neuron 5 were completely suppressed by serotonin while neuron 6 was weakly suppressed. The responses to call C1 in the next two neurons (7–8) were facilitated by serotonin and the responses of the next four neurons (9–13) changed by less than 50%, the criterion for a serotonin induced change. Neurons 14–15 failed to respond to call C1 both in the control and when serotonin was applied. Thus, the activity profiles of the 15 neurons evoked by call C1 viewed down the control and the serotonin columns are different, as they must be because in many of the neurons serotonin changed the response to call C1. The same is true for the activity profile evoked in the same neurons by call C13, so that the profile with serotonin is different from the control profile.
Fig. 15.

Comparison of serotonergic effects on two calls. A: Comparison of spike counts in control versus serotonin for call C1 and call C13 in a sample of 15 neurons. Spike counts were normalized to the highest value, either in the control or in serotonin. All control spike counts are represented by filled black columns. Unfilled columns represent spike counts that decreased by at least 50% in serotonin relative to the control, stripped columns represent spike counts that increased by at least 50% in serotonin relative to the control, and gray columns represent spike counts that changed by less than 50% relative to the control. Serotonin had different effects on responses to different calls, even for individual neurons such as neuron 8. B: The ratios of spike counts in response to calls C1 and C13 in the control and in the presence of serotonin are shown next to each set of histograms. The similarity index (SI) was simply the addition of the ratios for the 15 neurons divided by the number of neurons (15). For the sample of 15 neurons, the mean SI for the control condition was 0.38 but with serotonin the mean SI was 0.31, representing an 18% decrease in the similarities between calls C1 and C3 in the presence of serotonin compared to the control. Adapted from Hurley and Pollak, 2005.
To compare the response disparities of the control population response and the population response with serotonin, the overall similarity of the population response to the two calls was quantified with a similarity index (SI). To calculate the SI, the ratios of the spike-counts evoked by the two calls without serotonin were first computed for each neuron. Neurons that responded to both calls with the same spike count had a ratio of 1.0 whereas neurons that responded to only one call and failed to respond to the other call had a ratio of 0. Neurons that failed to respond to either of the calls were not assigned a ratio (e.g., neuron 1 did not respond to either call C1 or to call C13 with serotonin and thus no spike ratio was computed). The SI for the control was simply the addition of the control ratios for the 15 neurons divided by the number of neurons (15) and the same was done for the ratios of responses with serotonin.
SI incorporates the difference in spike counts of the entire sample evoked by the two calls, with higher values indicating greater response similarity. For the sample of 15 neurons in Fig. 15, the SI for the control condition was 0.38 but with serotonin the SI was 0.31, representing an 18% decrease in the similarities between calls C1 and C3 in the presence of serotonin compared to the control. The main point is that the control SI was larger than the SI with serotonin, suggesting that the population response evoked by the two calls was more similar in the control than when serotonin was applied. Stated differently, the population responses for the two calls with serotonin were more disparate than they were in the control condition.
In summary, it appears that serotonin, by changing the responsiveness of individual neurons to a call, also changes the profile of the population response evoked by that call. These changes would generally serve to enhance or amplify differences in the population responses evoked by different calls. Thus, the serotonin induced sculpting of the population activity would result in a more divergent and less ambiguous response to each call. This effect would be greatest when serotonin levels are highest, during high levels of behavioral arousal, as occurs in a variety of social contexts and, for bats and other predators, while hunting.
5.2 Serotonin modulates inhibition in the IC
The effects of depressive and facilitative effects of serotonin can be related to modulation of inhibition in the IC. In a recent review, Hurley and Sullivan (2012) proposed two major scenarios for the serotonergic modulation of inhibition and its consequent impact on the responsiveness of IC cells to acoustic stimulation. The scenarios follow from the prevalence of two types of serotonergic receptors in the IC and the actions both types of receptors in the IC and in other brain regions. The receptors are the 5-HT1A and the 5-HT1B receptors, both of which act through G- proteins. 5-HT 1A receptors are localized on the somatic-dendritic compartments of IC cells, and when activated open of K+ channels. Thus, the release of serotonin in the IC would cause neurons possessing 5-HTIA receptors to hyperpolarize and thereby reduce their responsiveness to acoustic stimulation. In this case, serotonin does not modulate inhibitory innervation, but rather directly inhibits some IC cells. Presumably this is one of the primary mechanisms that produces the suppressive effects of serotonin on sound evoked responses.
The 5-HT1B receptor, in contrast, is localized on axonal terminals of GABAergic axons and acts on calcium channels to decrease transmitter release. The scenario for role of the 5-HT1B receptor is a direct modulation of the strength of inhibitory innervation, and relates to response facilitation induced by serotonin. In this scenario, the release of serotonin activates the 5-HT1B receptors on GABAergic terminals, which reduces the amount of GABA released by the axon terminal. The idea is that under baseline conditions, an acoustic signal activates both excitatory and inhibitory inputs that, in combination, evoke a baseline or control response in the IC cell. With higher levels of serotonin, the activation of the 5-HT1B receptors on the terminals of GABAergic axons reduces the amount of inhibitory transmitter released. It is the reduction in inhibition that generates the facilitation. In these ways, serotonergic innervation can influence inhibition and thus shift the excitatory-inhibitory balance that selectively tunes sensory processing.
6.0 Summary and Conclusions
Response selectivity for natural communication calls first emerges in the IC and is absent in DNLL neurons. DNLL neurons respond non-selectively to communication calls because they have no inhibition that surrounds their excitatory tuning curves. Thus blocking inhibition in the DNLL, while increasing response vigor, has no influence on response selectivity for calls. In marked contrast, most IC neurons express selectivity. The selectivity is shaped by surround inhibition, since the selectivity can be largely, or in some cases entirely eliminated by blocking inhibition (Bauer et al., 2002; Fuzessery et al., 1996; Mayko et al., 2012; Xie et al., 2005). The various selectivities expressed by IC neurons for communication calls are, in part, a consequence of the multiple ways in which inhibition interacts with excitation to shape their selectivities for particular acoustic features that comprise the calls (Andoni et al., 2011; Andoni et al., 2007; Pollak, 2011; Pollak et al., 2011a). One example is the formation of FM directional selectivity. In some IC neurons, directional selectivities are formed by the differences in timing of excitation and inhibition (Andoni et al., 2007; Fuzessery et al., 2011; Kuo et al., 2012; Pecka et al., 2007; Williams et al., 2012), whereas in other neurons timing is much less important. In those neurons the dominant features are the relative magnitudes and shapes of the excitatory and inhibitory conductances, which interact to create their directional selectivities (Gittelman et al., 2011; Gittelman et al., 2012; Gittelman, 2009). Indeed, there is no single mechanism that the IC employs to form a given monaural or binaural response property, but rather there are multiple ways in which the same response property is formed among the IC population. The advantage conferred by the multiple formations of response properties in the IC is to create unique patterns of activity among the neuronal population in the IC, where unique population patterns are evoked even by signals with only subtle differences in their spectrotemporal features.
Finally, the pattern of the population responses to any call can be further amplified by serotonin (Hurley et al., 2011; Hurley et al., 2012; Klug et al., 2002), and presumably by other neuromodulators as well, although the roles of other neuromodulators has not been extensively explored in the IC. The neuromodulators form one of the linkages between behavioral state and neural activity in the auditory system and thus can modify neuronal activity depending on social context. Enhancement of population response differences is significant because communication calls are emitted in specific social situations and convey specific types of information (Bohn et al., 2008; Bohn et al., 2009). The animals, therefore, have to recognize each signal and discriminate that signal from any other signal. Thus the generation of a unique and pronounced population response to a given signal is a neural feature required for such discriminations. The IC is the first site at which unique patterns of activity are generated and it is these unique patterns of activity that the IC then presents to higher regions in the forebrain, where further processing occurs and new representations emerge.
Processing of communication calls in the inferior colliculus.
Inhibition shapes responses to communication calls in the inferior colliculus
Serotonin links behavioral states and processing, and acts to enhances the contrast in the population responses to various calls
Acknowledgments
supported by NIH grant DC007856
Abbreviations
- DNLL
dorsal nucleus of the lateral lemniscus
- EPSP
excitatory post-synaptic potential
- FM
frequency modulation
- IC
inferior colliculus
- IPSP
inhibitory post-synaptic potential
- MΩ
megaohm
- mV
millivolt
- PSP
post-synaptic potential
- SI
Similarity index
- STRF
spectrotemporal receptive field
Footnotes
Publisher's Disclaimer: This is a PDF file of an unedited manuscript that has been accepted for publication. As a service to our customers we are providing this early version of the manuscript. The manuscript will undergo copyediting, typesetting, and review of the resulting proof before it is published in its final citable form. Please note that during the production process errors may be discovered which could affect the content, and all legal disclaimers that apply to the journal pertain.
References Cited
- Andoni S, Pollak GD. Selectivity for spectral motion as a neural computation for encoding natural communication signals in bat inferior colliculus. J Neurosci. 2011;31:16529–40. doi: 10.1523/JNEUROSCI.1306-11.2011. [DOI] [PMC free article] [PubMed] [Google Scholar]
- Andoni S, Li N, Pollak GD. Spectrotemporal receptive fields in the inferior colliculus revealing selectivity for spectral motion in conspecific vocalizations. J Neurosci. 2007;27:4882–93. doi: 10.1523/JNEUROSCI.4342-06.2007. [DOI] [PMC free article] [PubMed] [Google Scholar]
- Bauer EE, Klug A, Pollak GD. Spectral determination of responses to species-specific calls in the dorsal nucleus of the lateral lemniscus. J Neurophysiol. 2002;88:1955–67. doi: 10.1152/jn.2002.88.4.1955. [DOI] [PubMed] [Google Scholar]
- Behr O, von Helversen O. Bat serenades-complex courtship songs of the sac-winged bat (Saccopteryx bilineata) Behav Ecol Sociobiol. 2004;56:106–115. [Google Scholar]
- Bohn KM, Schmidt-French B, Ma ST, Pollak GD. Syllable acoustics, temporal patterns, and call composition vary with behavioral context in Mexican free-tailed bats. J Acoust Soc Am. 2008;124:1838–48. doi: 10.1121/1.2953314. [DOI] [PMC free article] [PubMed] [Google Scholar]
- Bohn KM, Schmidt-French B, Schwartz C, Smotherman M, Pollak GD. Versatility and stereotypy of free-tailed bat songs. PLoS One. 2009;4:e6746. doi: 10.1371/journal.pone.0006746. [DOI] [PMC free article] [PubMed] [Google Scholar]
- Brimijoin WO, O’Neill WE. On the prediction of sweep rate and directional selectivity for FM sounds from two-tone interactions in the inferior colliculus. Hear Res. 2005;210:63–79. doi: 10.1016/j.heares.2005.07.005. [DOI] [PMC free article] [PubMed] [Google Scholar]
- Casseday JH, Fremouw T, Covey E. The inferior colliculus: A hub for the central auditory system. In: Oertel D, Popper AN, Fay RR, editors. Integrative Functions in the Mammalian Auditory Pathway. Vol. 15. Springer-Verlag; New York: 2002. pp. 238–318. [Google Scholar]
- Covey E, Casseday JH. Timing in the auditory system of the bat. Annu Rev Physiol. 1999;61:457–76. doi: 10.1146/annurev.physiol.61.1.457. [DOI] [PubMed] [Google Scholar]
- Doupe AJ, Kuhl PK. Birdsong and human speech: common themes and mechanisms. Annu Rev Neurosci. 1999;22:567–631. doi: 10.1146/annurev.neuro.22.1.567. [DOI] [PubMed] [Google Scholar]
- Eeuwes L, Holstrom L, Portfors C. Duration selectivity underlies responses to social vocalizations in the IC. Abstracts, Association for Research in Otolarynology Midwinter Meeting. 2009;32:218. [Google Scholar]
- Felix RA, 2nd, Portfors CV. Excitatory, inhibitory and facilitatory frequency response areas in the inferior colliculus of hearing impaired mice. Hear Res. 2007;228:212–29. doi: 10.1016/j.heares.2007.02.009. [DOI] [PMC free article] [PubMed] [Google Scholar]
- Fuzessery ZM, Hall JC. Role of GABA in shaping frequency tuning and creating FM sweep selectivity in the inferior colliculus. J Neurophysiol. 1996;76:1059–73. doi: 10.1152/jn.1996.76.2.1059. [DOI] [PubMed] [Google Scholar]
- Fuzessery ZM, Richardson MD, Coburn MS. Neural mechanisms underlying selectivity for the rate and direction of frequency-modulated sweeps in the inferior colliculus of the pallid bat. J Neurophysiol. 2006;96:1320–36. doi: 10.1152/jn.00021.2006. [DOI] [PubMed] [Google Scholar]
- Fuzessery ZM, Razak KA, Williams AJ. Multiple mechanisms shape selectivity for FM sweep rate and direction in the pallid bat inferior colliculus and auditory cortex. J Comp Physiol A Neuroethol Sens Neural Behav Physiol. 2011 doi: 10.1007/s00359-010-0554-0. [DOI] [PMC free article] [PubMed] [Google Scholar]
- Gittelman JX, Pollak GD. It’s about time: how input timing is used and not used to create emergent properties in the auditory system. J Neurosci. 31:2576–83. doi: 10.1523/JNEUROSCI.5112-10.2011. [DOI] [PMC free article] [PubMed] [Google Scholar]
- Gittelman JX, Li N. FM velocity selectivity in the inferior colliculus is inherited from velocity-selective inputs and enhanced by spike threshold. J Neurophysiol. 2010;106:2399–414. doi: 10.1152/jn.00250.2011. [DOI] [PMC free article] [PubMed] [Google Scholar]
- Gittelman JX, Pollak GD. It’s about time: how input timing is used and not used to create emergent properties in the auditory system. J Neurosci. 2011;31:2576–83. doi: 10.1523/JNEUROSCI.5112-10.2011. [DOI] [PMC free article] [PubMed] [Google Scholar]
- Gittelman JX, Wang L, Colburn HS, Pollak GD. Inhibition shapes response selectivity in the inferior colliculus by gain modulation. Front Neural Circuits. 2012;6:67. doi: 10.3389/fncir.2012.00067. [DOI] [PMC free article] [PubMed] [Google Scholar]
- Gittelman JX, Li N, Pollak GD. Mechanisms underlying directional selectivity for frequency modulated sweeps in the inferior colliculus revealed by in vivo whole-cell recordings. J Neurosci. 2009;29:13030–13041. doi: 10.1523/JNEUROSCI.2477-09.2009. [DOI] [PMC free article] [PubMed] [Google Scholar]
- Holmstrom L, Roberts PD, Portfors CV. Responses to social vocalizations in the inferior colliculus of the mustached bat are influenced by secondary tuning curves. J Neurophysiol. 2007;98:3461–72. doi: 10.1152/jn.00638.2007. [DOI] [PubMed] [Google Scholar]
- Holmstrom LA, Eeuwes LB, Roberts PD, Portfors CV. Efficient encoding of vocalizations in the auditory midbrain. J Neurosci. 2010;30:802–19. doi: 10.1523/JNEUROSCI.1964-09.2010. [DOI] [PMC free article] [PubMed] [Google Scholar]
- Hurley LM. Different serotonin receptor agonists have distinct effects on sound-evoked responses in inferior colliculus. J Neurophysiol. 2006;96:2177–88. doi: 10.1152/jn.00046.2006. [DOI] [PMC free article] [PubMed] [Google Scholar]
- Hurley LM, Pollak GD. Serotonin differentially modulates responses to tones and frequency-modulated sweeps in the inferior colliculus. J Neurosci. 1999;19:8071–82. doi: 10.1523/JNEUROSCI.19-18-08071.1999. [DOI] [PMC free article] [PubMed] [Google Scholar]
- Hurley LM, Thompson AM. Serotonergic innervation of the auditory brainstem of the Mexican free-tailed bat, Tadarida brasiliensis. J Comp Neurol. 2001a;435:78–88. doi: 10.1002/cne.1194. [DOI] [PubMed] [Google Scholar]
- Hurley LM, Pollak GD. Serotonin effects on frequency tuning of inferior colliculus neurons. J Neurophysiol. 2001b;85:828–42. doi: 10.1152/jn.2001.85.2.828. [DOI] [PubMed] [Google Scholar]
- Hurley LM, Pollak GD. Serotonin modulates responses to species-specific vocalizations in the inferior colliculus. J Comp Physiol A Neuroethol Sens Neural Behav Physiol. 2005;191:535–46. doi: 10.1007/s00359-005-0623-y. [DOI] [PubMed] [Google Scholar]
- Hurley LM, Hall IC. Context-dependent modulation of auditory processing by serotonin. Hear Res. 2011;279:74–84. doi: 10.1016/j.heares.2010.12.015. [DOI] [PMC free article] [PubMed] [Google Scholar]
- Hurley LM, Sullivan MR. From behavioral context to receptors: serotonergic modulatory pathways in the IC. Front Neural Circuits. 2012;6:58. doi: 10.3389/fncir.2012.00058. [DOI] [PMC free article] [PubMed] [Google Scholar]
- Hurley LM, Thompson AM, Pollak GD. Serotonin in the inferior colliculus. Hear Res. 2002;168:1–11. doi: 10.1016/s0378-5955(02)00365-9. [DOI] [PubMed] [Google Scholar]
- Kanwal JS, Matsumura S, Ohlemiller K, Suga N. Analysis of acoustic elements and syntax in communication sounds emitted by mustached bats. J Acoust Soc Am. 1994;96:1229–54. doi: 10.1121/1.410273. [DOI] [PubMed] [Google Scholar]
- Klug A, Bauer EE, Hanson JT, Hurley L, Meitzen J, Pollak GD. Response selectivity for species-specific calls in the inferior colliculus of Mexican free- tailed bats is generated by inhibition. J Neurophysiol. 2002;88:1941–54. doi: 10.1152/jn.2002.88.4.1941. [DOI] [PubMed] [Google Scholar]
- Koch U, Grothe B. GABAergic and glycinergic inhibition sharpens tuning for frequency modulations in the inferior colliculus of the big brown bat. J Neurophysiol. 1998;80:71–82. doi: 10.1152/jn.1998.80.1.71. [DOI] [PubMed] [Google Scholar]
- Kuo RI, Wu GK. Generation of direction selectivity in the auditory system. Neuron. 2012;73:1016–1027. doi: 10.1016/j.neuron.2011.11.035. [DOI] [PubMed] [Google Scholar]
- LeBeau FE, Malmierca MS, Rees A. Iontophoresis in vivo demonstrates a key role for GABA(A) and glycinergic inhibition in shaping frequency response areas in the inferior colliculus of guinea pig. J Neurosci. 2001;21:7303–12. doi: 10.1523/JNEUROSCI.21-18-07303.2001. [DOI] [PMC free article] [PubMed] [Google Scholar]
- Li N, Gittelman JX, Pollak GD. Intracellular recordings reveal novel features of neurons that code interaural intensity disparities in the inferior colliculus. J Neurosci. 2010;30:14573–84. doi: 10.1523/JNEUROSCI.2228-10.2010. [DOI] [PMC free article] [PubMed] [Google Scholar]
- Liberman AM, Mattingly IG. A specialization for speech perception. Science. 1989;243:489–94. doi: 10.1126/science.2643163. [DOI] [PubMed] [Google Scholar]
- Loftus WC, Bishop DC, Oliver DL. Differential patterns of inputs create functional zones in central nucleus of inferior colliculus. J Neurosci. 2010;30:13396–13408. doi: 10.1523/JNEUROSCI.0338-10.2010. [DOI] [PMC free article] [PubMed] [Google Scholar]
- Marler P. Bird calls: their potential for behavioral neurobiology. Ann N Y Acad Sci. 2004;1016:31–44. doi: 10.1196/annals.1298.034. [DOI] [PubMed] [Google Scholar]
- Mayko ZM, Roberts PD, Portfors CV. Inhibition shapes selectivity to vocalizations in the inferior colliculus of awake mice. Front Neural Circuits. 2012;6:73. doi: 10.3389/fncir.2012.00073. [DOI] [PMC free article] [PubMed] [Google Scholar]
- Pecka M, Zahn TP, Saunier-Rebori B, Siveke I, Felmy F, Wiegrebe L, Klug A, Pollak GD, Grothe B. Inhibiting the inhibition: a neuronal network for sound localization in reverberant environments. J Neurosci. 2007;27:1782–90. doi: 10.1523/JNEUROSCI.5335-06.2007. [DOI] [PMC free article] [PubMed] [Google Scholar]
- Pollak GD. Discriminating among complex signals: the roles of inhibition for creating response selectivities. J Comp Physiol A Neuroethol Sens Neural Behav Physiol. 2011;197:625–40. doi: 10.1007/s00359-010-0602-9. [DOI] [PubMed] [Google Scholar]
- Pollak GD, Gittelman JX, Li N, Xie R. Inhibitory projections from the ventral nucleus of the lateral lemniscus and superior paraolivary nucleus create directional selectivity of frequency modulations in the inferior colliculus: A comparison of bats with other mammals. Hear Res. 2011a;273:134–44. doi: 10.1016/j.heares.2010.03.083. [DOI] [PMC free article] [PubMed] [Google Scholar]
- Pollak GD, Xie R, Gittelman JX, Andoni S, Li N. The dominance of inhibition in the inferior colliculus. Hear Res. 2011b;274:27–39. doi: 10.1016/j.heares.2010.05.010. [DOI] [PMC free article] [PubMed] [Google Scholar]
- Portfors CV. Combination sensitivity and processing of communication calls in the inferior colliculus of the Moustached Bat Pteronotus parnellii. An Acad Bras Cienc. 2004;76:253–7. doi: 10.1590/s0001-37652004000200010. [DOI] [PubMed] [Google Scholar]
- Razak KA, Fuzessery ZM. Neural mechanisms underlying selectivity for the rate and direction of frequency-modulated sweeps in the auditory cortex of the pallid bat. J Neurophysiol. 2006;96:1303–19. doi: 10.1152/jn.00020.2006. [DOI] [PubMed] [Google Scholar]
- Razak KA, Fuzessery ZM. GABA shapes selectivity for the rate and direction of frequency modulated sweeps in the auditory cortex. J Neurophysiol. 2009 doi: 10.1152/jn.00334.2009. [DOI] [PMC free article] [PubMed] [Google Scholar]
- Schneider DM, Woolley SM. Discrimination of communication vocalizations by single neurons and groups of neurons in the auditory midbrain. J Neurophysiol. 103:3248–65. doi: 10.1152/jn.01131.2009. [DOI] [PMC free article] [PubMed] [Google Scholar]
- Sivaramakrishnan S, Oliver DL. Distinct K currents result in physiologically distinct cell types in the inferior colliculus of the rat. J Neurosci. 2001;21:2861–77. doi: 10.1523/JNEUROSCI.21-08-02861.2001. [DOI] [PMC free article] [PubMed] [Google Scholar]
- Suga N. Feature extraction in the auditoy system of bats. In: Moller AR, editor. Basic Mechanisms in Hearing. Academic Press; New York: 1973. pp. 675–744. [Google Scholar]
- Suga N, Schlegel P. Coding and processing in the auditory systems of FM- signal-producing bats. Journal of the Acoustical Society of America. 1973;54:174– 190. doi: 10.1121/1.1913561. [DOI] [PubMed] [Google Scholar]
- Suta D, Kvasnak E, Popelar J, Syka J. Representation of species-specific vocalizations in the inferior colliculus of the guinea pig. J Neurophysiol. 2003;90:3794–808. doi: 10.1152/jn.01175.2002. [DOI] [PubMed] [Google Scholar]
- Tan ML, Theeuwes HP, Feenstra L, Borst JG. Membrane properties and firing patterns of inferior colliculus neurons: an in vivo patch-clamp study in rodents. J Neurophysiol. 2007;98:443–53. doi: 10.1152/jn.01273.2006. [DOI] [PubMed] [Google Scholar]
- Thompson GC, Thompson AM, Garrett KM, Britton BH. Serotonin and serotonin receptors in the central auditory system. Otolaryngol Head Neck Surg. 1994;110:93–102. doi: 10.1177/019459989411000111. [DOI] [PubMed] [Google Scholar]
- Williams AJ, Fuzessery ZM. Multiple mechanisms shape FM sweep rate selectivity: complementary or redundant? Front Neural Circuits. 2012;6:54. doi: 10.3389/fncir.2012.00054. [DOI] [PMC free article] [PubMed] [Google Scholar]
- Woolley SM, Fremouw TE, Hsu A, Theunissen FE. Tuning for spectro- temporal modulations as a mechanism for auditory discrimination of natural sounds. Nat Neurosci. 2005;8:1371–9. doi: 10.1038/nn1536. [DOI] [PubMed] [Google Scholar]
- Xie R, Meitzen J, Pollak GD. Differing roles of inhibition in hierarchical processing of species-specific calls in auditory brainstem nuclei. J Neurophysiol. 2005;94:4019–37. doi: 10.1152/jn.00688.2005. [DOI] [PubMed] [Google Scholar]
- Xie R, Gittelman JX, Pollak GD. Rethinking tuning: in vivo whole-cell recordings of the inferior colliculus in awake bats. J Neurosci. 2007;27:9469–81. doi: 10.1523/JNEUROSCI.2865-07.2007. [DOI] [PMC free article] [PubMed] [Google Scholar]
- Xie R, Gittelman JX, Li N, Pollak GD. Whole cell recordings of intrinsic properties and sound-evoked responses from the inferior colliculus. Neuroscience. 2008;154:245–56. doi: 10.1016/j.neuroscience.2008.02.039. [DOI] [PubMed] [Google Scholar]
- Yang L, Pollak GD. Binaural inhibition in the dorsal nucleus of the lateral lemniscus of the mustache bat affects responses for multiple signals. Auditory Neuroscience. 1994;1:1–17. [Google Scholar]
- Yang L, Pollak GD. Features of ipsilaterally evoked inhibition in the dorsal nucleus of the lateral lemniscus. Hear Res. 1998;122:125–41. doi: 10.1016/s0378-5955(98)00088-4. [DOI] [PubMed] [Google Scholar]
- Yang L, Pollak GD, Resler C. GABAergic circuits sharpen tuning curves and modify response properties in the mustache bat inferior colliculus. J Neurophysiol. 1992;68:1760–74. doi: 10.1152/jn.1992.68.5.1760. [DOI] [PubMed] [Google Scholar]
- Ye CQ, Poo MM, Dan Y, Zhang XH. Synaptic mechanisms of direction selectivity in primary auditory cortex. J Neurosci. 30:1861–8. doi: 10.1523/JNEUROSCI.3088-09.2010. [DOI] [PMC free article] [PubMed] [Google Scholar]
- Yue Q, Casseday JH, Covey E. Response properties and location of neurons selective for sinusoidal frequency modulations in the inferior colliculus of the big brown bat. J Neurophysiol. 2007;98:1364–73. doi: 10.1152/jn.00432.2007. [DOI] [PubMed] [Google Scholar]
- Zhang LI, Tan AY, Schreiner CE, Merzenich MM. Topography and synaptic shaping of direction selectivity in primary auditory cortex. Nature. 2003;424:201–5. doi: 10.1038/nature01796. [DOI] [PubMed] [Google Scholar]