

Abstract
Background:
Higher plasma levels of leptin have been associated with increased cardiometabolic risk. The aim of this study was to investigate the association between short duration of sleep and hyperleptinemia in Taiwanese adults.
Methods:
We examined the association between duration of sleep and hyperleptinemia in 254 men and women recruited from the physical examination center at a regional hospital in southern Taiwan. Hyperleptinemia was defined as a plasma leptin level of 8.13 ng/mL and above. Short sleep duration was defined as < 6.5 h/day. Multiple logistic regression analysis was used to assess the association between short duration of sleep and hyperleptinemia.
Results:
In females, short duration of sleep (< 6.5 h/day; OR = 2.15, 95% CI = 0.99-4.78), greater hip circumference (OR = 3.00, CI = 1.13-8.78), higher percent body fat (OR = 1.75, CI = 1.07-2.95), and higher white blood cell counts (OR = 1.67, CI = 1.26-2.28) were associated with an increased risk of hyperleptinemia. In males, greater body weight was significantly associated with an increased risk of hyperleptinemia (OR = 3.55, 95% CI = 1.46-10.23). There was also a trend of association (p = 0.096) between short duration of sleep and an increased risk of hyperleptinemia (OR = 4.98, 95% CI = 0.80-42.40).
Conclusions:
In this study of healthy Taiwanese adults, short duration of sleep was significantly associated with hyperleptinemia in women, and the association was independent of adiposity.
Citation:
Koo M; Lai NS; Chiang JK. Short duration of sleep is associated with hyperleptinemia in Taiwanese adults. J Clin Sleep Med 2013;9(10):1049-1055.
Keywords: Sleep duration, leptin, leptin resistance, adiposity, gender
Leptin, first discovered in 1994, is a cytokine secreted by adipocytes that primarily regulates energy balance but also modulates inflammatory processes and other endocrine functions.1 Elevated plasma leptin levels (i.e., hyperleptinemia) have been demonstrated to correlate with a number of adverse conditions including insulin resistance, metabolic syndrome,2 type 2 diabetes,3 hypertension,4 myocardial infarction,5 stroke,6 depression,7 and Alzheimer disease.8
In humans, circulating leptin concentrations exhibit a strong circadian pattern and are influenced by acute changes in energy balance.9 Levels of leptin are also positively correlated with obesity and alcohol intake but negatively with cigarette smoking.10,11 In addition, despite a considerable variation exists among individuals, leptin concentrations are twofold to threefold higher in adult premenopausal females than in males.12 Leptin concentrations in umbilical cord blood are also significantly higher in female neonates compared with male counterparts, suggesting the presence of primary genetic effects, prenatal effects of sex steroids, or both.13 In adults, it was postulated that a suppressive effect of circulating androgens on leptin concentrations was responsible for sexual dimorphism.14
One area that has received much attention recently is the role of sleep duration and leptin levels. Sleep deprivation can affect the neuroendocrine regulation of appetite and food intake.15 However, the association between duration of sleep and leptin levels is still unclear. Results from laboratory studies have indicated reduced,16,17 no association,18,19 or increased20–23 leptin levels with short-term sleep restriction. The inconsistent findings among these studies can be explained, in part, by variations in the study samples, methods of sleep assessment, and whether caloric intake was controlled.
BRIEF SUMMARY
Current Knowledge/Study Rationale: Higher plasma levels of leptin could increase cardiometabolic risk, but the association between duration of sleep and hyperleptinemia is not clear. The aim of the current study was to investigate the association between short duration of sleep and hyperleptinemia in Taiwanese adults.
Study Impact: The study demonstrated that short duration of sleep was significantly associated with hyperleptinemia in females, independent of adiposity.
Regarding the effects of habitual sleep duration, an epidemiologic study of 721 adults showed lower leptin levels were associated with shorter self-reported habitual sleep duration. The association remained significant after adjusting for body mass index, sex, age, and other possible confounding factors.24 In view of the role of leptin in various cardiometabolic disorders, understanding the effects of habitual sleep duration on leptin is of clinical relevance. Therefore, the aim of this study was to explore the association of sleep duration and hyperleptinemia in healthy Taiwanese adults.
METHODS
Study subjects were individuals recruited from the physical examination center at a regional hospital in southern Taiwan between July 2010 and June 2012. The study was approved by the Institutional Review Board of the Buddhist Dalin Tzu Chi Hospital (No. B09901018). Written informed consent was obtained from all participants after full explanation of the study procedure.
Demographic information of the subjects including age, sex, body weight, height, waist circumference, hip circumference, and duration of sleep was assessed using a questionnaire administered face-to-face by a trained research assistant. Mean duration of sleep per day was calculated as [(5/7 × duration of sleep per day during weekday) + (2/7 × duration of sleep per day during weekend)].25 Clinical characteristics were recorded, including white blood cell count, creatinine, fasting glucose, total cholesterol, high-density lipoprotein cholesterol (HDL-C), low-density lipoprotein cholesterol (LDL-C), triglycerides, and leptin. The methods used were described in previous study.26,27 Leptin was measured by radioimmunoassay using commercially available kits (Millipore, Missouri, USA). A plasma leptin level above the upper quartile of the observed data was considered as hyperleptinemia in this study.28
Statistical Analysis
Statistical analysis was performed using R (Version 2.15.1). Two-sided p-value ≤ 0.05 was considered statistically significant. Since sexual dimorphism in leptin concentrations has been well documented in human adults,29,30 the data were analyzed separately for males and females.
Categorical variables were analyzed using χ2 test, and continuous variables were compared using t-test or Wilcoxon rank-sum test, as appropriate. Univariate logistic regression analysis was used to evaluate the association between hyperleptinemia and the independent variables. Multiple logistic regression analysis with stepwise procedure was conducted to examine the significant independent variables of hyperleptinemia. To ensure the quality of analysis, basic model-fitting techniques for variable selection, goodness-of-fit assessment, and regression diagnostics were applied. Specifically, the independent variables in the univariate logistic regression analysis were first evaluated using stepwise variable selection procedure with significance levels for entry (SLE) and stay (SLS) set to 0.15. Then, with the aid of substantive knowledge, the best candidate final regression model was identified manually by dropping the covariates with p value > 0.05 one at a time until all regression coefficients were significantly different from 0. In addition, Nagelkerke R2 and the Hosmer-Lemeshow test were used to examine goodness-of-fit of the models. Residual analysis and detection of influential cases and multicollinearity were also applied for diagnosis of model or data problems.
The optimal cutoff point of mean sleep duration was determined using nonparametric smoothing from generalized additive model after adjusting of significant covariates by an iterative approach. A receiver-operating characteristic (ROC) curves analysis was conducted. Sensitivity, specificity, and positive and negative predictive values were estimated. The optimal cutoff was calculated as the minimum value of the square root of [(1 − sensitivity)2 + (1 − specificity)2], using the pROC coords function in R with the “closest.topleft” option selected. Plots of the sensitivity (true positive) versus 1 − specificity (false positive) were made and the overall diagnostic accuracy was quantified using areas under the curves (AUCs).
RESULTS
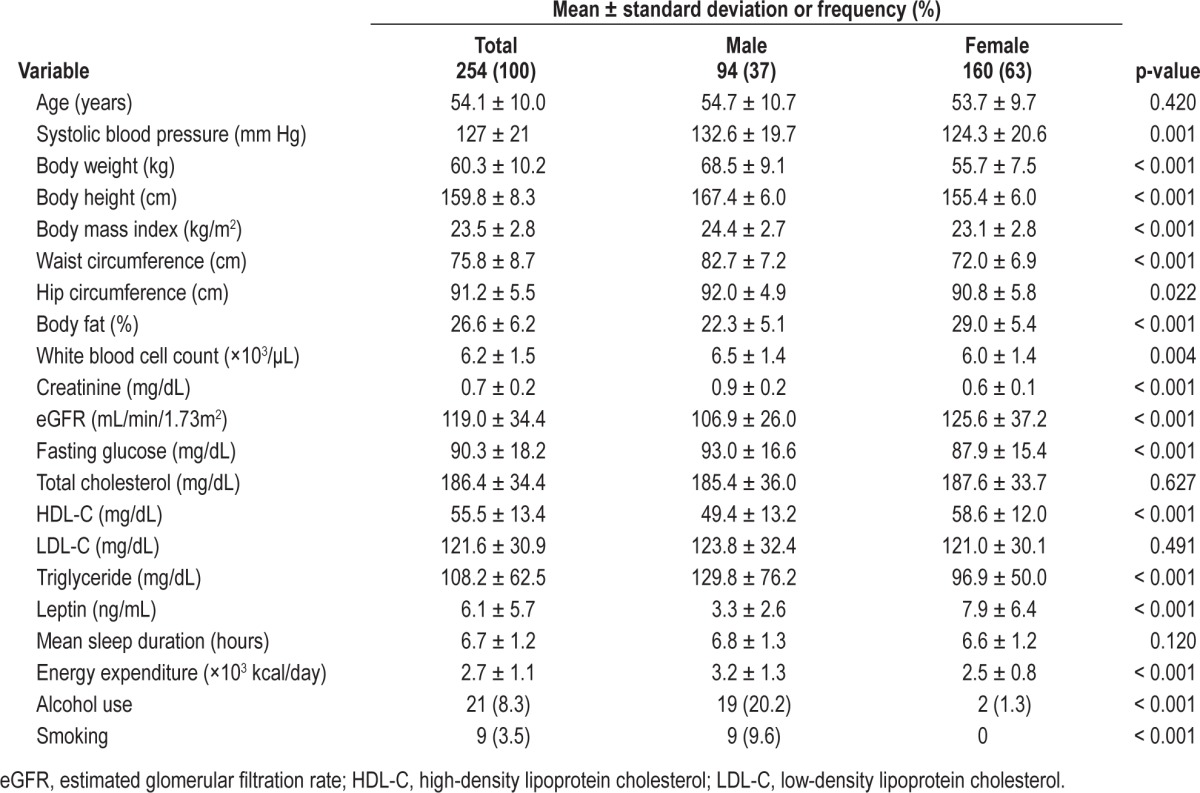
Basic characteristics of the 254 study subjects were listed in Table 1. The mean leptin level was 6.1 ng/mL. The median was 4.46 ng/mL, and the lower and upper quartiles were 2.53 ng/ mL and 8.13 ng/mL, respectively. The upper quartile value was considered as the cutoff point for hyperleptinemia in this study.
Table 1.
Demographic and clinical characteristics of the study subjects (n = 254)
Results of the univariate analysis for hyperleptinemia separately for males and females are shown in Table 2. In both males and females, greater body weight, body mass index, waist circumference, hip circumference, and percent body fat were significantly associated with an increased risk of hyperleptinemia. In addition, higher levels of triglycerides were significantly associated with an increased risk of hyperleptinemia in males, while a higher white blood cell count was significantly associated with an increased risk of hyperleptinemia in females.
Table 2.
Univariate logistic regression analysis of hyperleptinemia for males and females
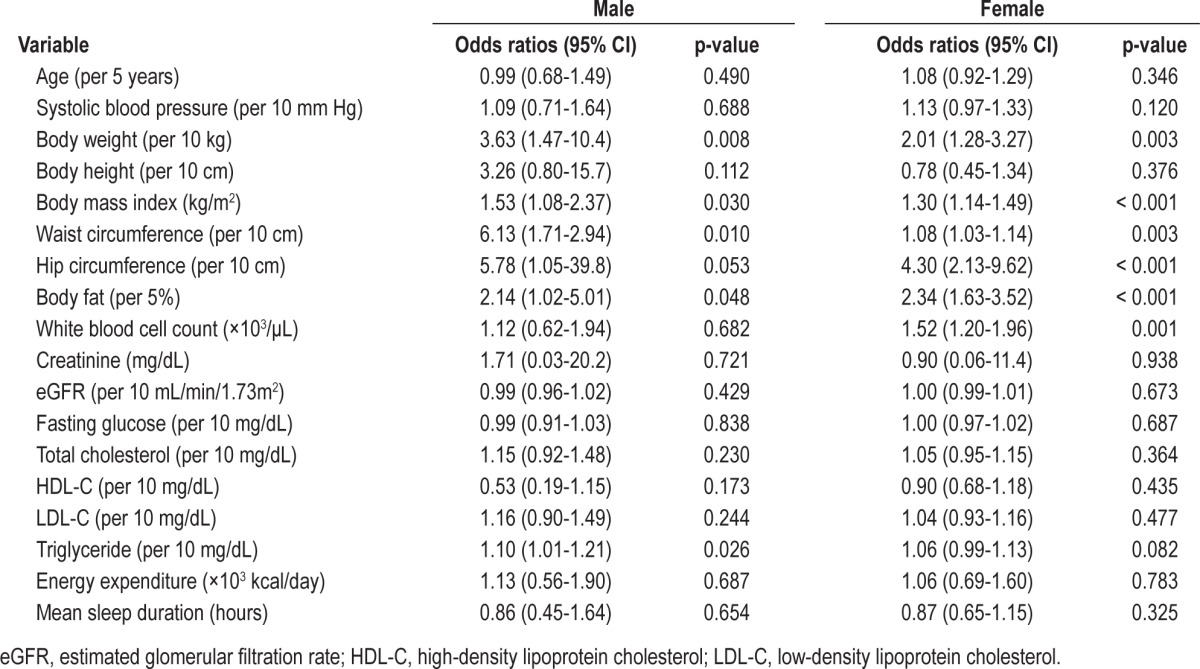
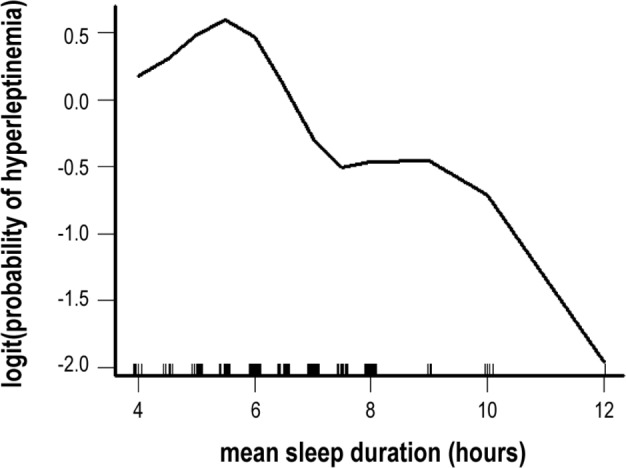
Table 3 presents the findings from the multiple logistic regression analysis for males and females. An optimal cutoff point for sleep duration was found to be 6.5 h/day, based on nonparametric smoothing from generalized additive model of our study sample (Figure 1).
Table 3.
Multiple logistic regression analysis of hyperleptinemia for males and females
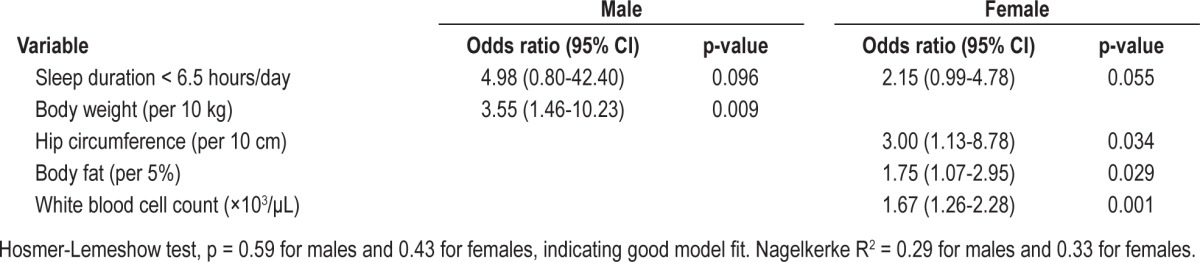
Figure 1. Plot of covariate-adjusted nonparametric smoothing from generalized additive model of sleep duration and probability of hyperleptinemia.
In females, short duration of sleep (< 6.5 h/day; OR = 2.15, 95% CI = 0.99-4.78), was associated with an increased risk of hyperleptinemia. A similar but weaker trend of association (p = 0.096) was observed in males (OR = 4.98, 95% CI = 0.80-42.40). Of the several anthropometric measurements, only a greater body weight was significantly associated with an increased risk of hyperleptinemia in males (OR = 3.55 per 10-kg increment, 95% CI = 1.46-10.23), while a greater hip circumference (OR = 3.00 per 10-cm increment, 95% CI = 1.13-8.78) and greater percent body fat (OR = 1.75 per 5% increment, 95% CI = 1.07-2.95) were associated with an increased risk of hyperleptinemia in females. Furthermore, a higher white blood cell count was significantly associated with an increased risk of hyperleptinemia in females (OR = 1.67, 95% CI = 1.26-2.28).
ROC curve analyses revealed that a cutoff value of 6.5 h/day for mean duration of sleep yielded a sensitivity of 83% (95% CI = 36% to 96%), a specificity of 77% (95% CI = 67% to 86%), a positive predictive value (PPV) of 20% (95% CI = 7% to 41%), a negative predictive value (NPV) of 99% (95% CI = 92% to 100%), and an AUC of 0.88 (95% CI = 0.77-0.99) for the prediction of hyperleptinemia in males (Figure 2). In females, the sensitivity, specificity, PPV, NPV, and AUC were 67% (95% CI = 54% to 79%), 78% (95% CI = 68% to 85%), 63% (95% CI = 50% to 75%), 81% (95% CI = 71% to 88%), and 0.80 (95% CI = 0.73-0.87), respectively.
Figure 2. Receiver-operating characteristic curves for short duration of sleep (< 6.5 h/day) in predicting hyperleptinemia in males and females.

DISCUSSION
In this cross-sectional study of generally healthy Taiwanese adults, we found that short duration of sleep was associated with hyperleptinemia, particularly in females. The risk of hyperleptinemia was 2.2 times greater in females with sleep duration of less than 6.5 hours a day than those with a longer duration. Since the association was adjusted for adiposity, the independent effect of short duration of sleep on leptin levels suggested that the elevation in leptin levels might have been a primary increase in response to reduced duration of sleep rather than a secondary increase in an attempt to overcome end-organ leptin resistance.
The mean leptin levels in females were more than twice of that in males, similar to the findings in other studies.12,19,31 This sexual dimorphism in leptin levels among adults has been suggested to mediate, in part, by effects of sex steriods.32 In addition, the observations that leptin levels were approximately twofold higher in female neonates compared with male counterparts suggested that primary genetic determinants and prenatal effects of endogenous androgen concentrations might play a role in sexual dimorphism.33
A finding in this study that deserves additional consideration was the different independent factors associated with short duration of sleep between males and females. The risk of hyperleptinemia in females was 2.2 times higher in those with duration of sleep of less than 6.5 hours (p = 0.055). In males, although the association did not reach statistical significance (p = 0.096), the magnitude of the odds ratio was larger than that of the association in females. The wide confidence interval, as a result of fewer males in our sample and fewer males being classified with hyperleptinemia, precluded a definite conclusion among males (OR = 4.98, 95% CI = 0.80-42.40).
In contrast to our study, previous reports that involved both male and female subjects either did not report the sex results separately or found no differences between the sexes in the association between sleep and leptin among obese subjects.19,20,23 In three short-term laboratory studies that reported a lack of association18 and decreased16,17 serum leptin levels with sleep curtailment, the participants consisted of only males. In addition, energy intake was restricted in these studies, which might have led to an increased leptin response to the restricted calories.34 On the other hand, in two short-term sleep deprivation studies conducted on female participants, sleep restriction was associated with increased morning plasma leptin concentrations.21,22 Clearly, additional studies are deserved to delineate the differences between males and females in the association between leptin levels and habitual short sleep duration and, in particular, whether the observed sex differences were related to biological factors such as the interactions of leptin with gonadal steroids or the results of modification of dietary behavior in response to habitual sleep deprivation.35
Results of multiple logistic regression analysis also indicated, as expected, an independent association between greater adiposity, as reflected by hip circumference and percent body fat in females and body weight in males. In a cross-sectional study of 1,393 adult patients, a strong direct relationship between increased leptin levels and increased percent body fat was observed. Percent body fat was measured by duel-energy x-ray absorptiometry (DXA) in the study.36 In another population-based study of 1,234 Chinese adults, correlation analysis revealed that serum leptin concentrations were significantly associated with a number of adiposity measures. Of those measures, body mass index and triceps skinfold showed the strongest association in men and women, respectively.37
Higher white blood cell counts were significantly associated with hyperleptinemia among females in our study. A cross-sectional study of 1,480 type 2 diabetic patients also reported that plasma leptin levels were significantly associated with total white blood cell counts.38 In vitro studies indicated that leptin at the concentration at 50 to 100 ng/mL could significantly stimulate the appearance of granulocyte-macrophage colonies.39 Based on the variables obtained from our multiple logistic regression modeling, the probability of hyperleptinemia in males and females could be estimated according to the formula provided in the appendix.
Several limitations of our study deserve mention. First, leptin levels were measured with only a single blood draw during routine physical examinations, which occurred between 14:00 and 16:00. This methodology might not have adequately reflected the diurnal variations of leptin in response to sleep restriction. Second, duration of habitual sleep was ascertained by self-report and might be subject to recall error. Nevertheless, self-report duration of sleep can readily be obtained from patients in a single visit, thus making our prediction tool more practical for clinical use. Third, though the analyses were adjusted for several potential confounding variables, the presence of unrecognized ones is always possible.
In conclusion, a significant association was observed between short duration of sleep and hyperleptinemia in healthy Taiwanese adults and the association was independent of adiposity. Since sleep curtailment is highly prevalent in modern societies, its associations with hyperleptinemia, and in turn, the potential adverse impact on metabolic and endocrine processes, can have important clinical implications. Future studies will be needed to clarify the role of sleep duration as a modifiable risk factor on the effects of leptin on metabolic health.
DISCLOSURE STATEMENT
This was not an industry supported study. The authors have indicated no financial conflicts of interest. Work was performed at Buddhist Dalin Tzu Chi Hospital.
ACKNOWLEDGMENTS
Dr. Chiang received research grants from Buddhist Dalin Tzu Chi Hospital (DTCRD 99(2)-E-05).
APPENDIX
Programming code in OpenOffice Calc, Microsoft Excel, and R environment for calculating the probability of hyperleptinemia (leptin > 8.13 ng/mL) based on our multiple logistic regression model.

REFERENCES
- 1.Martin SS, Qasim A, Reilly MP. Leptin resistance: a possible interface of inflammation and metabolism in obesity-related cardiovascular disease. J Am Coll Cardiol. 2008;529:1201–10. doi: 10.1016/j.jacc.2008.05.060. [DOI] [PMC free article] [PubMed] [Google Scholar]
- 2.Chiu FH, Chuang CH, Li WC, et al. The association of leptin and C-reactive protein with the cardiovascular risk factors and metabolic syndrome score in Taiwanese adults. Cardiovasc Diabetol. 2012;11:40. doi: 10.1186/1475-2840-11-40. [DOI] [PMC free article] [PubMed] [Google Scholar]
- 3.Söderberg S, Zimmet P, Tuomilehto J, et al. Leptin predicts the development of diabetes in Mauritian men, but not women: a population-based study. Int J Obes. 2007;31:1126–33. doi: 10.1038/sj.ijo.0803561. [DOI] [PubMed] [Google Scholar]
- 4.Barba G, Russo O, Siani A, et al. Plasma leptin and blood pressure in men: graded association independent of body mass and fat pattern. Obes Res. 2003;11:160–6. doi: 10.1038/oby.2003.25. [DOI] [PubMed] [Google Scholar]
- 5.Söderberg S, Ahrén B, Jansson JH, et al. Leptin is associated with increased risk of myocardial infarction. J Intern Med. 1999;246:409–18. doi: 10.1046/j.1365-2796.1999.00571.x. [DOI] [PubMed] [Google Scholar]
- 6.Söderberg S, Ahrén B, Stegmayr B, et al. Leptin is a risk marker for first-ever hemorrhagic stroke in a population-based cohort. Stroke. 1999;30:328–37. doi: 10.1161/01.str.30.2.328. [DOI] [PubMed] [Google Scholar]
- 7.Milaneschi Y, Simonsick EM, Vogelzangs N, et al. Leptin, abdominal obesity, and onset of depression in older men and women. J Clin Psychiatry. 2012;73:1205–11. doi: 10.4088/JCP.11m07552. [DOI] [PMC free article] [PubMed] [Google Scholar]
- 8.Tezapsidis N, Johnston JM, Smith MA, et al. Leptin: a novel therapeutic strategy for Alzheimer's disease. J Alzheimers Dis. 2009;16:731–40. doi: 10.3233/JAD-2009-1021. [DOI] [PMC free article] [PubMed] [Google Scholar]
- 9.Chin-Chance C, Polonsky KS, Schoeller DA. Twenty-four-hour leptin levels respond to cumulative short-term energy imbalance and predict subsequent intake. J Clin Endocrinol Metab. 2000;85:2685–91. doi: 10.1210/jcem.85.8.6755. [DOI] [PubMed] [Google Scholar]
- 10.Considine RV, Sinha MK, Heiman ML, et al. Serum immunoreactiveleptin concentrations in normal-weight and obese humans. N Engl J Med. 1996;334:292–5. doi: 10.1056/NEJM199602013340503. [DOI] [PubMed] [Google Scholar]
- 11.Mantzoros CS, Liolios AD, Tritos NA, et al. Circulating insulin concentrations, smoking, and alcohol intake are important independent predictors of leptin in young healthy men. Obes Res. 1998;6:179–86. doi: 10.1002/j.1550-8528.1998.tb00335.x. [DOI] [PubMed] [Google Scholar]
- 12.Hickey M, Israel R, Gardiner S, et al. Gender differences in serum leptin levels in humans. Biochem Mol Med. 1996;59:1–6. doi: 10.1006/bmme.1996.0056. [DOI] [PubMed] [Google Scholar]
- 13.Tome MA, Lage M, Camiña JP, Garcia-Mayor RV, Dieguez C, Casanueva FF. Sex-based differences in serum leptin concentrations from umbilical cord blood at delivery. Eur J Endocrinol. 1997;137:655–8. doi: 10.1530/eje.0.1370655. [DOI] [PubMed] [Google Scholar]
- 14.Rosenbaum M, Nicolson M, Hirsch J, et al. Effects of gender, body composition, and menopause on plasma concentrations of leptin. J Clin Endocrinol Metab. 1996;81:3424–7. doi: 10.1210/jcem.81.9.8784109. [DOI] [PubMed] [Google Scholar]
- 15.Copinschi G. Metabolic and endocrine effects of sleep deprivation. Essent Psychopharmacol. 2005;6:341–7. [PubMed] [Google Scholar]
- 16.Spiegel K, Leproult R, L'hermite-Balériaux M, Copinschi G, Penev PD, Van Cauter E. Leptin levels are dependent on sleep duration: relationships with sympathovagal balance, carbohydrate regulation, cortisol, and thyrotropin. J Clin Endocrinol Metab. 2004;89:5762–71. doi: 10.1210/jc.2004-1003. [DOI] [PubMed] [Google Scholar]
- 17.Spiegel K, Tasali E, Penev P, Van Cauter E. Sleep curtailment in healthy young men is associated with decreased leptin levels, elevated ghrelin levels, and increased hunger and appetite. Ann Intern Med. 2004;141:846–50. doi: 10.7326/0003-4819-141-11-200412070-00008. [DOI] [PubMed] [Google Scholar]
- 18.Schmid SM, Hallschmid M, Jauch-Chara K, Born J, Schultes B. A single night of sleep deprivation increases ghrelin levels and feelings of hunger in normal-weight healthy men. J Sleep Res. 2008;17:331–4. doi: 10.1111/j.1365-2869.2008.00662.x. [DOI] [PubMed] [Google Scholar]
- 19.Knutson KL, Galli G, Zhao X, Mattingly M, Cizza G. NIDDK Sleep Extension Study. No association between leptin levels and sleep duration or quality in obese adults. Obesity. 2011;19:2433–5. doi: 10.1038/oby.2011.248. [DOI] [PMC free article] [PubMed] [Google Scholar]
- 20.Pejovic S, Vgontzas AN, Basta M, et al. Leptin and hunger levels in young healthy adults after one night of sleep loss. J Sleep Res. 2010;19:552–8. doi: 10.1111/j.1365-2869.2010.00844.x. [DOI] [PMC free article] [PubMed] [Google Scholar]
- 21.Simpson NS, Banks S, Dinges DF. Sleep restriction is associated with increased morning plasma leptin concentrations, especially in women. Biol Res Nurs. 2010;12:47–53. doi: 10.1177/1099800410366301. [DOI] [PMC free article] [PubMed] [Google Scholar]
- 22.Omisade A, Buxton OM, Rusak B. Impact of acute sleep restriction on cortisol and leptin levels in young women. Physiol Behav. 2010;99:651–6. doi: 10.1016/j.physbeh.2010.01.028. [DOI] [PubMed] [Google Scholar]
- 23.Hayes AL, Xu F, Babineau D, Patel SR. Sleep duration and circulating adipokine levels. Sleep. 2011;34:147–52. doi: 10.1093/sleep/34.2.147. [DOI] [PMC free article] [PubMed] [Google Scholar]
- 24.Taheri S, Lin L, Austin D, Young T, Mignot E. Short sleep duration is associated with reduced leptin, elevated ghrelin, and increased body mass index. PLoS Med. 2004;1:e62. doi: 10.1371/journal.pmed.0010062. [DOI] [PMC free article] [PubMed] [Google Scholar]
- 25.Patel SR, Zhu X, Storfer-Isser A, et al. Sleep duration and biomarkers of inflammation. Sleep. 2009;32:200–4. doi: 10.1093/sleep/32.2.200. [DOI] [PMC free article] [PubMed] [Google Scholar]
- 26.Chang JK, Koo M, Kao VY, Chiang JK. Association of sleep duration and insulin resistance in Taiwanese vegetarians. BMC Public Health. 2012;12:666. doi: 10.1186/1471-2458-12-666. [DOI] [PMC free article] [PubMed] [Google Scholar]
- 27.Chiang JK, Koo M. Lipid accumulation product: a simple and accurate index for predicting metabolic syndrome in Taiwanese people aged 50 and over. BMC Cardiovasc Disord. 2012;12:78. doi: 10.1186/1471-2261-12-78. [DOI] [PMC free article] [PubMed] [Google Scholar]
- 28.Ukkola O, Kesäniemi YA. Leptin and high-sensitivity C-reactive protein and their interaction in the metabolic syndrome in middle-aged subjects. Metabolism. 2007;56:1221–7. doi: 10.1016/j.metabol.2007.04.019. [DOI] [PubMed] [Google Scholar]
- 29.Saad MF, Damani S, Gingerich RL, et al. Sexual dimorphism in plasma leptin concentration. J Clin Endocrinol Metab. 1997;82:579–84. doi: 10.1210/jcem.82.2.3739. [DOI] [PubMed] [Google Scholar]
- 30.Martin LJ, Mahaney MC, Almasy L, et al. Leptin's sexual dimorphism results from genotype by sex interactions mediated by testosterone. Obes Res. 2002;10:14–21. doi: 10.1038/oby.2002.3. [DOI] [PubMed] [Google Scholar]
- 31.Chow VT, Phoon MC. Measurement of serum leptin concentrations in university undergraduates by competitive ELISA reveals correlations with body mass index and sex. Adv Physiol Educ. 2003;27:70–7. doi: 10.1152/advan.00001.2003. [DOI] [PubMed] [Google Scholar]
- 32.Horlick MB, Rosenbaum M, Nicolson M, et al. Effect of puberty on the relationship between circulating leptin and body composition. J Clin Endocrinol Metab. 2000;85:2509–18. doi: 10.1210/jcem.85.7.6689. [DOI] [PubMed] [Google Scholar]
- 33.Matsuda J, Yokota I, Iida M, et al. Serum leptin concentrations in cord blood: relationship to birth weight and gender. J Clin Endocrinol Metab. 1997;82:1642–4. doi: 10.1210/jcem.82.5.4063. [DOI] [PubMed] [Google Scholar]
- 34.Penev PD. Short sleep and circulating adipokine concentrations: does the fat hit the fire? Sleep. 2011;34:131–2. doi: 10.1093/sleep/34.2.131. [DOI] [PMC free article] [PubMed] [Google Scholar]
- 35.Chapman CD, Benedict C, Brooks SJ, Schiöth HB. Lifestyle determinants of the drive to eat: a meta-analysis. Am J Clin Nutr. 2012;96:492–7. doi: 10.3945/ajcn.112.039750. [DOI] [PMC free article] [PubMed] [Google Scholar]
- 36.Shah NR, Braverman ER. Measuring adiposity in patients: the utility of body mass index (BMI), percent body fat, and leptin. PLoS One. 2012;7:e33308. doi: 10.1371/journal.pone.0033308. [DOI] [PMC free article] [PubMed] [Google Scholar]
- 37.Zuo H, Shi Z, Yuan B, Dai Y, Wu G, Hussain A. Association between serum leptin concentrations and insulin resistance: a population-based study from China. PLoS One. 2013;8:e54615. doi: 10.1371/journal.pone.0054615. [DOI] [PMC free article] [PubMed] [Google Scholar]
- 38.Chung FM, Tsai JC, Chang DM, Shin SJ, Lee YJ. Peripheral total and differential leukocyte count in diabetic nephropathy: the relationship of plasma leptin to leukocytosis. Diabetes Care. 2005;28:1710–7. doi: 10.2337/diacare.28.7.1710. [DOI] [PubMed] [Google Scholar]
- 39.Laharrague P, Oppert JM, Brousset P, et al. High concentration of leptin stimulates myeloid differentiation from human bone marrow CD34+ progenitors: potential involvement in leukocytosis of obese subjects. Int J Obes Relat Metab Disord. 2000;24:1212–6. doi: 10.1038/sj.ijo.0801377. [DOI] [PubMed] [Google Scholar]