

Abstract
Introduction
Cerebral small vessel disease (CSVD) is thought to contribute to cognitive dysfunction in patients with mild cognitive impairment (MCI). The underlying mechanisms, and more specifically, the effects of CSVD on brain functioning in MCI are incompletely understood. The objective of the present study was to examine the effects of CSVD on brain functioning, activation and deactivation, in patients with MCI using task-related functional MRI (fMRI).
Methods
We included 16 MCI patients with CSVD, 26 MCI patients without CSVD and 25 controls. All participants underwent a physical and neurological examination, neuropsychological testing, structural MRI, and fMRI during a graded working memory paradigm.
Results
MCI patients with and without CSVD had a similar neuropsychological profile and task performance during fMRI, but differed with respect to underlying (de)activation patterns. MCI patients with CSVD showed impaired deactivation in the precuneus/posterior cingulate cortex, a region known to be involved in the default mode network. In MCI patients without CSVD, brain activation depended on working memory load, as they showed relative ‘hyperactivation’ during vigilance, and ‘hypoactivation’ at a high working memory load condition in working memory related brain regions.
Conclusions
We present evidence that the potential underlying mechanism of CSVD affecting cognition in MCI is through network interference. The observed differences in brain activation and deactivation between MCI patients with and without CSVD, who had a similar ‘clinical phenotype’, support the view that, in patients with MCI, different types of pathology can contribute to cognitive impairment through different pathways.
Keywords: Mild cognitive impairment, Cerebral small vessel disease, Functional MRI, Working memory, Default mode network
1. Introduction
Mild cognitive impairment (MCI) is a clinical construct that classifies individuals with cognitive impairment and high risk of dementia (DeCarli, 2003; Petersen, 2004; Albert et al., 2011). While MCI is a heterogeneous condition, it was found that Alzheimer's disease (AD) and Vascular dementia (VaD) are the most common clinical endpoints, and consequently either Alzheimer pathology, cerebral vascular pathology, or a combination of the two, underlies the great majority of MCI cases (Petersen et al., 2001; Meyer et al., 2002; Mitchell and Shiri-Feshki, 2009). The most common type of cerebrovascular pathology is cerebral small vessel disease (CSVD). The consequence of this condition on the brain parenchyma is damage to the white matter and subcortical gray matter structures, visible on MRI as white matter hyperintensities (WMH) and lacunar infarcts (Pantoni, 2010). In MCI patients, CSVD has been associated with cognitive deficits including reduced mental speed, impaired executive functioning, and deficits in working and episodic memory (Galluzzi et al., 2005; Nordahl et al., 2005; Nordlund et al., 2007; Luchsinger et al., 2009; Villeneuve et al., 2011). Whereas Alzheimer pathology is known to cause cognitive deficits by affecting cortical brain regions, the mechanisms through which CSVD contributes to cognitive impairment are still a matter of debate. It has been postulated that the link between CSVD and cognitive impairment lies in frontal lobe functioning, CSVD causing cognitive impairment through disconnection of cortico-striatal loops resulting in frontal lobe dysfunction (Cummings, 1993; Pugh and Lipsitz, 2002; Tullberg et al., 2004). This hypothesis is supported by results from a recent task-related functional MRI (fMRI) study in healthy elderly with CSVD, that showed an association between the extent of vascular burden, impaired brain deactivation and lower functional connectivity in the prefrontal cortex (Mayda et al., 2011). While the analyses in this study were limited to frontal regions of interest (ROI) and effects of CSVD on brain functioning in the rest of the brain remained unclear, the study does postulate a relationship between structural white matter integrity and neural network functioning underlying cognitive deterioration. Several recent studies have examined this relationship within the default mode network (DMN) (for a review see Damoiseaux and Greicius, 2009), a network of brain regions including the medial prefrontal cortex, posterior cingulate cortex (PCC)/precuneus, anterior cingulate cortex (ACC), hippocampus and inferior parietal lobule, found to be actively suppressed, i.e. deactivated, during the performance of cognitive tasks (Raichle et al., 2001; Greicius et al., 2003; Buckner et al., 2008). These studies using a combination of resting state fMRI and diffusion tensor imaging (DTI) show that functional connectivity and network functioning are largely dependent on white matter structural integrity (Damoiseaux and Greicius, 2009).
The objective of this study was to examine the role of CSVD on brain functioning in MCI. For this purpose we assessed fMRI activation as well as deactivation patterns during an n-back working memory paradigm in MCI patients with and without CSVD. This paradigm is heavily dependent upon the frontal lobe (Braver et al., 1997), and was previously found to be effective in examining deactivation within the DMN in MCI (Kochan et al., 2010). We hypothesized that the presence of CSVD in MCI will result in differences in brain functioning, and, considering the findings of reduced functional connectivity in healthy elderly with CSVD (Mayda et al., 2011), as well as a relationship between DMN functioning and white matter integrity (Damoiseaux and Greicius, 2009), we furthermore hypothesized that CSVD will affect brain regions involved in network functioning. To address this hypothesis we examined specifically deactivation during cognitive functioning in regions involved in the DMN in MCI patients with CSVD, MCI patients without CSVD and controls by means of ROI analysis. This ROI analysis was based on a priori defined brain regions known to be involved in the DMN, in conjunction with results in controls.
2. Methods
2.1. Participants
We recruited MCI patients, aged 65 years or older, from outpatient clinics of the departments of Geriatrics and Neurology of Erasmus MC, University Medical Center Rotterdam, the Netherlands, and 7 surrounding hospitals on the basis of criteria for MCI by Petersen (Petersen and Morris, 2005). These criteria include: 1) presence of cognitive complaint by patient or relatives; 2) impairment in one or more cognitive domains; 3) preserved overall general functioning, with possible increased difficulty in the performance of activities of daily living; and 4) absence of dementia according to the DSM-IV or NINCS ADRDA criteria for dementia. We screened 57 MCI patients for study eligibility. Exclusion criteria were a history of a neurological or psychiatric disorder negatively affecting cognition (e.g. major stroke, cerebral tumor or depression) and contraindication for MRI (e.g. metal implants and claustrophobia). After the initial screening we invited 55 MCI patients to participate in the present study. All patients underwent a standardized work-up, including physical and neurological examination, extensive neuropsychological assessment, structural and functional MRI scanning. After the MRI examinations, we excluded 2 patients due to physical inability or refusal to undergo MRI when presented with the MRI scanner, 1 MCI patient because of excessive head movement (movement more than 1 voxel, 3 mm), 2 patients with vision problems, and 8 patients based on insufficient fMRI task performance (as described below). We included the remaining 42 patients in our analyses. Controls (n = 25; 65 years or older) were either relatives of MCI patients, or were recruited through advertisement in the Erasmus MC, University Medical Center. The same in- and exclusion criteria applied to the controls, except that controls did not have cognitive complaints and a neuropsychological profile within normal boundaries. Controls underwent the exact same work-up as the MCI patients. All participants gave written informed consent to our protocol that was approved by the medical ethics committee of the Erasmus MC, University Medical Center, Rotterdam.
2.2. Structured interview and physical examination
We collected data on demographics, general functioning, activities of daily living and vascular risk factors by means of a structured interview. Level of education was assessed with a Dutch education scale ranging from 1 (less than 6 years elementary school) to 7 (academic degree) (Verhage, 1964). We defined hypertension as a systolic blood pressure ≥ 160 mm Hg or diastolic blood pressure ≥ 90 mm Hg or the use of antihypertensive medication, and determined Apoliproprotein E (APOE) genotype in all participants.
2.3. Neuropsychological assessment
Trained neuropsychologists administered a standardized battery of neuropsychological tests to all participants. The battery included the MMSE as a global cognitive screening method; the Dutch version of the Rey Auditory Verbal Learning Test, the 15-word verbal learning test (15-WVLT) and the stories of the Rivermead Behavioural Memory Test (RBMT) to assess memory; the Trail Making Test (TMT) part A and Stroop II as measures of cognitive processing speed; the TMT part B, Stroop III, the modified Wisconsin Card Sorting Test (WCST), and a phonological fluency task to assess executive functioning; the Boston Naming Test (BNT; 60 items version) and semantic fluency tasks (animals and occupations) to measure word finding difficulties and lexical retrieval; the subtest Block Design of the Wechsler Adult Intelligence Scale III and clock drawing to assess visuo-spatial and visuo-constructive ability respectively. For every neuropsychological test we calculated z-scores, using the mean and standard deviation of the test scores from the control group (z-score = individual test score minus mean divided by the standard deviation). Subsequently, we constructed composite scores for the following cognitive domains: memory (15 WVLT and RBMT immediate recall and delayed recall), information processing speed (TMTA and Stroop II), executive functioning (TMTB and Stroop III), and language (BNT and semantic fluency tasks). Visuo-spatial skills and visuo-constructive ability are each represented by a single neuropsychological test, and consisted of z scores of the Block Design test and clock drawing test respectively. We defined impairment in a cognitive domain as a z-score of − 1.5 below the mean score of controls in that domain.
2.4. MRI acquisition protocol
We performed structural and functional MR imaging on a 3.0 T MRI scanner with an 8-channel head coil (HD platform, GE Healthcare, Milwaukee, US). High resolution 3 dimensional (3D) inversion recovery fast spoiled gradient recalled T1-weighted structural MRI was acquired in the axial plane with the following parameters: repetition time (TR) = 10.4 ms, echo time (TE) = 2.1 ms, inversion time (TI) = 300 ms, flip angle 18°, acquisition matrix 416 × 256, field of view (FOV) 250 × 175 mm2. We acquired 192 slices with a slice thickness of 1.6 mm with 0.8 mm overlap in a total acquisition time of 4:57 min. T2-fluid attenuated inversion recovery (FLAIR) images were obtained with the following parameters: TR = 8000 ms, TE = 120 ms, TI 2000 ms, acquisition matrix 256 × 128 mm2, FOV 210 × 210 mm2. We acquired 64 contiguous slices with a slice thickness of 2.5 mm in a total acquisition time of 3:13 min. Whole brain functional MRI images were obtained with a single shot T2* weighted echo-planar imaging (EPI) sequence sensitive to blood oxygenated level dependent (BOLD) contrast with the parameters: TR = 2500 ms, TE = 30 ms, flip angle 75°, acquisition matrix 64 × 96, FOV 250 × 250 mm2. We acquired 32 contiguous slices with a slice thickness of 3.5 mm. The total acquisition time was 6:43 min. Functional data acquisition included 5 dummy scans, which we discarded from further analysis.
2.5. Visual assessment of lacunar infarcts and WMH on MRI
A neurologist (NDP), experienced in the assessment of CSVD on MRI, assessed lacunar infarcts and WMH through visual inspection of the 3D T1-weighted and T2-FLAIR MRI images, blinded for clinical information. We used the semi-quantitative rating scale of Fazekas to rate the presence and severity of WMH and recorded the number of lacunar infarcts on MRI (Fazekas et al., 2002). Lacunar infarcts were defined as subcortical infarcts smaller than 20 mm in size (Fisher, 1982). Based on the definition used in other studies (Frisoni et al., 2002; Nordlund et al., 2007), we defined the presence of CSVD as the presence of severe WMH (Fazekas score 2 or higher) affecting both posterior and anterior white matter regions, and/or the presence of two or more lacunar infarcts on MRI. We subsequently classified MCI patients as MCI patients with CSVD (n = 16), or MCI patients without CSVD (n = 26).
2.6. Automated MRI brain tissue segmentation and volumetric analysis of WML and hippocampi
Based on intensities of the 3D T1-weighted and T2-FLAIR MRI scans, we used a validated k-nearest neighbor classifier to automatically classify tissues into cerebrospinal fluid, gray matter, normal appearing white matter and WMH (Vrooman et al., 2007; de Boer et al., 2009). The hippocampus was segmented using the 3D T1-weighted image by means of an automated method as described previously (van der Lijn et al., 2008; den Heijer et al., 2010). Briefly, the two most important components of this method are a statistical intensity model and a spatial probability map. The intensity model describes the typical intensities of the hippocampus and the background. The spatial probability map is derived from the registration of multiple atlases and contains the probability of being part of the hippocampus for every voxel. A single rater (TdH), blinded for clinical information, visually inspected the results of all automated hippocampal segmentations, and where necessary manually corrected these using FSLView (http://www.fmrib.ox.ac.uk/fsl/). To account for differences in head size, we divided all measured volumes by total intracranial volume (TIV) which was assessed with an automated procedure (Ikram et al., 2008).
2.7. Functional MRI paradigm
We used a visual n-back task to engage working memory (Owen et al., 2005; Smits et al., 2009). Participants received instructions and practiced the task 30 min prior to MRI scanning. Within the scanner visual stimuli were presented using Presentation software (version 14.4, Neurobehavioral Systems Inc., Albany, CA, US), onto a back-projection screen that was visible within the scanner with a mirror mounted on the head coil. External triggering by the MR system ensured synchronization of the stimulus presentation and precise recording of task performance and response times. Participants responded with a button press, which was recorded using MR-compatible fiber optic response buttons. We implemented the n-back task as a block design consisting of 3 active conditions with increasing working memory load: 0-back (vigilance), 1-back (low working memory load), 2-back (high working memory load), and a rest condition. Active conditions consisted of 9 stimuli (numbers 0–9), with an inter-stimulus interval of 3 s, during which 3 or 4 ‘hit’ stimuli had to be identified. Each active block was presented 3 times, intermixed and counterbalanced with 4 rest conditions. The condition and rest blocks were preceded by a visual instruction of 3 s, and lasted 30 s in total. During the rest condition no visual stimuli were presented (black screen), and participants were instructed to keep their eyes open. During the 0-back condition we instructed participants to respond whenever the number ‘0’ was presented, during the 1-back whenever the presented number resembled the previous number, and during the 2-back condition whenever the presented number matched the number presented before the previous number.
2.8. Functional MRI behavioral data analysis
Behavioral data consisted of task performance and reaction time (RT). Similar to Snodgrass and Corwin (1988) we defined hit rate (H) as the probability of correct response, P (H/total possible hits), and false alarm rate (FA) as the probability of false alarm P (FA/total possible non-hits). Task performance was subsequently calculated for the separate conditions (0-back, 1-back, 2-back) using d prime, a measure of sensitivity to true-positive items (Snodgrass and Corwin, 1988). In addition we calculated the index Performance Pr = H − FA, where Pr = 1 reflects perfect performance and Pr = 0 reflects chance performance (Langeslag et al., 2009). Eight MCI patients (3 without CSVD and 5 with CSVD) with an average Pr < 0.5 were excluded from our fMRI analyses to ensure that any differences in brain activation were related to pathofysiological changes instead of performance-related variability (Price and Friston, 1999). Thus, eventually we based our fMRI analyses on 42 MCI patients and 25 controls.
2.9. Functional MRI data analysis
We analyzed fMRI data using Statistical Parametric Mapping software (SPM5; Wellcome Department of Cognitive Neurology, London, UK) implemented in Matlab R2009b (Mathworks, Natick, MA, USA). On an individual level, we spatially realigned all functional images using a rigid body transformation, and coregistered these images to the individual's T1-weighted image. To normalize functional and anatomical images we performed a unified segmentation/normalization procedure to standard brain space defined by the Montreal Neurological Institute (MNI) as provided within SPM5 (Ashburner and Friston, 2005). Functional images were resampled into 3 × 3 × 3 mm3 voxels and spatially smoothed with a 10 mm full width half maximum Gaussian kernel. We calculated individual statistical parametric maps using the general linear model. Our design matrix included the rest condition, the active conditions, the instruction, a high-pass filter of 128 s and individual movement parameters to account for residual effects of head movement. At a single-subject level we contrasted BOLD response during vigilance (0-back), low (1-back) and high (2-back) working memory load against baseline ‘rest’ activity. These contrasts were entered into second level one-sample and two sample t-tests, examining both activation and deactivation within and between groups. In addition to these analyses we created a flexible factorial model with group (controls, MCI patients with CSVD and MCI patients without CSVD) × working memory load (vigilance, low and high working memory load). We examined the main effect of working memory load on fMRI BOLD response, as well as interaction effects between controls and MCI patient groups.
Results for within group analyses, both activation and deactivation results, were thresholded at p < 0.05 family wise error (FWE) correction for multiple comparisons. Since at this stringent threshold no deactivation was seen in patient groups, we further explored within group deactivation results at a more lenient threshold of p < 0.001, not corrected for multiple comparisons, with a minimum cluster size of at least 20 contiguous voxels. We focused our between group analyses, main effect and interaction analyses, on ROIs that were shown to be relevant to activation during nonverbal n-back tasks in a meta-analysis study of Owen et al. (2005). These regions include the lateral premotor cortex, the dorsal cingulate gyrus, the dorsolateral prefrontal cortex and the inferior parietal lobule. We used the WFU Pickatlas toolbox (Wake Forest School of Medicine, Winston Salem), to create 4 masks containing the bilateral ROIs. Reported results of activation in between group analyses and main or interaction analyses survived FWE correction for multiple comparisons within the ROIs using small volume correction (Worsley et al., 1996; Friston, 1997), or within the entire brain for regions not a priori specified.
For exploration of the deactivation results, we created an ROI based on the within group analysis in controls and a priori selected regions known to be involved in the default mode network, including the medial prefrontal cortex, PCC/precuneus, ACC, hippocampus and inferior parietal lobule. We created masks containing these regions bilaterally using WFU Pickatlas toolbox. In addition we identified clusters of deactivation within the 0-back, 1-back and 2-back conditions in controls, by contrasting these conditions vs. the rest condition (p < 0.001, not corrected for multiple comparisons). We created one single mask of these regions using an AND function in Marsbar 0.41 (Marseille Boîte À Région d'Intérêt), in which we also included the a priori selected regions. The resulting deactivation ROI included therefore only those regions known to be involved in the DMN, and deactivated during all conditions in controls (Fig. 5A). Within this ROI we extracted mean beta values of all MCI patients and controls, and subsequently exported these to SPSS (version 17.0 for Windows, Chicago, Ill., U.S.A.) for further analyses. Anatomical labeling of significantly activated clusters was performed using WFU Pickatlas.
Fig. 5.
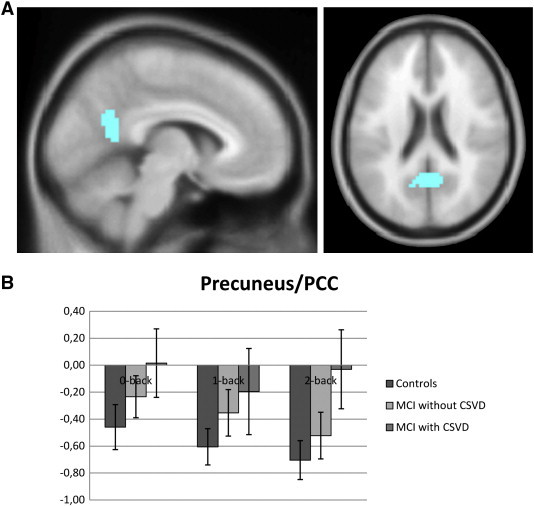
A) ROI obtained with AND function of 0-back, 1-back and 2-back contrast in controls in conjunction with a priori defined DMN brain regions. B) Chart displays mean beta values for this ROI in controls, MCI patients without CSVD and MCI with CSVD.
2.10. Statistical analysis
We compared demographic, neuropsychological, imaging characteristics and mean beta values using SPSS 17.0 for Windows. Differences between groups on continuous variables were assessed with analysis of variance (ANOVA) and post hoc independent sample t-tests. Non parametric data was compared using Kruskal–Wallis, followed by Mann–Whitney U tests. Between group analyses of nominal variables were performed by means of Chi-square tests.
We performed a group (controls, MCI patients with CSVD, MCI patients without CSVD) × load (0-back, 1-back, 2-back) ANOVA for the fMRI behavioral measures d prime and RT as well as mean beta values from deactivation ROIs. Post hoc two sample t-tests were performed to further investigate the significant results for d prime, RT and mean beta values. A p value < 0.05 was considered statistically significant.
3. Results
3.1. Characteristics
Characteristics of MCI patients and controls are listed in Table 1. The percentage of women was lower in MCI patients without CSVD relative to controls, and hypertension was more often present in MCI patients with CSVD and healthy controls as compared with MCI patients without CSVD. The prevalence of APOE−/ε4 was significantly higher in MCI patients with CSVD as compared with controls.
Table 1.
Characteristics of controls and MCI patients with and without CSVD.
| Controls (n = 25) | MCI total group (n = 42) | MCI with CSVD (n = 16) | MCI without CSVD (n = 26) | |
|---|---|---|---|---|
| Age, years | 71.6 (5.2) | 73.4 (4.4) | 74.3 (4.4) | 72.8 (4.4) |
| Sex, women (%) | 11 (44.0) | 8 (19.0)a | 5 (31.3) | 3 (11.5)a |
| Education | 5.5 (1.2) | 5.4 (1.2) | 5.6 (1.2) | 5.3 (1.2) |
| MMSE | 28.8 (1.2) | 27.2 (2.0)a | 27.2 (1.8)a | 27.2 (2.1)a |
| Hypertension, prevalence (%) | 17 (68.0) | 24 (57.1) | 14 (87.5) | 10 (38.5)a,b |
| Smoking, prevalence (%)1 | 15 (60.0) | 30 (71.4) | 14 (87.5) | 16 (61.5) |
| APOE−/ε4, prevalence (%)2 | 6 (28.6) | 21 (53.8) | 10 (71.4)a | 11 (44.0) |
Values are unadjusted means (standard deviation) or number of participants (percentages). MCI: mild cognitive impairment. CSVD: cerebral small vessel disease. MMSE: mini mental state examination. Differences between groups by means of independent sample t-test or Chi-Square test: a) p < .05 compared with controls b) p < .05 compared with MCI patients with CSVD.
Prevalence current and former smoking.
Missing data for 4 controls, 2 MCI patients with CSVD and 1 MCI patient without CSVD.
3.2. Neuropsychological test results
Table 2 summarizes the neuropsychological test results. After correcting for age, sex and education, MCI patients with and without CSVD showed a cognitive profile with memory impairment as the most prominent finding. In addition, MCI patients with and without CSVD performed worse on executive functioning relative to controls. MCI patients without CSVD performed worse on tasks for language as compared with both controls and MCI patients with CSVD. Other cognitive domains revealed no differences between MCI patients with and without CSVD.
Table 2.
Neuropsychological test results for controls and MCI patients with and without CSVD.
| Controls (n = 25) | MCI with CSVD (n = 16) | MCI without CSVD (n = 26) | |
|---|---|---|---|
| Memory | 0.00 (0.72) | − 1.74 (0.74)a | − 1.69 (0.70)a |
| Processing speed | 0.00 (0.87) | − 0.68 (1.07) | − 0.54 (1.00) |
| Executive function | 0.00 (0.90) | − 0.94 (1.40)a | − 0.88 (1.43)a |
| Language | 0.00 (0.71) | − 0.63 (0.83) | − 1.41 (1.34)a,b |
| Visuospatial ability | 0.00 (1.00) | − 0.35 (1.32) | − 0.54 (1.13) |
| Visuoconstructive ability | 0.00 (1.00) | − 0.73 (1.10) | − 0.36 (1.70) |
Values are unadjusted z-score means (standard deviation). MCI: mild cognitive impairment. CSVD: cerebral small vessel disease. Differences between groups were calculated by means of ANCOVA corrected for age, sex and education: a) p < .05 compared with controls b) p < .05 compared with MCI patients with CSVD.
3.3. Structural MRI measures
According to the classification used, MCI patients with CSVD had higher Fazekas scores, higher incidence of lacunar infarcts and higher WMH volumes, compared with MCI patients without CSVD and controls (Table 3). In addition, both MCI patients with and without CSVD had lower hippocampal volumes than controls.
Table 3.
MRI characteristics for controls and MCI patients with and without CSVD.
| Controls (n = 25) | MCI with CSVD (n = 16) | MCI without CSVD (n = 26) | |
|---|---|---|---|
| WMH (Fazekas score)* | 0 (0; 1) | 2 (2; 2)a | 1 (0; 1) b |
| Lacunar infarcts, presence (%) | 2 (8.0) | 7 (43.8)a | 3 (11.5)b |
| Gray matter/TIV % | 41.3 (3.2) | 39.8 (3.0) | 40.7 (2.4) |
| White matter/TIV % | 37.9 (0.2) | 35.8 (2.5)a | 36.7 (2.3)b |
| WMH, volume in ml* | 15.1 (11.8; 22.8) | 30.8 (23.9; 40.9)a | 16.0 (10.7; 20.9)b |
| WMH/TIV %* | 1.4 (1.1; 2.2) | 2.8 (2.6; 3.7)a | 1.3 (1.0; 1.6)b |
| Left hippocampus/TIV % | 0.29 (0.03) | 0.26 (0.03)a | 0.24 (0.04)a |
| Right hippocampal/TIV % | 0.28 (0.03) | 0.26 (0.03)a | 0.25 (0.03)a |
Values are unadjusted means (standard deviations) or number of participants (percentages). MCI: mild cognitive impairment. CSVD: cerebral small vessel disease. * Median (interquartile range). Differences between groups by means of ANCOVA corrected for age and sex, Mann–Whitney U test or Chi Square tests: a) p < .05 compared with controls b) p < .05 compared with MCI patients with CSVD.
3.4. fMRI task performance
Task performance, characterized by d prime and RT, was influenced by working memory load, with lower d prime scores and longer RT at high working memory load (main effect for task d prime F(2,195) = 50.3, p < 0.001; main effect for task RT; F(2,195) = 22.0, p < 0.001, Fig. 1). Task performance differed between controls and MCI patient groups, independent of working memory load (main effect for group d prime F(2,195) = 3.8, p = 0.023; main effect for group RT F(2,195) = 4.3, p = 0.015, Fig. 1). There were no significant interaction effects. The significant main effect for group was driven by significantly worse performance during the low (1-back) working memory load condition in MCI patients without CSVD relative to controls (d prime 1-back p = 0.014; RT 1-back: p = 0.013, Fig. 1). MCI patients without CSVD did not differ from controls on the 0-back (d prime 0-back p = 0.674; RT 0-back p = 0.170) or 2-back condition (d prime 2-back p = 0.076; RT 2-back p = 0.103). MCI patients with CSVD did not differ from controls on the 0-back, 1-back or 2-back condition (d prime 0-back p = 0.765; RT 0-back p = 0.253; d prime 1-back p = 0.112; RT 1-back p = 0.262; d prime 2-back p = 0.348; RT 2-back p = 0.123). MCI patients with and without CSVD showed similar task performance (d prime 0-back p = 0.933; RT 0-back p = 0.886; d prime 1-back p = 0.514; RT 1-back p = 0.239; d prime 2-backp = 0.569; RT 2-back p = 0.776).
Fig. 1.
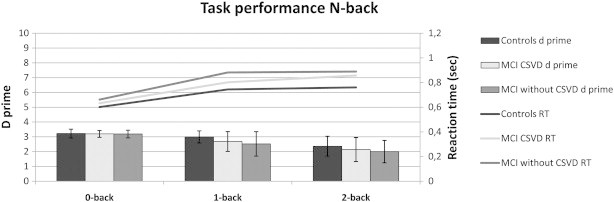
d prime and reaction time. Significant difference between controls and MCI patients without CSVD during 1-back condition for d prime and response time.
3.5. fMRI BOLD—task related activation
Vigilance, low and high working memory load conditions activated a wide network of regions that was similar in controls and patient groups and included: the bilateral middle, medial, and inferior frontal lobe, the inferior and superior parietal lobe and the inferior occipital lobe (Fig. 2), activated regions consistent with previous fMRI studies using a graded n-back working memory paradigm (Owen et al., 2005).
Fig. 2.
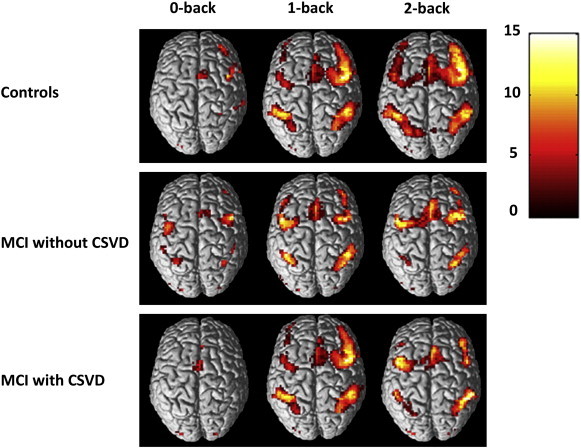
Within group fMRI activation results for different levels of working memory load (0-back versus rest; 1-back versus rest, 2-back versus rest), results displayed at p < .05 FWE correction for multiple comparisons.
We found no difference in brain activation between controls and MCI patients with CSVD for different levels of working memory load. Relative to controls, MCI patients without CSVD showed significantly increased activation, ‘hyperactivation’, during vigilance (0-back) bilaterally in the inferior and middle frontal gyrus (Fig. 3A, Table 4); and less activation, ‘hypoactivation’, during high working memory load (2-back) in the right middle frontal gyrus (Fig. 3B, Table 4). A direct comparison between the two MCI patient groups revealed no significant differences for various levels of working memory load.
Fig. 3.
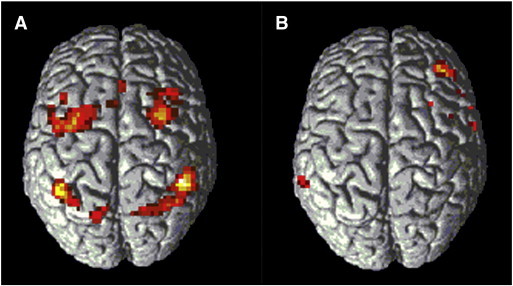
A) Activation in 2 sample t-test MCI without CSVD > Controls during vigilance (0-back versus rest). B) Activation in 2 sample t-test Controls > MCI without CSVD during high working memory load (2-back versus rest). Results displayed at p < .001, not corrected for multiple comparisons, for illustrative purposes.
Table 4.
Between group analyses.
| Cluster size | MNI coordinates |
T value | |||
|---|---|---|---|---|---|
| X | Y | Z | |||
| 0-back; MCI without CSVD > Controls | |||||
| Inferior parietal lobule R | 201 | 45 | − 42 | 42 | 5.96 |
| 36 | − 57 | 42 | 3.99 | ||
| Middle frontal gyrus L | 100 | − 30 | 0 | 51 | 5.01 |
| Middle frontal gyrus R | 134 | 30 | 3 | 51 | 4.76 |
| 27 | 24 | 48 | 3.46 | ||
| Inferior parietal lobule L | 98 | − 42 | − 51 | 48 | 4.45 |
| 2-back; Controls > MCI without CSVD | |||||
| Middle frontal gyrus R | 17 | 42 | 39 | 30 | 4.07 |
Results at p < 0.05 FWE small volume correction.
Main effect analyses for working memory load in a 3 × 3 flexible factorial model including group (controls, MCI patients with CSVD, MCI patients without CSVD) and working memory load (vigilance, low and high working memory load) revealed the same extensive network of regions found in the within group analyses; and showed increased activation with increasing working memory load (results not shown). Results of interaction analyses are summarized in Table 5. When examining group × load interactions we found that controls showed a significantly larger increase in activation with increasing levels of working memory load (2 back > 0-back and 2-back > 1-back) when compared with MCI patients without CSVD in bilateral regions involved in the n-back task, including the bilateral inferior parietal lobule, the bilateral middle and superior frontal gyrus and the anterior cingulate gyrus (Owen et al., 2005). Vice versa, the interaction contrasts of MCI patients without CSVD versus controls yielded no significant results. These results support the findings of ‘hyperactivation’ at vigilance and ‘hypoactivation’ at high working memory load encountered in MCI patients without CSVD in comparison to controls in between group analyses. When we examined interaction effects between the two MCI patient groups we encountered a significant effect for the anterior cingulate gyrus, for (MCI with CSVD > MCI without CSVD) × (2-back > 1-back). This implies a different working memory load dependent fMRI response in MCI patients without CSVD as compared with MCI patients with CSVD. We found no significant interaction effects between controls and MCI patients with CSVD.
Table 5.
MNI coordinates interaction contrasts for controls and MCI patient groups with and without CSVD.
| Cluster size | MNI coordinates |
T value | |||
|---|---|---|---|---|---|
| X | Y | Z | |||
| (Controls > MCI without CSVD) × (2-back > 0-back) | |||||
| Inferior parietal lobule R | 79 | 48 | − 63 | 39 | 4.61 |
| Inferior frontal gyrus L | 23 | − 45 | 48 | − 3 | 4.00 |
| Middle frontal gyrus R | 71 | 30 | 15 | 42 | 3.99 |
| Middle frontal gyrus L | 18 | − 36 | 21 | 45 | 3.61 |
| Inferior parietal lobule L | 11 | − 51 | − 39 | 42 | 3.22 |
| (Controls > MCI without CSVD) × (2-back > 1-back) | |||||
| Cingulate gyrus L | 280 | − 12 | 24 | 39 | 4.16 |
| Middle frontal gyrus L | − 27 | 18 | 45 | 3.80 | |
| Superior frontal gyrus L | − 12 | 39 | 36 | 3.75 | |
| Anterior cingulate gyrus L | − 21 | 45 | 9 | 3.65 | |
| Anterior cingulate gyrus L | 57 | − 6 | 33 | 9 | 4.01 |
| Medial frontal gyrus R | 425 | 15 | 30 | 45 | 3.96 |
| Superior frontal gyrus R | 18 | 48 | 30 | 3.84 | |
| (MCI with CSVD > MCI without CSVD) × (2-back > 1-back) | |||||
| Anterior Cingulate gyrus L + R | 25 | 0 | 21 | 21 | 3.48 |
Results at p < 0.05 FWE small volume correction.
3.6. fMRI BOLD—task induced deactivation
We found within group task-induced deactivation within the precuneus/PCC in controls during low and high working memory load conditions when thresholded at p < 0.05, with FWE correction for multiple comparisons. At a more lenient threshold of p < 0.001, not corrected for multiple comparisons, MCI patients without CSVD showed deactivation in the precuneus/PCC during all working memory load conditions (Fig. 5), with additional deactivation of the medial frontal gyrus (Fig. 4, Table 6). MCI patients with CSVD, showed task-induced deactivation of the PCC during vigilance (p < 0.001, not corrected for multiple comparisons), but no deactivation during low and high working memory load conditions (Fig. 4, Table 6). We used an ROI analysis of the precuneus/PCC (Fig. 5) to further explore these differences in task-induced—within group—deactivation. A group × working memory load ANOVA revealed a significant main effect of group for this ROI (p = 0.008), without a main effect of load or significant interaction effects. Concentrating on the two MCI patient groups, we found a trend for the main effect of group (p = 0.098). Post hoc, mean beta values differed between MCI patients with CSVD and controls during the 2-back condition in the precuneus/PCC region (p = 0.028).
Fig. 4.
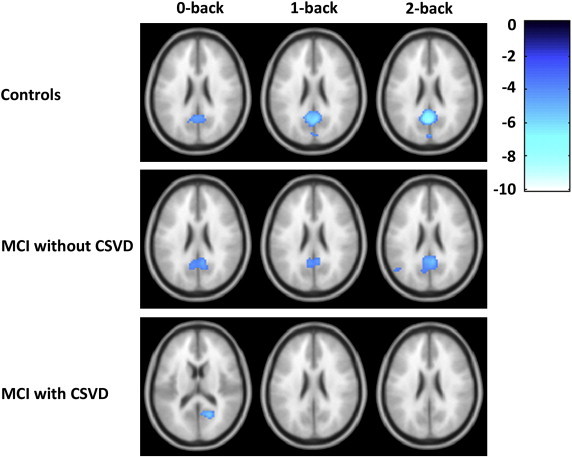
Within group fMRI deactivation results for different levels of working memory load (0-back versus rest; 1-back versus rest, 2-back versus rest), results displayed at p < .001, not corrected for multiple comparisons.
Table 6.
Within group deactivation results.
| Cluster size | MNI coordinates |
T value | |||
|---|---|---|---|---|---|
| X | Y | Z | |||
| Controls | |||||
| 0-back | |||||
| Cuneus L + R | 192 | 0 | − 78 | 30 | 4.64 |
| Posterior cingulate gyrus R | 6 | − 57 | 21 | 4.63 | |
| Precuneus L | − 15 | − 63 | 21 | 3.78 | |
| 1-back | |||||
| Posterior cingulate gyrus R | 417 | 6 | − 57 | 21 | 7.28 |
| Precuneus L + R | 0 | − 77 | 27 | 4.04 | |
| 2-back | |||||
| Posterior cingulate gyrus L | 562 | − 9 | − 57 | 18 | 10.95 |
| MCI patients with CSVD | |||||
| 0-back | |||||
| Posterior cingulate gyrus R | 48 | 18 | − 60 | 15 | 5.53 |
| 1-back | – | ||||
| 2-back | – | ||||
| MCI patients without CSVD | |||||
| 0-back | |||||
| Posterior cingulate gyrus R | 386 | 15 | − 57 | 15 | 6.37 |
| Posterior cingulate gyrus L | − 9 | − 54 | 6 | 4.55 | |
| Precuneus L | − 9 | − 62 | 21 | 4.25 | |
| 1-back | |||||
| Posterior cingulate gyrus L | 141 | − 9 | − 54 | 18 | 4.73 |
| Lingual gyrus R | 12 | − 54 | 0 | 3.94 | |
| Medial frontal gyrus R | 20 | 9 | 48 | − 6 | 4.31 |
| 2-back | |||||
| Medial frontal gyrus R | 174 | 3 | 51 | − 6 | 5.68 |
| Posterior cingulate gyrus R | 435 | 6 | − 51 | 21 | 5.51 |
| Posterior cingulate gyrus L | − 12 | − 54 | 6 | 4.71 | |
| Precuneus R | 28 | 6 | − 81 | 39 | 4.27 |
Results at p < 0.001, not corrected for multiple comparisons.
4. Discussion
In the present fMRI study we examined differences in brain activation and deactivation during a working memory task in MCI patients with and without CSVD and controls. We found impaired task-induced brain deactivation in a region known to be involved in the default mode network in MCI patients with CSVD. MCI patients without CSVD showed relative ‘hyperactivation’ during vigilance, and ‘hypoactivation’ at high working memory load.
We found a similar cognitive profile in MCI patients with and without CSVD with memory impairment as the most prominent finding, and additional executive functioning problems. Language problems were found when comparing MCI patients without CSVD with either healthy controls or MCI patients with CSVD. The presence of CSVD is typically associated with a prominent dysexecutive cognitive syndrome and with memory deficits to a lesser extent (Nordahl et al., 2005; Prins et al., 2005), as specifically frontal circuits are thought to be affected by white matter lesions and lacunar infarcts (Cummings, 1993; Pugh and Lipsitz, 2002). In this context, memory impairment has been explained as the result of diminished executive control, leading to working memory deficits, in turn affecting memory functioning (Nordahl et al., 2005). Nordahl et al. (2005) studied MCI patients with either WMH or severe hippocampal atrophy, and found that while both patient groups showed episodic memory impairment they could be distinguished on the basis of n-back task performance, which was worse in MCI patients with WMH. Our results cannot be compared to n-back task performance in this patient group, as first, we excluded patients on the basis of n-back task performance and therefore introduced a positive bias into our data, and second, MCI patients with CSVD showed hippocampal atrophy as well, which suggests the co-occurrence of Alzheimer pathology. In the present study we could not distinguish between MCI patients with and without CSVD on the basis of neuropsychological profile, which is supported by a study of Reed et al. (2007) that suggested that the differentiation between AD cases and mixed pathology cases on the basis of neuropsychological profiles is hard and inconclusive, in particular since it is not ruled out that Alzheimer and cerebrovascular pathology synergistically contribute to the clinical syndromes of MCI and dementia (Zekry et al., 2002; Bennett et al., 2005). In case of mixed pathology, the effects of CSVD on cognition were found to be most pronounced in the early stages of AD pathology (Esiri et al., 1999).
In the current study we found a reduction of precuneus/PCC deactivation in MCI patients with CSVD. A similar result has been reported within the ACC in an fMRI study in healthy elderly with high vascular burden, and explained as a frontal functional connectivity problem (Mayda et al., 2011). Our finding of reduced deactivation in the precuneus/PCC region supports the notion that the presence of CSVD may cause a more widespread connectivity problem. The ACC and precuneus/PCC are regions known to be taking part in the DMN, a functional network of brain regions activated at rest, ‘default’ conditions and actively suppressed, i.e. deactivated, during various cognitive activities (Buckner et al., 2008). Deactivation failure or deteriorated functional connectivity in the DMN was found to be associated with cognitive task performance (Eichele et al., 2008; Kelly et al., 2008; Anticevic et al., 2010), and has been encountered in several neurodegenerative conditions (Seeley et al., 2009), among which MCI and AD (Greicius et al., 2004; Rombouts et al., 2005; Qi et al., 2010; Koch et al., 2012). It was recently suggested that deactivation is progressively disrupted along the continuum from normal aging to MCI and AD, with increased impairment in APOE4 genotype carriers (Pihlajamaki and Sperling, 2009). While APOE4 is known to be a risk factor for white matter lesions (Horsburgh et al., 2000), current DMN studies in AD and MCI do not take the effects of CSVD into account. Studies combining DTI and fMRI provided evidence for a relationship between white matter integrity and functional connectivity within the DMN (Damoiseaux and Greicius, 2009; Teipel et al., 2010). In this view, CSVD, as well as other conditions influencing white matter integrity (Rocca et al., 2010), can affect cognition through interference of network functioning, resulting in diminished deactivation and cognitive failure (Eichele et al., 2008; Kelly et al., 2008; Anticevic et al., 2010).
Our observation of ‘hyperactivation’ during vigilance and less recruitment, ‘hypoactivation’, at high working memory load in MCI patients without CSVD, contrasted to the gradual increase in brain activation linear with increasing working memory in controls and MCI patients with CSVD. The latter pattern is in agreement with reports from the literature (Duncan and Owen, 2000; Owen et al., 2005). The different working memory load dependent activation pattern in MCI patients without CSVD was consistent with a study also using a graded working memory fMRI paradigm in MCI patients (Kochan et al., 2010), and was claimed to be the effect of compensatory mechanisms at low demanding tasks, and a failure of compensation at high demanding tasks. Gould et al. (2006) encountered a similar task difficulty dependent interaction effect between AD patients and controls. Interestingly, these results may clarify previous contradictory findings in fMRI studies in MCI or AD, hypoactivation vs. hyperactivation (Johnson et al., 2006; Bokde et al., 2010; Gigi et al., 2010), which might be caused by differences in the difficulty of fMRI paradigms.
The strengths of our study are the relative large number of patients and controls, the careful assessment of CSVD and extensive assessment of cognitive functioning. Our study has some potential limitations. First, we used a semi-quantitative rating scale in our definition of CSVD instead of a quantitative method. Although ratings based on automatic WMH segmentations are less susceptible to rater subjectivity, a classification based on advanced automated algorithms is highly dependent upon the cohort that is studied, making it difficult to translate findings to clinical practice or other studies. For example, our group of MCI patients with CSVD have a higher WMH burden when compared to older study participants in the 75th WMH percentile in the study of Mayda et al. (2011). A second potential limitation is the modeling of fMRI BOLD response in participants with vascular risk factors known to affect cortical vasoreactivity (Glodzik et al., 2011). Some authors avoid this issue by excluding MCI patients with signs of CSVD from their fMRI study (Bokde et al., 2010; Gigi et al., 2010), and in other studies vascular risk factors in older participants are not assessed. We acknowledge that with our approach we are at risk of underestimating the BOLD-response in MCI patients with CSVD. However, in the present study we found no evidence for a reduction in BOLD-response in CSVD, as we found no differences in a direct comparison of brain activation between MCI patients with and without CSVD. A third drawback of this study is the use of a relatively lenient threshold, not corrected for multiple comparisons, when examining within group deactivation results. It is important to note that by thresholding statistical parametric maps at this more lenient threshold, false-positive findings increase. However, we would like to note that our findings of deactivation in MCI patients were restricted to regions shown to deactivate in controls using FWE correction, and were reported in other studies as well (Rombouts et al., 2005). A fourth limitation is the fact that even after stringent exclusion of participants on the basis of task performance, MCI patients still perform worse when compared with controls. While our results will have to be interpreted with some caution, we have to note that the differences were limited to the 1-back condition during which MCI patients without CSVD showed worse task performance when compared with controls. There were no differences in task performance between MCI patient groups. A final limitation of this study is that in comparison with controls, MCI patients were more frequently male, and in MCI patients without CSVD hypertension was less prevalent. This is the result of our inclusion method. We included healthy controls based on age (aged 65 years or older) and subjective and objectified cognitive functioning. As gender was found to have an effect on the lateralization of activation (Speck et al., 2000), we acknowledge that a gender difference could influence our results, but consider the underlying pathophysiological changes in MCI to have a more profound effect on brain activation than gender.
In conclusion, MCI patients with CSVD have impaired deactivation in regions known to be involved in the DMN. MCI patients without CSVD show ‘hyperactivation’ during vigilance and ‘hypoactivation’ during high working memory load. These observed differences in brain activation and deactivation between MCI patients with and without CSVD, who had a similar ‘clinical phenotype’, support the view that, in patients with MCI, different types of pathology can contribute to cognitive impairment through different pathways. Our results suggest that elucidating the effects of CSVD on network functioning in patient cohorts as well as in healthy individuals will have to be an important focus of future research.
Acknowledgments
This work was supported by the Netherlands Brain Foundation (project number H07.03 to Niels D. Prins). Janne M. Papma received financial support from the Netherlands Alzheimer Foundation. We acknowledge Dr. E.A.C.M. Sanders, Amphia ziekenhuis, Dr. H.J. Gilhuis, Reinier de Graaf ziekenhuis; Dr. G. Ziere and A.J. Arends, Havenziekenhuis; Dr. G.J. Lighthart, LangeLand ziekenhuis, Dr. J. Schuuring, Groene Hart ziekenhuis, J.J.M. Driessen, Vlietland ziekenhuis and Dr. S.L.M. Bakker, Sint Franciscus Gasthuis for the referral of MCI patients.
Footnotes
This is an open-access article distributed under the terms of the Creative Commons Attribution-NonCommercial-ShareAlike License, which permits non-commercial use, distribution, and reproduction in any medium, provided the original author and source are credited.
References
- Albert M.S., DeKosky S.T., Dickson D., Dubois B., Feldman H.H., Fox N.C., Gamst A., Holtzman D.M., Jagust W.J., Petersen R.C., Snyder P.J., Carrillo M.C., Thies B., Phelps C.H. The diagnosis of mild cognitive impairment due to Alzheimer's disease: recommendations from the National Institute on Aging-Alzheimer's Association workgroups on diagnostic guidelines for Alzheimer's disease. Alzheimer's & Dementia. 2011;7:270–279. doi: 10.1016/j.jalz.2011.03.008. [DOI] [PMC free article] [PubMed] [Google Scholar]
- Anticevic A., Repovs G., Shulman G.L., Barch D.M. When less is more: TPJ and default network deactivation during encoding predicts working memory performance. NeuroImage. 2010;49:2638–2648. doi: 10.1016/j.neuroimage.2009.11.008. [DOI] [PMC free article] [PubMed] [Google Scholar]
- Ashburner J., Friston K.J. Unified segmentation. NeuroImage. 2005;26:839–851. doi: 10.1016/j.neuroimage.2005.02.018. [DOI] [PubMed] [Google Scholar]
- Bennett D.A., Schneider J.A., Bienias J.L., Evans D.A., Wilson R.S. Mild cognitive impairment is related to Alzheimer disease pathology and cerebral infarctions. Neurology. 2005;64:834–841. doi: 10.1212/01.WNL.0000152982.47274.9E. [DOI] [PubMed] [Google Scholar]
- Bokde A.L., Karmann M., Born C., Teipel S.J., Omerovic M., Ewers M., Frodl T., Meisenzahl E., Reiser M., Moller H.J., Hampel H. Altered brain activation during a verbal working memory task in subjects with amnestic mild cognitive impairment. Journal of Alzheimer's Disease. 2010;21:103–118. doi: 10.3233/JAD-2010-091054. [DOI] [PubMed] [Google Scholar]
- Braver T.S., Cohen J.D., Nystrom L.E., Jonides J., Smith E.E., Noll D.C. A parametric study of prefrontal cortex involvement in human working memory. NeuroImage. 1997;5:49–62. doi: 10.1006/nimg.1996.0247. [DOI] [PubMed] [Google Scholar]
- Buckner R.L., Andrews-Hanna J.R., Schacter D.L. The brain's default network: anatomy, function, and relevance to disease. Annals of the New York Academy of Sciences. 2008;1124:1–38. doi: 10.1196/annals.1440.011. [DOI] [PubMed] [Google Scholar]
- Cummings J.L. Frontal–subcortical circuits and human behavior. Archives of Neurology. 1993;50:873–880. doi: 10.1001/archneur.1993.00540080076020. [DOI] [PubMed] [Google Scholar]
- Damoiseaux J.S., Greicius M.D. Greater than the sum of its parts: a review of studies combining structural connectivity and resting-state functional connectivity. Brain Structure & Function. 2009;213:525–533. doi: 10.1007/s00429-009-0208-6. [DOI] [PubMed] [Google Scholar]
- de Boer R., Vrooman H.A., van der Lijn F., Vernooij M.W., Ikram M.A., van der Lugt A., Breteler M.M., Niessen W.J. White matter lesion extension to automatic brain tissue segmentation on MRI. NeuroImage. 2009;45:1151–1161. doi: 10.1016/j.neuroimage.2009.01.011. [DOI] [PubMed] [Google Scholar]
- DeCarli C. Mild cognitive impairment: prevalence, prognosis, aetiology, and treatment. Lancet Neurology. 2003;2:15–21. doi: 10.1016/s1474-4422(03)00262-x. [DOI] [PubMed] [Google Scholar]
- den Heijer T., van der Lijn F., Koudstaal P.J., Hofman A., van der Lugt A., Krestin G.P., Niessen W.J., Breteler M.M. A 10-year follow-up of hippocampal volume on magnetic resonance imaging in early dementia and cognitive decline. Brain. 2010;133:1163–1172. doi: 10.1093/brain/awq048. [DOI] [PubMed] [Google Scholar]
- Duncan J., Owen A.M. Common regions of the human frontal lobe recruited by diverse cognitive demands. Trends in Neurosciences. 2000;23:475–483. doi: 10.1016/s0166-2236(00)01633-7. [DOI] [PubMed] [Google Scholar]
- Eichele T., Debener S., Calhoun V.D., Specht K., Engel A.K., Hugdahl K., von Cramon D.Y., Ullsperger M. Prediction of human errors by maladaptive changes in event-related brain networks. Proceedings of the National Academy of Sciences of the United States of America. 2008;105:6173–6178. doi: 10.1073/pnas.0708965105. [DOI] [PMC free article] [PubMed] [Google Scholar]
- Esiri M.M., Nagy Z., Smith M.Z., Barnetson L., Smith A.D. Cerebrovascular disease and threshold for dementia in the early stages of Alzheimer's disease. Lancet. 1999;354:919–920. doi: 10.1016/S0140-6736(99)02355-7. [DOI] [PubMed] [Google Scholar]
- Fazekas F., Barkhof F., Wahlund L.O., Pantoni L., Erkinjuntti T., Scheltens P., Schmidt R. CT and MRI rating of white matter lesions. Cerebrovascular Diseases. 2002;13(Suppl. 2):31–36. doi: 10.1159/000049147. [DOI] [PubMed] [Google Scholar]
- Fisher C.M. Lacunar strokes and infarcts: a review. Neurology. 1982;32:871–876. doi: 10.1212/wnl.32.8.871. [DOI] [PubMed] [Google Scholar]
- Frisoni G.B., Galluzzi S., Bresciani L., Zanetti O., Geroldi C. Mild cognitive impairment with subcortical vascular features: clinical characteristics and outcome. Journal of Neurology. 2002;249:1423–1432. doi: 10.1007/s00415-002-0861-7. [DOI] [PubMed] [Google Scholar]
- Friston K.J. Testing for anatomically specified regional effects. Human Brain Mapping. 1997;5:133–136. doi: 10.1002/(sici)1097-0193(1997)5:2<133::aid-hbm7>3.0.co;2-4. [DOI] [PubMed] [Google Scholar]
- Galluzzi S., Sheu C.F., Zanetti O., Frisoni G.B. Distinctive clinical features of mild cognitive impairment with subcortical cerebrovascular disease. Dementia and Geriatric Cognitive Disorders. 2005;19:196–203. doi: 10.1159/000083499. [DOI] [PubMed] [Google Scholar]
- Gigi A., Babai R., Penker A., Hendler T., Korczyn A.D. Prefrontal compensatory mechanism may enable normal semantic memory performance in mild cognitive impairment (MCI) Journal of Neuroimaging. 2010;20:163–168. doi: 10.1111/j.1552-6569.2009.00386.x. [DOI] [PubMed] [Google Scholar]
- Glodzik L., Rusinek H., Brys M., Tsui W.H., Switalski R., Mosconi L., Mistur R., Pirraglia E., de Santi S., Li Y., Goldowsky A., de Leon M.J. Framingham cardiovascular risk profile correlates with impaired hippocampal and cortical vasoreactivity to hypercapnia. Journal of cerebral blood flow & metabolism. 2011;31:671–679. doi: 10.1038/jcbfm.2010.145. [DOI] [PMC free article] [PubMed] [Google Scholar]
- Gould R.L., Arroyo B., Brown R.G., Owen A.M., Bullmore E.T., Howard R.J. Brain mechanisms of successful compensation during learning in Alzheimer disease. Neurology. 2006;67:1011–1017. doi: 10.1212/01.wnl.0000237534.31734.1b. [DOI] [PubMed] [Google Scholar]
- Greicius M.D., Krasnow B., Reiss A.L., Menon V. Functional connectivity in the resting brain: a network analysis of the default mode hypothesis. Proceedings of the National Academy of Sciences of the United States of America. 2003;100:253–258. doi: 10.1073/pnas.0135058100. [DOI] [PMC free article] [PubMed] [Google Scholar]
- Greicius M.D., Srivastava G., Reiss A.L., Menon V. Default-mode network activity distinguishes Alzheimer's disease from healthy aging: evidence from functional MRI. Proceedings of the National Academy of Sciences of the United States of America. 2004;101:4637–4642. doi: 10.1073/pnas.0308627101. [DOI] [PMC free article] [PubMed] [Google Scholar]
- Horsburgh K., McCarron M.O., White F., Nicoll J.A. The role of apolipoprotein E in Alzheimer's disease, acute brain injury and cerebrovascular disease: evidence of common mechanisms and utility of animal models. Neurobiology of Aging. 2000;21:245–255. doi: 10.1016/s0197-4580(00)00097-x. [DOI] [PubMed] [Google Scholar]
- Ikram M.A., Vrooman H.A., Vernooij M.W., van der Lijn F., Hofman A., van der Lugt A., Niessen W.J., Breteler M.M. Brain tissue volumes in the general elderly population. The Rotterdam Scan Study. Neurobiology of Aging. 2008;29:882–890. doi: 10.1016/j.neurobiolaging.2006.12.012. [DOI] [PubMed] [Google Scholar]
- Johnson S.C., Schmitz T.W., Moritz C.H., Meyerand M.E., Rowley H.A., Alexander A.L., Hansen K.W., Gleason C.E., Carlsson C.M., Ries M.L., Asthana S., Chen K., Reiman E.M., Alexander G.E. Activation of brain regions vulnerable to Alzheimer's disease: the effect of mild cognitive impairment. Neurobiology of Aging. 2006;27:1604–1612. doi: 10.1016/j.neurobiolaging.2005.09.017. [DOI] [PMC free article] [PubMed] [Google Scholar]
- Kelly A.M., Uddin L.Q., Biswal B.B., Castellanos F.X., Milham M.P. Competition between functional brain networks mediates behavioral variability. NeuroImage. 2008;39:527–537. doi: 10.1016/j.neuroimage.2007.08.008. [DOI] [PubMed] [Google Scholar]
- Koch W., Teipel S., Mueller S., Benninghoff J., Wagner M., Bokde A.L., Hampel H., Coates U., Reiser M., Meindl T. Diagnostic power of default mode network resting state fMRI in the detection of Alzheimer's disease. Neurobiology of Aging. 2012;33:466–478. doi: 10.1016/j.neurobiolaging.2010.04.013. [DOI] [PubMed] [Google Scholar]
- Kochan N.A., Breakspear M., Slavin M.J., Valenzuela M., McCraw S., Brodaty H., Sachdev P.S. Functional alterations in brain activation and deactivation in mild cognitive impairment in response to a graded working memory challenge. Dementia and Geriatric Cognitive Disorders. 2010;30:553–568. doi: 10.1159/000322112. [DOI] [PubMed] [Google Scholar]
- Langeslag S.J., Morgan H.M., Jackson M.C., Linden D.E., Van Strien J.W. Electrophysiological correlates of improved short-term memory for emotional faces. Neuropsychologia. 2009;47:887–896. doi: 10.1016/j.neuropsychologia.2008.12.024. [DOI] [PubMed] [Google Scholar]
- Luchsinger J.A., Brickman A.M., Reitz C., Cho S.J., Schupf N., Manly J.J., Tang M.X., Small S.A., Mayeux R., DeCarli C., Brown T.R. Subclinical cerebrovascular disease in mild cognitive impairment. Neurology. 2009;73:450–456. doi: 10.1212/WNL.0b013e3181b1636a. [DOI] [PMC free article] [PubMed] [Google Scholar]
- Mayda A.B., Westphal A., Carter C.S., DeCarli C. Late life cognitive control deficits are accentuated by white matter disease burden. Brain. 2011;134:1673–1683. doi: 10.1093/brain/awr065. [DOI] [PMC free article] [PubMed] [Google Scholar]
- Meyer J.S., Xu G., Thornby J., Chowdhury M.H., Quach M. Is mild cognitive impairment prodromal for vascular dementia like Alzheimer's disease? Stroke. 2002;33:1981–1985. doi: 10.1161/01.str.0000024432.34557.10. [DOI] [PubMed] [Google Scholar]
- Mitchell A.J., Shiri-Feshki M. Rate of progression of mild cognitive impairment to dementia—meta-analysis of 41 robust inception cohort studies. Acta Psychiatrica Scandinavica. 2009;119:252–265. doi: 10.1111/j.1600-0447.2008.01326.x. [DOI] [PubMed] [Google Scholar]
- Nordahl C.W., Ranganath C., Yonelinas A.P., DeCarli C., Reed B.R., Jagust W.J. Different mechanisms of episodic memory failure in mild cognitive impairment. Neuropsychologia. 2005;43:1688–1697. doi: 10.1016/j.neuropsychologia.2005.01.003. [DOI] [PMC free article] [PubMed] [Google Scholar]
- Nordlund A., Rolstad S., Klang O., Lind K., Hansen S., Wallin A. Cognitive profiles of mild cognitive impairment with and without vascular disease. Neuropsychology. 2007;21:706–712. doi: 10.1037/0894-4105.21.6.706. [DOI] [PubMed] [Google Scholar]
- Owen A.M., McMillan K.M., Laird A.R., Bullmore E. N-back working memory paradigm: a meta-analysis of normative functional neuroimaging studies. Human Brain Mapping. 2005;25:46–59. doi: 10.1002/hbm.20131. [DOI] [PMC free article] [PubMed] [Google Scholar]
- Pantoni L. Cerebral small vessel disease: from pathogenesis and clinical characteristics to therapeutic challenges. Lancet Neurology. 2010;9:689–701. doi: 10.1016/S1474-4422(10)70104-6. [DOI] [PubMed] [Google Scholar]
- Petersen R.C. Mild cognitive impairment as a diagnostic entity. Journal of Internal Medicine. 2004;256:183–194. doi: 10.1111/j.1365-2796.2004.01388.x. [DOI] [PubMed] [Google Scholar]
- Petersen R.C., Morris J.C. Mild cognitive impairment as a clinical entity and treatment target. Archives of Neurology. 2005;62:1160–1163. doi: 10.1001/archneur.62.7.1160. (discussion 1167) [DOI] [PubMed] [Google Scholar]
- Petersen R.C., Doody R., Kurz A., Mohs R.C., Morris J.C., Rabins P.V., Ritchie K., Rossor M., Thal L., Winblad B. Current concepts in mild cognitive impairment. Archives of Neurology. 2001;58:1985–1992. doi: 10.1001/archneur.58.12.1985. [DOI] [PubMed] [Google Scholar]
- Pihlajamaki M., Sperling R.A. Functional MRI assessment of task-induced deactivation of the default mode network in Alzheimer's disease and at-risk older individuals. Behavioural Neurology. 2009;21:77–91. doi: 10.3233/BEN-2009-0231. [DOI] [PMC free article] [PubMed] [Google Scholar]
- Price C.J., Friston K.J. Scanning patients with tasks they can perform. Human Brain Mapping. 1999;8:102–108. doi: 10.1002/(SICI)1097-0193(1999)8:2/3<102::AID-HBM6>3.0.CO;2-J. [DOI] [PMC free article] [PubMed] [Google Scholar]
- Prins N.D., van Dijk E.J., den Heijer T., Vermeer S.E., Jolles J., Koudstaal P.J., Hofman A., Breteler M.M. Cerebral small-vessel disease and decline in information processing speed, executive function and memory. Brain. 2005;128:2034–2041. doi: 10.1093/brain/awh553. [DOI] [PubMed] [Google Scholar]
- Pugh K.G., Lipsitz L.A. The microvascular frontal–subcortical syndrome of aging. Neurobiology of Aging. 2002;23:421–431. doi: 10.1016/s0197-4580(01)00319-0. [DOI] [PubMed] [Google Scholar]
- Qi Z., Wu X., Wang Z., Zhang N., Dong H., Yao L., Li K. Impairment and compensation coexist in amnestic MCI default mode network. NeuroImage. 2010;50:48–55. doi: 10.1016/j.neuroimage.2009.12.025. [DOI] [PubMed] [Google Scholar]
- Raichle M.E., MacLeod A.M., Snyder A.Z., Powers W.J., Gusnard D.A., Shulman G.L. A default mode of brain function. Proceedings of the National Academy of Sciences of the United States of America. 2001;98:676–682. doi: 10.1073/pnas.98.2.676. [DOI] [PMC free article] [PubMed] [Google Scholar]
- Reed B.R., Mungas D.M., Kramer J.H., Ellis W., Vinters H.V., Zarow C., Jagust W.J., Chui H.C. Profiles of neuropsychological impairment in autopsy-defined Alzheimer's disease and cerebrovascular disease. Brain. 2007;130:731–739. doi: 10.1093/brain/awl385. [DOI] [PubMed] [Google Scholar]
- Rocca M.A., Valsasina P., Absinta M., Riccitelli G., Rodegher M.E., Misci P., Rossi P., Falini A., Comi G., Filippi M. Default-mode network dysfunction and cognitive impairment in progressive MS. Neurology. 2010;74:1252–1259. doi: 10.1212/WNL.0b013e3181d9ed91. [DOI] [PubMed] [Google Scholar]
- Rombouts S.A., Barkhof F., Goekoop R., Stam C.J., Scheltens P. Altered resting state networks in mild cognitive impairment and mild Alzheimer's disease: an fMRI study. Human Brain Mapping. 2005;26:231–239. doi: 10.1002/hbm.20160. [DOI] [PMC free article] [PubMed] [Google Scholar]
- Seeley W.W., Crawford R.K., Zhou J., Miller B.L., Greicius M.D. Neurodegenerative diseases target large-scale human brain networks. Neuron. 2009;62:42–52. doi: 10.1016/j.neuron.2009.03.024. [DOI] [PMC free article] [PubMed] [Google Scholar]
- Smits M., Dippel D.W., Houston G.C., Wielopolski P.A., Koudstaal P.J., Hunink M.G., van der Lugt A. Postconcussion syndrome after minor head injury: brain activation of working memory and attention. Human Brain Mapping. 2009;30:2789–2803. doi: 10.1002/hbm.20709. [DOI] [PMC free article] [PubMed] [Google Scholar]
- Snodgrass J.G., Corwin J. Pragmatics of measuring recognition memory: applications to dementia and amnesia. Journal of Experimental Psychology. General. 1988;117:34–50. doi: 10.1037//0096-3445.117.1.34. [DOI] [PubMed] [Google Scholar]
- Speck O., Ernst T., Braun J., Koch C., Miller E., Ching L. Gender differences in the functional organization of the brain for working memory. Neuroreport. 2000;11:2581–2585. doi: 10.1097/00001756-200008030-00046. [DOI] [PubMed] [Google Scholar]
- Teipel S.J., Bokde A.L., Meindl T., Amaro E., Jr., Soldner J., Reiser M.F., Herpertz S.C., Moller H.J., Hampel H. White matter microstructure underlying default mode network connectivity in the human brain. NeuroImage. 2010;49:2021–2032. doi: 10.1016/j.neuroimage.2009.10.067. [DOI] [PubMed] [Google Scholar]
- Tullberg M., Fletcher E., DeCarli C., Mungas D., Reed B.R., Harvey D.J., Weiner M.W., Chui H.C., Jagust W.J. White matter lesions impair frontal lobe function regardless of their location. Neurology. 2004;63:246–253. doi: 10.1212/01.wnl.0000130530.55104.b5. [DOI] [PMC free article] [PubMed] [Google Scholar]
- van der Lijn F., den Heijer T., Breteler M.M., Niessen W.J. Hippocampus segmentation in MR images using atlas registration, voxel classification, and graph cuts. NeuroImage. 2008;43:708–720. doi: 10.1016/j.neuroimage.2008.07.058. [DOI] [PubMed] [Google Scholar]
- Verhage F. [Intelligence and Age: Research on Dutch People Aged Twelve to Seventy-Seven Years Old]. Van Gorcum; Assen: 1964. Intelligentie en leeftijd: onderzoek bij Nederlanders van twaalf tot zevenenzeventig jaar. [Google Scholar]
- Villeneuve S., Massoud F., Bocti C., Gauthier S., Belleville S. The nature of episodic memory deficits in MCI with and without vascular burden. Neuropsychologia. 2011;49:3027–3035. doi: 10.1016/j.neuropsychologia.2011.07.001. [DOI] [PubMed] [Google Scholar]
- Vrooman H.A., Cocosco C.A., van der Lijn F., Stokking R., Ikram M.A., Vernooij M.W., Breteler M.M., Niessen W.J. Multi-spectral brain tissue segmentation using automatically trained k-Nearest-Neighbor classification. NeuroImage. 2007;37:71–81. doi: 10.1016/j.neuroimage.2007.05.018. [DOI] [PubMed] [Google Scholar]
- Worsley K.J., Marrett S., Neelin P., Vandal A.C., Fristion K.J., Evans A. A unified statistical approach for determining significant signals in images of cerebral activation. Human Brain Mapping. 1996;4:58–73. doi: 10.1002/(SICI)1097-0193(1996)4:1<58::AID-HBM4>3.0.CO;2-O. [DOI] [PubMed] [Google Scholar]
- Zekry D., Duyckaerts C., Moulias R., Belmin J., Geoffre C., Herrmann F., Hauw J.J. Degenerative and vascular lesions of the brain have synergistic effects in dementia of the elderly. Acta Neuropathologica. 2002;103:481–487. doi: 10.1007/s00401-001-0493-5. [DOI] [PubMed] [Google Scholar]