

Abstract
Recent advances in high-throughput sequencing technologies make it increasingly more efficient to sequence large cohorts for many complex traits. We discuss here a class of sequence-based association tests for family-based designs that corresponds naturally to previously proposed population-based tests, including the classical Burden and variance-component tests. This framework allows for a direct comparison between the powers of sequence-based association tests with family- vs population-based designs. We show that for dichotomous traits using family-based controls results in similar power levels as the population-based design (although at an increased sequencing cost for the family-based design), while for continuous traits (in random samples, no ascertainment) the population-based design can be substantially more powerful. A possible disadvantage of population-based designs is that they can lead to increased false-positive rates in the presence of population stratification, while the family-based designs are robust to population stratification. We show also an application to a small exome-sequencing family-based study on autism spectrum disorders. The tests are implemented in publicly available software.
Keywords: family- and population-based association tests, sequence data, burden and variance-component tests
Introduction
Recent advances in high-throughput sequencing technologies and the availability of large study populations for many complex traits promise to lead to significant progress in understanding the genetic basis of common diseases.1, 2 Such progress is critically dependent on choice of efficient study design and statistical methods. In genome-wide association studies (GWAS), the population-based design has been widely used due to the intrinsic ease of collecting large data sets needed to identify disease susceptibility variants of small effects.3 The family-based design has, therefore, been less popular. However, family-based designs have important advantages, including well-known robustness to population stratification, and ability to identify technological artifacts in the data. Furthermore, family-based designs allow testing of hypotheses that are difficult to test with unrelated individuals.4 For example, they are indispensable in the study of de novo variation, and can, therefore, be a powerful design for complex traits that have an important de novo component, as it is believed to be the case for autism spectrum disorders (ASDs) and schizophrenia.5, 6 They also allow testing of parent-of-origin effects.7
Many tests have been proposed for population-based designs,8, 9, 10, 11, 12, 13, 14, 15, 16, 17, 18, 19, 20, 21, 22 and among them two main classes of tests can be distinguished: the Burden test12 and the variance-component test.19 Comparatively, for family-based designs there has been relatively little development. An extension of the family-based association test (FBAT23) to sequence data has been recently proposed, and corresponds naturally to the population-based Burden test (De et al24).
We introduce here a class of FBATs that includes the Burden and the variance-component tests as particular cases, and have natural correspondence to existing tests for population-based designs.25 Both the Burden and the variance-component tests test the null hypothesis of no genetic variant in the region being associated with disease. However, they make different assumptions on the distribution of effect sizes, and, therefore, their performance depends on the underlying disease model. In particular, the Burden test tends to be more powerful when a large proportion of genetic variants in the region are associated with disease, while the variance-component test tends to be more powerful when the proportion of disease associated variants in a region is small, and/or there are both risk and protective variants in the region being tested. These tests are applicable to different family structures, including nuclear families and sibships.
Methods
SKAT for family-based designs
Although the methods we present are applicable to more general family structures (including nuclear families), for the sake of simplicity we choose to show the theoretical derivations for the simplest family design, namely the trio design. We assume that n trios (one offspring and the two biological parents) have been sequenced in a region of interest, G, such as a gene. For the ith trio, we assume the offspring trait is denoted by Yi and the offspring genotype at the jth variant in G is coded as  . We assume a generalized linear model that relates the trait value Y to the genotype data:
where h(·) is the corresponding link function, and can be the identity function when traits are continuous, or the logistic function when traits are dichotomous;  are regression coefficients for the covariates
  that we want to adjust for. Let
  .
.
To test the null hypothesis of no genetic effects
 |
we assume that each βj follows an arbitrary distribution with mean 0 and variance  , that is, E(βj)=0 and
  . Then to test
  we can use the variance-component score statistic proposed in Zhang and Lin26:
 |
where for continuous traits  , and for dichotomous traits
  ; C is the
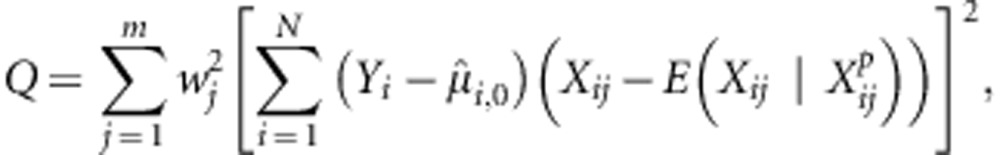
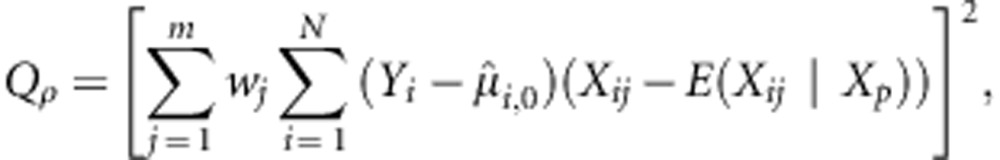
  covariate matrix; Y is the vector of phenotype values for all the offspring in the data set. Also, for the weighted-linear kernel:
 |
where X is the (n,m) genotype matrix, Xp is the parental genotype data, and 
 represent variant weights that can be chosen to depend on the data, or can be external weights, for example, reflecting functional predictions. As in Wu et al19 we take
  where
where  is the estimated variant frequency based on parental genotypes alone. Under the null hypothesis, E(X|Xp) can be calculated using the laws of Mendelian transmission. When parental genotypes are not completely known, and other family structures such as sibships are available, Rabinowitz and Laird27 have developed an algorithm that specifies the distribution of offspring genotypes conditional on the sufficient statistic for the parental genotypes.
Q has a simple expression:
 |
where  is the parental data for family i at variant j.
The main difference between this family-based test and its population-based counterpart comes from the specification of the null distribution of Q. Unlike the case for population-based tests, for the family-based test we condition on the parental genotypes Xp (or the sufficient statistic, when parental genotypes are not available) and on the trait values Y and treat the offspring genotypes X as random. If the assumption that  is multivariate normal holds, then it can be shown that the null distribution of Q can be approximated by a mixture of χ2-distributions as follows:
 |
where  are the eigenvalues of matrix
  with
with
 |
To estimate the variance-covariance matrix  , we can use an empirical estimator (as in Rakovski et al28). In general, Davies' method29 can be used to approximate the distribution of a linear combination of independent
  .
.
However, in our case when variants are rare (eg,  ) and sample sizes are small to modest, the normality assumption at each variant does not necessarily hold, and the above approximation can be very conservative. Therefore, to calculate the P-value for Q we use a moment matching approach. More precisely, as in Lee et al25 the P-value is calculated as
  , where F is the distribution function for
  . Here,
  where γ is the sample kurtosis. The mean, variance and kurtosis of Q can be estimated empirically by performing Monte Carlo simulations as follows. For each family i, under the null hypothesis of no association at any of the variants in a region, we replace
  with
with  or
or  with equal probability 1/2 (under the null hypothesis and assuming an additive model, the transmitted and untransmitted haplotypes are interchangeable). Although the P-value calculation involves Monte Carlo simulations, we note that only a modest number of such simulations are needed (eg, 10 000) to estimate the three moments of Q, regardless of the magnitude of the P-value.
More general class of FBATs
In the previous section we have assumed that all effects βj's are independent, and we have derived the extension of the original SKAT method19 to family-based designs. To allow for possible correlation among effects at different variants, we introduce the following family of kernels (as in Lee et al25):
 |
where 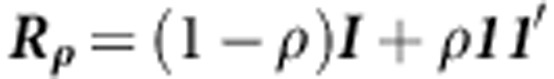 specifies an exchangeable correlation matrix. As before, the test statistic is:
When ρ=0 we get the formulation in the previous section when all effects βj are assumed independent. When ρ=1, we get
 |
which is equivalent to the test statistic in FBAT (De et al; a Burden test).
As before, for a fixed value of ρ, the null distribution of Qρ can be approximated by moment matching. When ρ=1, Davies' analytical method also works well.
Connection to population-based tests
The class of sequence-based association tests above for family-based designs has a natural correspondence to recently proposed tests for population-based designs.25 The score test statistic for the population-based design takes a similar form as Qρ as in equation (1) above (for more details, see Lee et al25) Because of this direct connection, a comparison of family-based tests and population-based tests is very natural.
Software
Software implementing the family-based tests discussed is available at (http://www.columbia.edu/ii2135/).
Results
Simulated data
We simulated one genomic region of length 1 Mb under a coalescent model using the software package COSI.30 The model used in the simulation was the calibrated model for the European population. A total of 10 000 haplotypes were generated in this region. We then randomly sampled subregions of the size of individual genes, representative of real exonic regions.
We simulate both trio and population-based data, with both dichotomous and continuous traits. We compare the two types of tests, Burden and SKAT, for both designs. Note that we are mainly interested in comparing the power of using family-based controls in a family-based design with the power of a population-based design, and for this purpose the trio design is a natural family design to compare against a population design. All variants (common and rare) are included in the analyses, and a weighting scheme that up-weights rare variants and down-weights common variants is used (see Methods section).
Type 1 error
No population stratification
To evaluate the type 1 error of the proposed tests, we have simulated data sets under the null hypothesis of no association between the offspring trait and the offspring genotypes. For dichotomous traits we simulate n=500 trios, and n=500 cases and an equal number of controls. For continuous traits we simulate n=500 trios with a normally distributed N(0,1) offspring trait, and similarly for the population-based design we simulate n=500 unrelated individuals. The results are shown in the quantile–quantile plots in Figure 1a and Supplementary Figure S1a. Both the family-based and the population-based tests result in correct type 1 error when there is no population substructure.
Figure 1.

Type 1 error, dichotomous trait. Results for the SKAT test and for the Burden test are shown, for both the trio design with n=500 trios and the case–control design with n=500 cases and n=500 controls. Ninety-five percent CI is also shown. (a) No population stratification, (b) in the presence of population stratification, (c) with Eigenstrat correction for population stratification.
Population stratification
With population stratification, we assume that our sample contains individuals from two different populations. The ancestral population is simulated in COSI (as above). The two populations are simulated following the Balding-Nichols model31 such that the distance between the two populations, FST, is 0.01, as would be encountered for closely related populations. More precisely, for each variant that has allele frequency p in the ancestral population, the allele frequencies in the two populations are drawn from a beta distribution with parameters  and
and  . For dichotomous traits, we assume the disease prevalence is 5% for population 1 and 1% in population 2. For continuous traits,
  and
and  , where
  . The results are shown in Figure 1b and Supplementary Figure S1b. While the family-based tests maintain proper control of the type 1 error, the population-based tests show substantially inflated type 1 error rates in the presence of population substructure.
To adjust for population stratification in case–control and population-based designs, principal component analysis (PCA) has been proposed as an efficient approach in the context of common genetic variants in GWAS.32 We have applied such a PC analysis to our simulated data as well. PCs were calculated based on over 80 000 variants (rare and common) that were generated across four independent chromosomes, each of size 1 Mb. The top 10 PCs were then used as covariates in our tests. We found the PCA adjustment to work well in our scenarios with a small number of discrete populations (Figure 1c and Supplementary Figure S1c), although such an adjustment may not be sufficient in more subtle scenarios, when the substructure is less discrete and the risk has a sharp spatial distribution.33
Power comparison of family- and population-based designs
We compare the power of the two tests, Burden and SKAT, for family- and population-based designs on data simulated according to the following models. For a dichotomous trait, we assume the logistic model:
 |
For the trio design, we assume n=500 trios, and n=500 cases and an equal number of controls for the case–control design. The disease prevalence in the population is 0.05.
Similarly, for a continuous trait, we assume the linear model:
 |
where  . For the trio design, we assume n=500 trios, and n=500 unrelated individuals for the population-based design.
We assume that 10–30% of all variants are disease susceptibility variants. The βj's are defined as
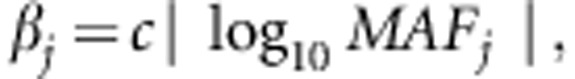 |
where c=0.4 is chosen such that when  ,
,  (ie,
(ie,  ). We also simulate a scenario with only rare disease susceptibility variants and assume a constant OR of 4 for all disease susceptibility variants with
  .
.
As SKAT is particularly advantageous in the presence of both risk and protective variants, we also simulate a scenario when 30% of the disease variants are protective (with 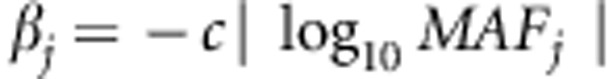 ).
).
Only risk variants
When all disease variants in a region are assumed to be risk variants, results for the two types of designs for both the Burden and SKAT tests are shown in Figure 2a. For dichotomous traits, the family-based design and the population-based design have similar power in the simulated scenarios, although at an increased sequencing cost for the family-based design. However, for continuous traits (with random ascertainment), the population-based design tends to be more powerful than the family-based design. For both types of designs, the SKAT test is more powerful than the Burden test when a small proportion of the variants in a region are in fact disease susceptibility variants (eg, 10%). The Burden test becomes slightly more powerful than the SKAT test when the percentage of causal variants in the region gets larger (eg, 30% or larger). When only rare disease susceptibility variants are assumed with a common OR of 4, the results are qualitatively the same (Supplementary Figure S2).
Figure 2.

Power at α=0.05. T is the trio design (n=500 trios) and P is the population-based design (n=500 cases and n=500 controls for the dichotomous trait, and n=500 unrelated individuals for the continuous trait).TS is the SKAT test and TB is the Burden test for the trio design. Similar notations for the population-based design. (a) All disease susceptibility variants are risk variants and (b) 30% of the disease susceptibility variants are protective.
Mixture of risk and protective variants
With 30% of disease variants assumed protective, the SKAT test performs better than the Burden test for both the family- and population-based designs (Figure 2b). As before, for continuous traits the population-based design is more powerful than the family-based design. For dichotomous traits the family and population-based designs have similar power when the Burden test is applied; however, the family-based design is more powerful when the SKAT test is applied, suggesting that the family-based design with dichotomous traits has reduced sensitivity to the presence of protective variants compared with the population-based design (due to the reduced likelihood that parents of affected offspring carry protective variants).
Effect of PC adjustment on power
We have evaluated the effect of adjusting for population stratification using PCA on the power of the population-based test. We simulated two populations as above, with an  between the two populations, and different baseline risks as well. In particular, for dichotomous traits, the two disease prevalences are 0.05 and 0.01, while for continuous traits ɛ in the linear model above is
  for population 1, and
  for population 2. The effect of the PC adjustment on power was rather small in our simulations (Supplementary Figure S3).
Application to exome-sequencing study of 50 trios
To illustrate these tests on real exome data, we have applied the two family-based tests to a small ongoing study of ASD. In total, 50 ASD children and their parents have been exome-sequenced (see Supplementary Material for more details on the data). Before analysis, we filtered out variants with Mendel error rate above 5%. A total of 18 303 genes were tested. Results are shown in Figure 3 for both tests, with no weighting scheme. Although the small number of trios precludes us from reporting experiment-wide significant results, it is reassuring that the observed distribution of gene P-values agrees well with the expectation.
Figure 3.

QQ plots, n=50 exome-sequenced trios. Results are shown for the SKAT and Burden tests, with MAF threshold (0.05) and no MAF threshold. Ninety-five percent CI is also shown.
Discussion
We have proposed a class of FBATs that includes as particular cases the Burden test and the variance-component test (SKAT). Furthermore, these family-based tests correspond directly to existing population-based tests.
We show via simulations that the SKAT test is more powerful than the Burden test when the proportion of disease susceptibility variants in a region is small, and also when there is a mixture of risk and protective variants in the region being tested. The Burden test becomes more powerful than SKAT as the proportion of disease susceptibility variants in a region increases. We have also compared the power of using family-based controls in a family (trio) design vs the power of a pure population-based design. Comparing family-based and population-based designs for dichotomous traits we find they have similar power, while for continuous traits the population-based design can be more powerful. Although the number of individuals that need to be sequenced is higher for the family designs, the main advantage of the proposed family-based tests is robustness to population stratification. Family-based designs also allow the possibility to test for important biological hypotheses (such as the role of de novo variation, and parent-of-origin effects). The population-based design is not robust to population stratification and popular methods for adjustment such as PCA, although effective when there is a small number of discrete sub-populations, can fail to do a proper adjustment in more subtle scenarios. In a recent study, Mathieson and McVean33 have shown that PCA can fail to correct for population stratification at rare variants when the underlying population substructure is continuous, and the risk has a sharp spatial distribution.
The proposed FBATs can be improved in numerous ways. As with the classical FBATs for common variants, these tests only use the within-family information. For common variants, it has been shown that great increases in power can be achieved for continuous traits by making use of the between-family information.34, 35, 36
The possibility that rare variants have larger effect sizes than more common variants has recently generated a lot of interest in investigating the usefulness of families enriched in affected individuals to identify such high-risk rare genetic variants. This question has been studied elsewhere.37 We showed there that, under a genetic heterogeneity disease model, for complex traits with small values for the sibling risk ratio (Risch's λS), as it is the case for most complex traits, affected individuals that have a close affected relative can be much more advantageous than affected individuals randomly selected from the population in detecting associations with high-risk, rare variants. For the purpose of this paper, we mainly focused on family-based designs that gain robustness to population stratification through the use of family-based controls.
Acknowledgments
The research was partially supported by National Science Foundation grant DMS-1100279 and National Institutes of Health grants R01MH095797 and 1R03HG005908 (to II-L), a Seaver Foundation grant and National Institutes of Health grants MH089025 and (to JDB) and National Institutes of Health grants R37 CA076404 and P01CA134294 (to SL and XL).
The authors declare no conflict of interest.
Footnotes
Supplementary Information accompanies the paper on European Journal of Human Genetics website (http://www.nature.com/ejhg)
Supplementary Material
References
- Mardis ER. The impact of next-generation sequencing technology on genetics. Trends Genet. 2008;24:133–141. doi: 10.1016/j.tig.2007.12.007. [DOI] [PubMed] [Google Scholar]
- Metzker ML. Sequencing technologies—the next generation. Nat Rev Genet. 2010;11:31–46. doi: 10.1038/nrg2626. [DOI] [PubMed] [Google Scholar]
- Amos CI. Successful design and conduct of genome-wide association studies. Hum Mol Genet. 2007;16:R220–R225. doi: 10.1093/hmg/ddm161. [DOI] [PMC free article] [PubMed] [Google Scholar]
- Ott J, Kamatani Y, Lathrop M. Family-based designs for genome-wide association studies. Nat Rev Genet. 2011;12:465–474. doi: 10.1038/nrg2989. [DOI] [PubMed] [Google Scholar]
- Neale BM, Kou Y, Liu L, et al. Patterns and rates of exonic de novo mutations in autism spectrum disorders. Nature. 2012;485:242–245. doi: 10.1038/nature11011. [DOI] [PMC free article] [PubMed] [Google Scholar]
- Xu B, Ionita-Laza I, Roos JL, et al. De novo gene mutations highlight patterns of genetic and neural complexity in schizophrenia. Nat Genet. 2012;44:1365–1369. doi: 10.1038/ng.2446. [DOI] [PMC free article] [PubMed] [Google Scholar]
- Rampersaud E, Mitchell BD, Naj AC, Pollin TI. Investigating parent of origin effects in studies of type 2 diabetes and obesity. Curr Diabetes Rev. 2008;4:329–339. doi: 10.2174/157339908786241179. [DOI] [PMC free article] [PubMed] [Google Scholar]
- Li B, Leal SM. Methods for detecting associations with rare variants for common diseases: application to analysis of sequence data. Am J Hum Genet. 2008;83:311–321. doi: 10.1016/j.ajhg.2008.06.024. [DOI] [PMC free article] [PubMed] [Google Scholar]
- Madsen BE, Browning SR. A groupwise association test for rare mutations using a weighted sum statistic. PLoS Genet. 2009;5:e1000384. doi: 10.1371/journal.pgen.1000384. [DOI] [PMC free article] [PubMed] [Google Scholar]
- Price AL, Kryukov GV, de Bakker PI, et al. Pooled association tests for rare variants in exon-resequencing studies. Am J Hum Genet. 2010;86:832–838. doi: 10.1016/j.ajhg.2010.04.005. [DOI] [PMC free article] [PubMed] [Google Scholar]
- Liu DJ, Leal SM. A novel adaptive method for the analysis of next-generation sequencing data to detect complex trait associations with rare variants due to gene main effects and interactions. PLoS Genet. 2010;6:e1001156. doi: 10.1371/journal.pgen.1001156. [DOI] [PMC free article] [PubMed] [Google Scholar]
- Morris AP, Zeggini E. An evaluation of statistical approaches to rare variant analysis in genetic association studies. Genet Epidemiol. 2010;34:188–193. doi: 10.1002/gepi.20450. [DOI] [PMC free article] [PubMed] [Google Scholar]
- King CR, Rathouz PJ, Nicolae DL. An evolutionary framework for association testing in resequencing studies. PLoS Genet. 2010;6:e1001202. doi: 10.1371/journal.pgen.1001202. [DOI] [PMC free article] [PubMed] [Google Scholar]
- Bhatia G, Bansal V, Harismendy O, et al. A covering method for detecting genetic associations between rare variants and common phenotypes. PLoS Comput Biol. 2010;6:e1000954. doi: 10.1371/journal.pcbi.1000954. [DOI] [PMC free article] [PubMed] [Google Scholar]
- Basu S, Pan W. Comparison of statistical tests for disease association with rare variants. Genet Epidemiol. 2010;35:606–619. doi: 10.1002/gepi.20609. [DOI] [PMC free article] [PubMed] [Google Scholar]
- Han F, Pan W. A data-adaptive sum test for disease association with multiple common or rare variants. Hum Hered. 2010;70:42–54. doi: 10.1159/000288704. [DOI] [PMC free article] [PubMed] [Google Scholar]
- Ionita-Laza I, Buxbaum J, Laird NM, Lange C. A new testing strategy to identify rare variants with either risk or protective effect on disease. Plos Genet. 2011;7:e1001289. doi: 10.1371/journal.pgen.1001289. [DOI] [PMC free article] [PubMed] [Google Scholar]
- Ionita-Laza I, Makarov V, Yoon S, et al. Finding disease variants in Mendelian disorders by using sequence data: methods and applications. Am J Hum Genet. 2011;89:701–712. doi: 10.1016/j.ajhg.2011.11.003. [DOI] [PMC free article] [PubMed] [Google Scholar]
- Wu M, Lee S, Cai T, Li Y, Boehnke M, Lin X. Rare variant association testing for sequencing data using the Sequence Kernel Association Test (SKAT) Am J Hum Genet. 2011;89:82–93. doi: 10.1016/j.ajhg.2011.05.029. [DOI] [PMC free article] [PubMed] [Google Scholar]
- Sul JH, Han B, He D, Eskin E. An optimal weighted aggregated association test for identification of rare variants involved in common diseases. Genetics. 2011;188:181–188. doi: 10.1534/genetics.110.125070. [DOI] [PMC free article] [PubMed] [Google Scholar]
- Lin DY, Tang ZZ. A general framework for detecting disease associations with rare variants in sequencing studies. Am J Hum Genet. 2011;89:354–367. doi: 10.1016/j.ajhg.2011.07.015. [DOI] [PMC free article] [PubMed] [Google Scholar]
- Tzeng JY, Zhang D, Pongpanich M, et al. Studying gene and gene-environment effects of uncommon and common variants on continuous traits: a marker-set approach using gene-trait similarity regression. Am J Hum Genet. 2011;89:277–288. doi: 10.1016/j.ajhg.2011.07.007. [DOI] [PMC free article] [PubMed] [Google Scholar]
- Laird NM, Horvath S, Xu X. Implementing a unified approach to family based tests of association. Genetic Epi. 2000;19:S36–S42. doi: 10.1002/1098-2272(2000)19:1+<::AID-GEPI6>3.0.CO;2-M. [DOI] [PubMed] [Google Scholar]
- De G, Yip WK, Ionita-Laza I, Laird NM. Rare Variant Analysis for Family-Based Design. PLoS ONE. 2013;8:e48495. doi: 10.1371/journal.pone.0048495. [DOI] [PMC free article] [PubMed] [Google Scholar]
- Lee S, Wu M, Lin X. Optimal tests for rare variant effects in sequencing associ-ation studies. Biostatistics. 2012;13:762–775. doi: 10.1093/biostatistics/kxs014. [DOI] [PMC free article] [PubMed] [Google Scholar]
- Zhang D, Lin X. Hypothesis testing in semiparametric additive mixed models. Biostatistics. 2003;4:57–74. doi: 10.1093/biostatistics/4.1.57. [DOI] [PubMed] [Google Scholar]
- Rabinowitz D, Laird N. A unified approach to adjusting association tests for population admixture with arbitrary pedigree structure and arbitrary missing marker information. Hum Hered. 2000;50:211–223. doi: 10.1159/000022918. [DOI] [PubMed] [Google Scholar]
- Rakovski CS, Xu X, Lazarus R, Blacker D, Laird NM. A new multimarker test for family-based association studies. Genet Epidemiol. 2007;31:9–17. doi: 10.1002/gepi.20186. [DOI] [PubMed] [Google Scholar]
- Davies RB. Algorithm AS 155: the distribution of a linear combination of χ2 random variables. Appl Stat. 1980;29:323–333. [Google Scholar]
- Schaffner SF, Foo C, Gabriel S, Reich D, Daly MJ, Altshuler D. Calibrating a coalescent simulation of human genome sequence variation. Genome Res. 2005;15:1576–1583. doi: 10.1101/gr.3709305. [DOI] [PMC free article] [PubMed] [Google Scholar]
- Balding DJ, Nichols RA. A method for quantifying differentiation between populations at multi-allelic loci and its implications for investigating identity and paternity. Genetica. 1995;96:3–12. doi: 10.1007/BF01441146. [DOI] [PubMed] [Google Scholar]
- Price AL, Patterson NJ, Plenge RM, et al. Principal components analysis corrects for stratification in genome-wide association studies. Nat Genet. 2006;38:904–909. doi: 10.1038/ng1847. [DOI] [PubMed] [Google Scholar]
- Mathieson I, McVean G. Differential confounding of rare and common variants in spatially structured populations. Nat Genet. 2012;44:243–246. doi: 10.1038/ng.1074. [DOI] [PMC free article] [PubMed] [Google Scholar]
- Van Steen K, McQueen MB, Herbert A, et al. Genomic screening and replication using the same data set in family-based association testing. Nat Genet. 2005;37:683–691. doi: 10.1038/ng1582. [DOI] [PubMed] [Google Scholar]
- Ionita-Laza I, McQueen MB, Laird NM, Lange C. Genomewide weighted hypothesis testing in family-based association studies, with an application to a 100 K scan. Am J Hum Genet. 2007;81:607–614. doi: 10.1086/519748. [DOI] [PMC free article] [PubMed] [Google Scholar]
- Won S, Wilk JB, Mathias RA, et al. On the analysis of genome-wide association studies in family-based designs: a universal, robust analysis approach and an application to four genome-wide association studies. PLoS Genet. 2009;5:e1000741. doi: 10.1371/journal.pgen.1000741. [DOI] [PMC free article] [PubMed] [Google Scholar]
- Ionita-Laza I, Ottman R. Study designs for identification of rare disease variants in complex diseases: the utility of family-based designs. Genetics. 2011;189:1061–1068. doi: 10.1534/genetics.111.131813. [DOI] [PMC free article] [PubMed] [Google Scholar]
- DePristo MA, Banks E, Poplin R, et al. A framework for variation discovery and genotyping using next-generation DNA sequencing data. Nat Genet. 2011;43:491–498. doi: 10.1038/ng.806. [DOI] [PMC free article] [PubMed] [Google Scholar]
- Li H, Durbin R. Fast and accurate short read alignment with Burrows-Wheeler transform. Bioinformatics. 2009;25:1754–1760. doi: 10.1093/bioinformatics/btp324. [DOI] [PMC free article] [PubMed] [Google Scholar]
- McKenna A, Hanna M, Banks E, et al. The genome analysis toolkit: a MapReduce framework for analyzing next-generation DNA sequencing data. Genome Res. 2010;20:1297–1303. doi: 10.1101/gr.107524.110. [DOI] [PMC free article] [PubMed] [Google Scholar]
Associated Data
This section collects any data citations, data availability statements, or supplementary materials included in this article.