Abstract
The fibroblast growth factor receptor 2 (FGFR2) locus has been consistently identified as a breast cancer risk locus in independent genome-wide association studies. However, the molecular mechanisms underlying FGFR2-mediated risk are still unknown. Using model systems we show that FGFR2-regulated genes are preferentially linked to breast cancer risk loci in expression quantitative trait loci analysis, supporting the concept that risk genes cluster in pathways. Using a network derived from 2,000 transcriptional profiles we identify SPDEF, ERα, FOXA1, GATA3 and PTTG1 as master regulators of fibroblast growth factor receptor 2 signalling, and show that ERα occupancy responds to fibroblast growth factor receptor 2 signalling. Our results indicate that ERα, FOXA1 and GATA3 contribute to the regulation of breast cancer susceptibility genes, which is consistent with the effects of anti-oestrogen treatment in breast cancer prevention, and suggest that fibroblast growth factor receptor 2 signalling has an important role in mediating breast cancer risk.
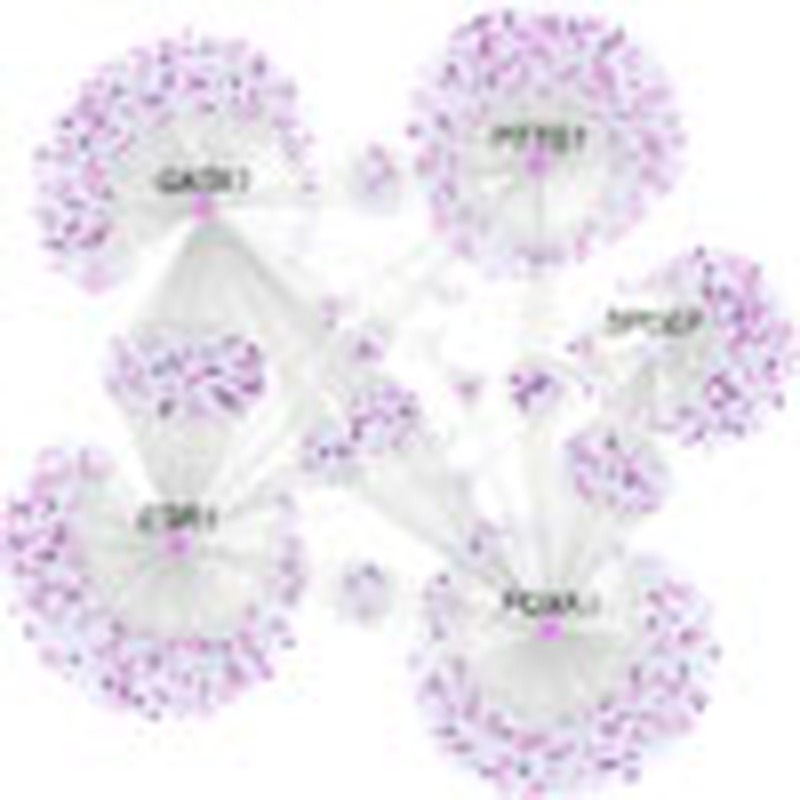 FGFR2 gene variation is associated with breast cancer risk but the molecular mechanism is unknown. Fletcher et al. provide a link between FGFR2 signalling and breast cancer susceptibility by demonstrating that FGFR2 signalling activates the ERa transcriptional network, which drives transcription of risk genes.
Nearly 70 loci show significant association with breast cancer risk in genome-wide association studies (GWAS)1. However, in most cases we do not yet understand how these loci contribute to the risk of developing cancer. A locus within an intron of the FGFR2 (fibroblast growth factor receptor 2) gene is consistently the most strongly associated with risk1,2,3. Here we take a systems biology approach to examine the regulatory network in breast cancer, how it is perturbed by FGFR2 signalling and how the identified network and its master regulators relate to disease risk.
The highly significant association of the FGFR2 locus with breast cancer risk2 has been replicated in multiple studies in Europeans3, Asians and African-Americans4. The risk is for ER+ disease5. The known role of FGFR2 signalling, the occurrence of FGFR2 gene amplification in breast cancer and the location of the risk SNPs (single-nucleotide polymorphism) within its intron, make FGFR2 a plausible mediator of risk. Functional studies suggest that the risk allele increases FGFR2 gene expression6, most likely in mammary epithelial cells, but recent genotype-expression correlations in breast tumours have failed to confirm an association of the risk SNPs either with expression of FGFR2 (refs 7, 8) or with other nearby potential target genes (K.B.M., unpublished observation). However, studies in the mouse have shown that FGFR2 has an important role in mammary development9 and in maintenance of breast tumour initiating cells10, consistent with a role for FGFR2 in conferring risk.
FGFR2 signalling cascades have been studied in some detail11, but less is known about the resulting changes in gene expression and how different risk genotypes might affect this response. Gene expression changes are ultimately mediated by the activity of transcription factors (TFs). In a number of systems, such as embryonic stem cells12 or glioblastoma13, it has been demonstrated that a small number of TFs act as master regulators (MRs) that co-ordinate cellular behaviour. MRs can be identified by deriving TF-centric regulatory networks using algorithms such as ARACNe14, where each TF in the network is connected to a set of genes that it directly regulates (referred to as a ‘regulon’). Enrichment of a relevant gene signature in each of the regulons can point to the TFs acting as MRs of the response or phenotype (master regulator analysis, MRA)13,14,15.
Here we describe a network-based strategy to uncover the molecular mechanism underlying breast cancer risk. We identify the TFs acting as MR of the FGFR2 response and demonstrate that FGFR2-responsive genes and genes in the regulons of the MRs are linked to GWAS hits. Our results suggest that the risk-associated with altered FGFR2 signalling is due to altered activity of the ERα-associated transcriptional network (TN) that includes SPDEF and we provide evidence that the FGFR2 signalling pathway is an important contributor to ER+ disease risk.
Results
Deriving an FGFR2-associated gene expression signature
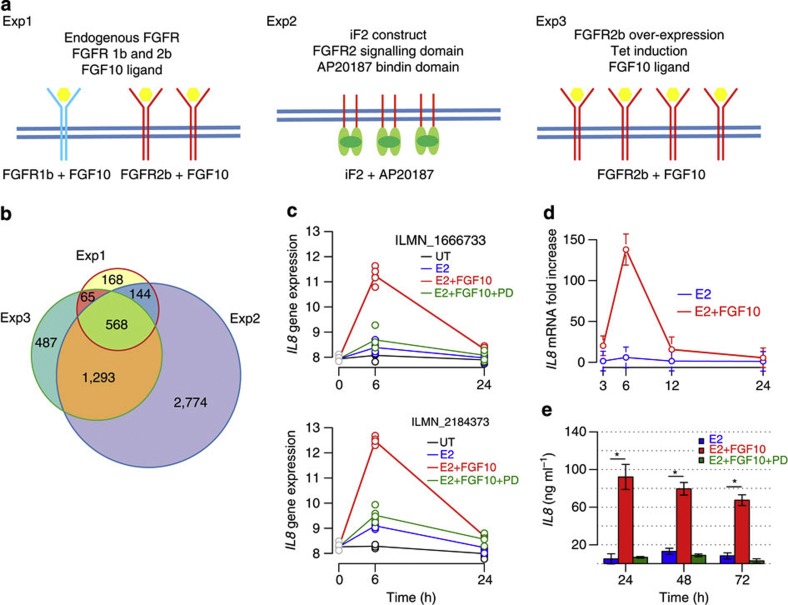
To examine the effects of FGFR2 signalling in breast cancer, we established three model systems for FGFR2 signalling. As the FGFR2 locus primarily confers risk of ER+ disease, we chose to study the ER-dependent breast cancer cell line MCF-7 (Fig. 1a). First, we stimulated endogenous FGFRs (FGFR1b and FGFR2b) with FGF10 (Exp1). FGF10 has higher affinity for FGFR2b, but can also signal through FGFR1b16. Second, we used a system where the FGFR2-kinase domain is linked to a dimerization domain (iF2 construct)17 and the kinase is activated artificially by adding the small molecule AP20187 (Exp2). Third, we overexpressed the full-length FGFR2b from a tetracycline-inducible expression vector and again activated the receptor using FGF10 (Exp3). In each experiment, MCF-7 cells were synchronised by oestrogen starvation, before adding minimal levels of estradiol in conjunction with the relevant FGFR stimulus (Methods). Supplementary Figs S1–S3 summarize the experimental design and results. Gene expression was examined at multiple time points and the software limma was used to call differentially expressed genes (DEGs) (Supplementary Methods). Principal component analysis demonstrated low experimental variation and the specificity of the FGFR response (Supplementary Figs S1–S3). The gene expression response to estradiol increased from 6 to 24 h. In contrast, the FGF10 response in Exp1 and 3 was greatest after 6 h. In Exp2, where AP20187 was used to stimulate FGFR2, the response continued to increase with time. Each estradiol plus FGFR2 stimulation was compared with estradiol stimulation alone, ensuring that the derived DEG list is FGFR2 specific. Figure 1b summarizes the number of DEG called in each of the experiments (Exp1–3). A full list of DEG derived from each experiment is available in the R package Fletcher2013a.
Figure 1. Derivation and validation of the FGFR2 gene expression signatures.
(a) A schematic of FGFR2 expression systems used to derive the gene expression signatures Exp1–3. (b) Venn diagram depicting the overlap between the genes deregulated after FGFR2 signalling in the experimental systems Exp1–3. Each list of FGFR2-regulated genes was derived as a contrast between the FGFR2 stimulus with estradiol versus estradiol only treatment to obtain the FGFR2-specific response. Limma analytical contrasts to derive the expression signatures were Exp1: E2.FGF10 versus E2, Exp2: E2.AP20187 versus E2 and Exp3: TET.E2.FGF10 versus TET.E2. (c–e) Confirmation of gene expression microarray response by RT–PCR and protein expression: (c) gene expression as measured by two IL8 microarray probes (ILM-1666733 and ILMN_2184373) in arbitrary units; (d) RNA levels detected by RT–PCR and (e) protein secretion of IL8 after FGF10.E2 stimulation of MCF-7 cells versus E2 treatment only. Error bars show the s.d. from three biological replicates. (*P<0.05, multiple testing corrected two sample t-test) UT: untreated; E2: estradiol; PD: FGFR2-kinase inhibitor PD173074.
The microarray data were confirmed in independent biological replicates by performing quantitative RT–PCR for a number of selected genes. IL8 is one of the most strongly induced genes and we demonstrate that increased IL8 mRNA expression is detected similarly by two microarray probes and by RT–PCR (Fig. 1c,d). Furthermore, we find that IL8 secretion increased after FGF10 stimulation (Fig. 1e). Both increased expression and secretion were blocked by the FGFR kinase inhibitor PD173074, confirming that the effect is FGFR specific.
FGFR2-regulated genes are linked to breast cancer risk loci
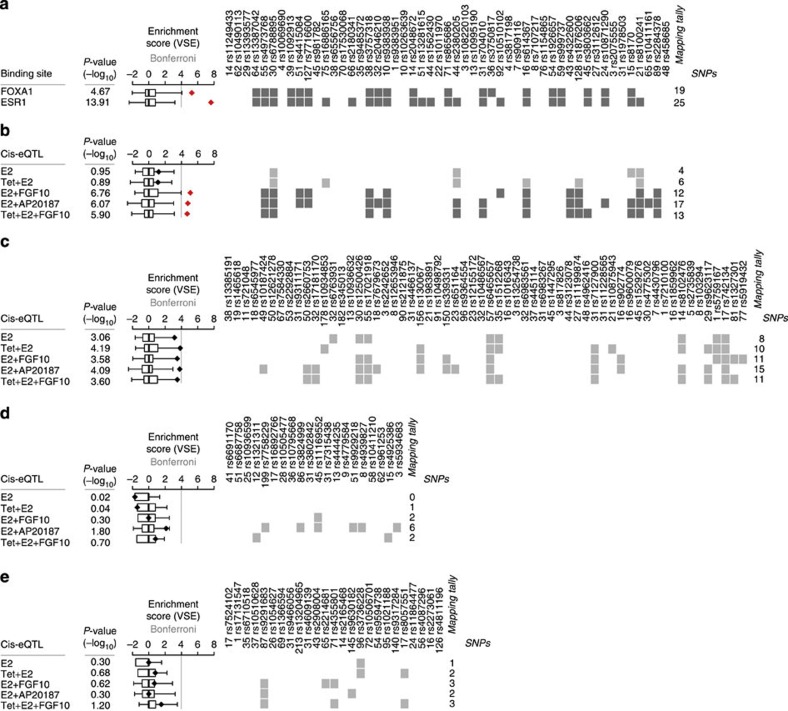
As the FGFR2 locus is strongly associated with breast cancer risk, we wished to examine whether FGFR2-regulated genes are risk genes themselves. To allow us to map risk SNPs to genes, we combined variant set enrichment analysis (VSE)18 with expression quantitative trait loci (eQTL) analysis. eQTL are polymorphisms associated with changes in gene expression. Our analysis examined whether or not breast cancer risk SNPs, and SNPs in linkage disequilibrium (LD) with these, can act as eQTL for particular groups of genes, such as FGFR2-responsive genes. This cis-eQTL/VSE analysis was carried out between breast cancer risk SNPs and the FGFR2 gene signatures (Exp1–3). First, we repeated the VSE analysis with the currently reported list of 51 independent breast cancer GWAS hits ((ref. 18) and GWAS catalogue). Rather than examining an effect of the tagging SNP at each GWAS locus, this method defines an associated variant set (AVS) of SNPs in linkage with each tagging SNP (D′=0.99, LOD >3; similar results were obtained with using r2 >.8 in the AVS selection) and then tests whether this set is associated with chromatin features (Methods). As previously reported18, we found that FOXA1- and ESR1-binding sites are significantly enriched in the breast cancer AVS (Fig. 2b). Next we carried out a cis-eQTL analysis between the risk AVS and potential target genes, using gene expression profiles and genotype data from 997 breast cancer samples (METABRIC discovery data set19) in 400 kb windows around each SNP cluster. This analysis found that among the genes linked to the risk AVS, there was a significant enrichment for FGFR2-responsive genes (Exp1–3: E2+FGF10, E2+AP20187, Tet+E2+FGF10, each compared with E2 treatment alone; Fig. 1c), but not for oestrogen responsive genes (E2 and Tet+E2, each compared with vehicle treatment, Fig. 2). (In this system, the E2 response compares resting and cycling cells and is likely to include many genes associated with this change in the cell cycle.) A cis-eQTL analysis of the FGFR2 and E2 gene signatures with AVS for prostate or colorectal cancer GWAS and bone mineral density (BMD) did not shown any significant associations (Fig. 1d–f). In conclusion, we provide evidence that breast cancer risk SNPs are preferentially linked to genes that, on a background of oestrogen stimulation, are responsive to FGFR2 signalling.
Figure 2. Enrichment of the breast cancer AVS in FGFR2-related gene loci.
(a) VSE plots for the breast cancer AVS and the FOXA1 and ESR1 cistromes in E2-treated MCF-7 cells. (b) E2- and FGFR2-responsive genes in MCF-7 cells are tested for functional association with risk AVS by cis-eQTL analysis using METABRIC tumour gene expression data. (c–e) The same genes tested for functional association with other cancer risk AVS by cis-eQTL: (c) the prostate cancer AVS, (d) the colorectal cancer AVS and (e) the bone mineal density AVS. Box plots in each panel show the normalized null distributions (box: 1st–3rd quartiles; bars: extremes). Black diamonds show the corresponding VSE scores. Red diamonds highlight mapping tallies that satisfy a Bonferroni-corrected threshold for significance (P<1e-4). P-values are based on null distributions from 1,000 MRVSs. Binary matrices show clusters of risk-associated and linked SNPs with at least one SNP mapping to the genomic annotations and validated by cis-eQTL analysis. The bottom row of numbers indicates the number of linked SNPs in each SNP cluster. The mapping tally shows the number of clusters per annotation. Rows highlighted in dark grey show statistically significant enrichment. The cis-eQTL analysis extends the original VSE method by conditioning the mapping tallies to functional links. Non-disjoint AVSs with risk-associated SNPs in LD were merged in order to avoid inflated mapping tallies.
Regulatory network derived from gene expression profiles
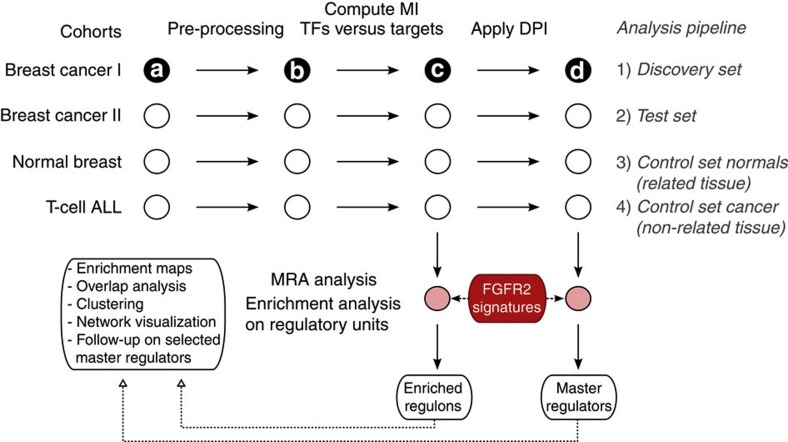
To better understand the pathways involved in the FGFR2 signalling response, we constructed a regulatory network for breast cancer based on the METABRIC data set19 (computational pipeline summarized in Fig. 3). METABRIC consists of a discovery and a validation cohort of 997 and 995 breast tumour samples each, for which gene expression data are available (=a: gene expression data in Fig. 3). The data were normalized and probes with low variation removed from the analysis (b: filtered gene expression data in Fig. 3). The TN14 was then derived by computing the mutual information (MI) between annotated TFs (n=1,388 probes) and all potential targets (n=20 K probes after filtering) in each cohort (=c in Fig. 3) (Methods). In this network, each TF has been assigned a list of candidate regulated genes referred to as its regulon. In the TN, each target can be linked to multiple TFs and regulation can occur as a result of both direct (TF1–target) and indirect interactions (TF1–TF2–target)15. We therefore applied the data processing inequality (DPI) (Methods), which removes the weakest interaction in any triangle of two TFs and a target gene, thus preserving the dominant TF-target pairs, resulting in the filtered TN (=d in Fig. 3). The filtered TN has less complexity and highlights the most significant interactions.
Figure 3. Network inference and MRA flowchart.
Four independent gene expression data sets (breast cohort I and II, normal breast and T-ALL) were analysed in parallel with the ARACNe algorithm to derive TF-centric regulatory networks. Master regulators were identified by examining the overlap between the targets in each regulon in the network and the FGFR2 gene expression signatures using the MRA (a: gene expression data; b: filtered gene expression data; c: TN; d: DPI-filtered transcriptional network; MI, mutual information; DPI, data processing inequality).
Master regulators of FGFR2 signalling
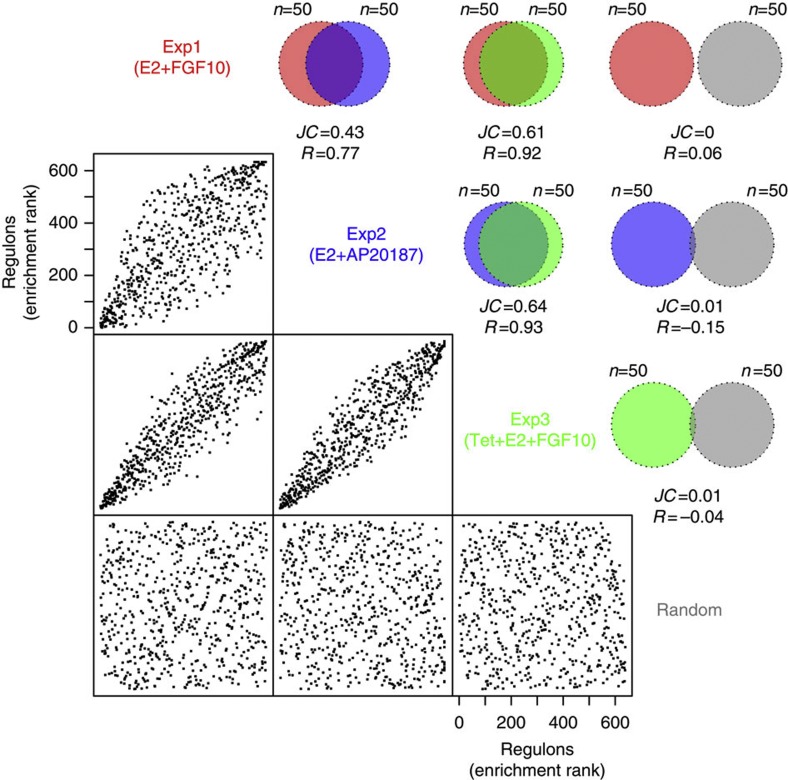
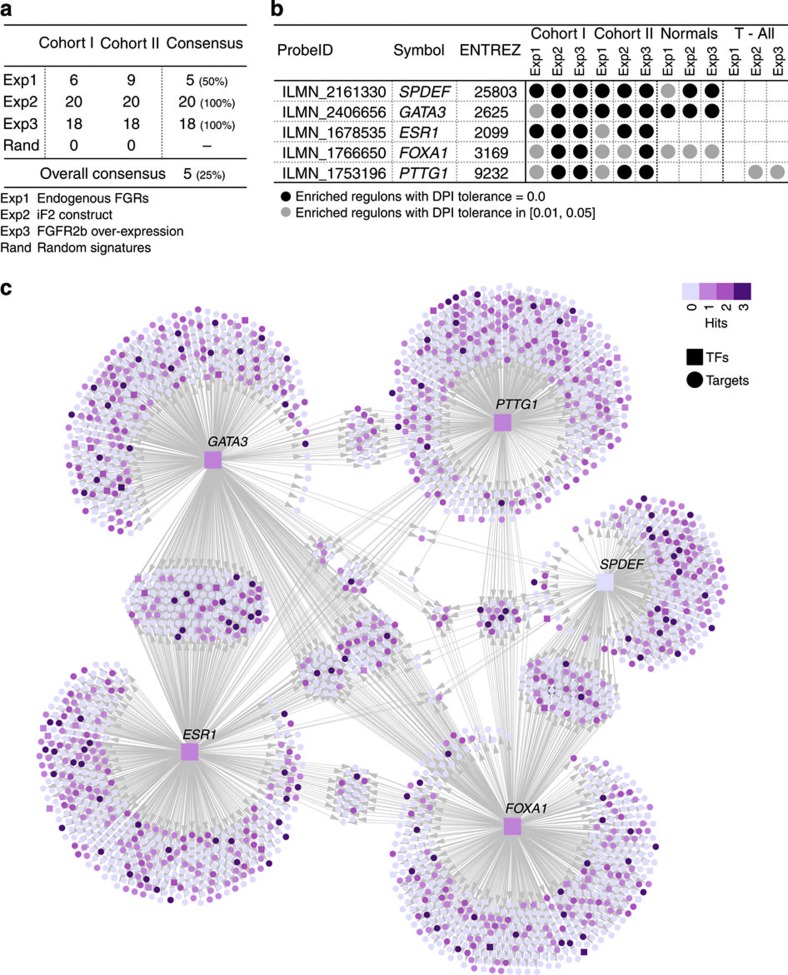
Next, we used MRA to identify the MRs of FGFR2 signalling by testing for significant enrichment of FGFR2-responsive genes (Exp1–3) in each regulon. We first ranked regulons based on the enrichment score obtained on the unfiltered TN and found good agreement between Exp1–3, both for the total set of regulons as well as the top 50 regulons (Fig. 4), and also between cohort I and II (Supplementary Figs S4–S6), suggesting that our three model systems identify similar sets of regulated genes following FGFR2 signalling. Then, to define a smaller set of functionally important MRs, we applied the MRA to the filtered TN and found that 20 regulons are significantly enriched across the two breast cancer cohorts in at least one experiment (Fig. 5a). The agreement between the two cohorts was very high. When a DPI tolerance of 0.05 is allowed, the regulons of five MRs were enriched in both cohorts in all three experimental systems (a DPI tolerance from 0.01 to 0.05 gives the same consensus). These were SPDEF, ESR1 and its co-factors FOXA1 and GATA3, and PTTG1 (Fig. 5b). None of the identified regulons were significantly enriched using a random gene set of comparable size. When carrying out the MRA on a network derived for a completely independent breast cancer data set (TCGA breast cancer data set)20, regulons for four of the five MRs (SPDEF, ERα, FOXA1 and GATA3) were again found to be enriched in FGFR2-responsive genes (Supplementary Fig. S7). We also computed a filtered TN for 144 normal breast tissue samples from METABRIC patients. In this network, three of the five MRs (SPDEF, GATA3 and FOXA1) were enriched, and this enrichment was found in all three experiments (Fig. 5b). Interestingly, ESR1 and PTTG1 regulons are not enriched, possibly reflecting the fact that in normal breast the majority of epithelial cells are ER−, non-dividing cells21. GATA3 and FOXA1 have been postulated to function upstream of ER and are required early in mammary development22,23 and might therefore be more easily detected in the network for normal tissue. We also derived a filtered TN for a gene expression data set from T-cell acute lymphoblastic leukaemia (T-ALL)24 and found that the PTTG1 regulon in this network was enriched for two of the three FGFR2 gene signatures (Exp2 and Exp3). The enrichment for PTTG1 in two distinct cancer tissues, but not in normal breast tissue, may indicate a large number of proliferation-related (and not breast cancer-specific) genes in the PTTG1 regulon. Our analysis of the extended MR list supports this idea (Supplementary Fig. S8 and Supplementary Methods). An association of PTTG1 with proliferation was confirmed by carrying out the MRA using a proliferation-based gene signature, termed meta-PCNA25, on both cohort I and II of the METABRIC data. The most strongly enriched regulon in both cohorts is that of PTTG1, while none of the other MR regulons are enriched (Supplementary Table S1). Figure 5c depicts the regulons of the five MRs of the FGFR2 response in our breast cancer gene expression network, highlighting FGFR2-responsive genes (purple shading). Interestingly, transcription of SPDEF was not perturbed by FGFR2, but many of its target genes were (Fig. 5c, Supplementary Fig. S9), suggesting that the activity of this TF is regulated at the protein, rather than the transcriptional level. The identification of SPDEF highlights the increased power of the MRA over simple differential expression-based approaches.
Figure 4. MRA agreement among different FGFR perturbation experiments.
The scatter plots show the agreement in the ranking of all regulons by the enrichment P-value, between the different experimental perturbations of FGFR2 signalling: Exp1=E2+FGF10, Exp2=E2+AP20187 and Exp3=Tet+E2+FGF10. Each dot represents one regulon (that is, one TF and all its targets) in the TN derived from cohort I. The correlation coefficient R is given for each pairwise ranking. The corresponding Venn diagrams show the level of agreement on the ranking for the top 50 enriched regulons, expressed by the JC.
Figure 5. MRs of FGFR2 signalling.
(a) Number of regulons enriched for FGFR2 signatures (Exp1–3) in breast cancer cohort I and cohort II and their overlap. The percentage of the overlap is given relative to the total number in cohorts I and II. There is substantial overlap between the MRs derived for different FGFR2 signatures, and the consensus corresponds to the five MRs shown in b. (b) The MRs enriched for FGFR2 signatures in breast cancer in both cohorts. Enrichment was calculated using the three expression signatures (Exp1–3) on networks derived from breast cancer cohort I and II, normal breast or T-ALL, that were filtered by DPI using either a 0 (black circle) or 0.05 threshold (grey circles). (c) Breast cancer filtered TN enriched for the FGFR2-responsive genes. The network shows the five MRs, each one comprising one TF (square nodes) and all inferred targets (round nodes) applying a DPI threshold of 0.01.
Experimental confirmation of computationally defined regulons
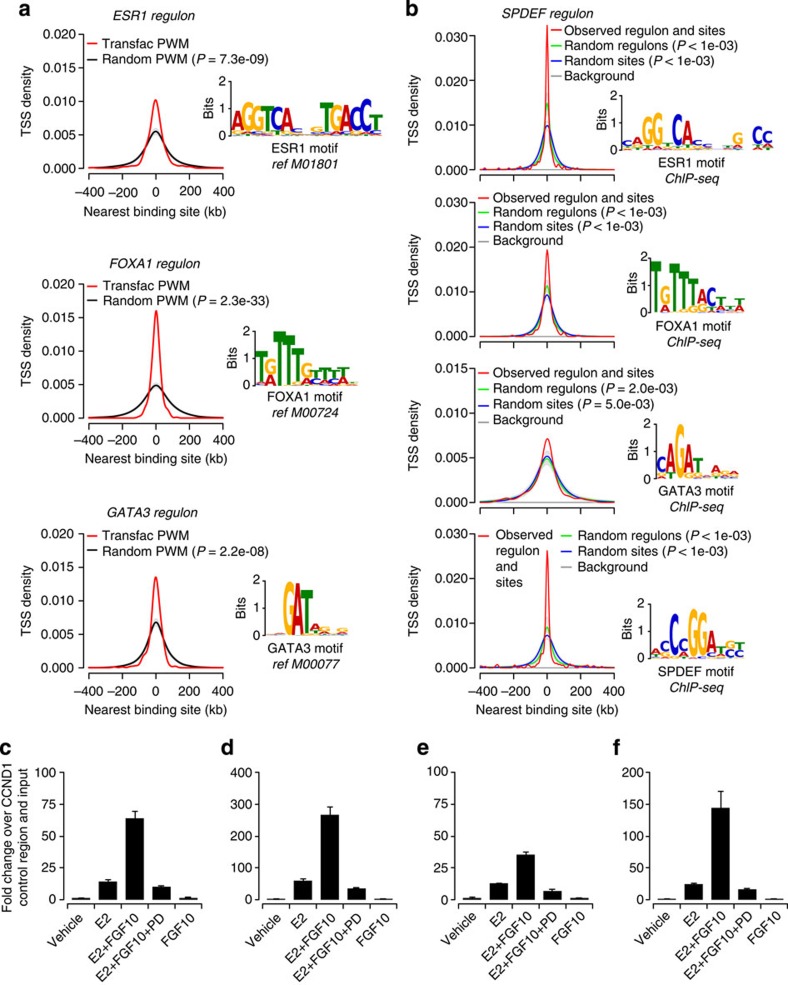
To validate the identified regulons, we examined whether there was enrichment of TF binding near transcription start sites (TSS) of genes found in the regulons of a particular MR. This validation was carried out for MRs whose regulons were enriched in the cancer and normal breast tissue, but not in T-ALL: ESR1, FOXA1, GATA3 and SPDEF. Bioinformatic analysis using position weight matrices (PWM, consensus binding motifs) from Transfac showed a strong enrichment of binding motifs for ESR1, FOXA1 and GATA3 in each of their identified regulons (Fig. 6a). Next, we examined actual TF binding and carried out triplicate chromatin immunoprecipitation (ChIP)-seq experiments for ERα and SPDEF in MCF-7 cells (Supplementary Fig. S10, Supplementary Tables S2, S3 for full QC). Figure 6b shows that SPDEF binding is strongly enriched near the promoters of its own regulon. Interestingly, these promoters are also enriched for GATA3, ESR1 and FOXA1 binding. De novo motif finding within these data sets reveals PWMs that are very similar to those previously reported26,27,28,29. Enrichment of binding by these four TFs in each other’s regulons is widespread (Supplementary Fig. S11), suggesting that these MRs function co-operatively to regulate sets of genes.
Figure 6. Validation of regulons.
(a) Enrichment of known binding motifs for ESR1, FOXA1 and GATA3 in each of their inferred regulons. The occurrence of motif sites is shown as the distance between the TSS of the genes in each regulon and the nearest motif encountered (red line). This was compared with the occurrence of random sites of the same length in the same regulons derived for a random motif (black line; mean±s.d.). Motifs are taken from Transfac. (b) Enrichment of binding sites of the ESR1, FOXA1, GATA3 and SPDEF regulons in SPDEF ChIP-seq data obtained in MCF-7 cells. A background distribution is shown as a reference line (grey line) and represents the distance between the TSS and a random peak placed in the same chromosome. (c–f) ERα occupancy changes after FGF10 signalling (mean±s.e.m.) in three technical repeats. ERα binding was analysed by ChIP–RT–PCR at the regulatory regions of four genes: (c) MYC, (d) GREB, (e) EGR2 and (f) the breast cancer susceptibility gene TOX3. Enrichment is shown relative to a negative control from the CCND1 locus. Cell stimulation with E2, FGF10 and PD (PD173074) is indicated in each panel.
The target genes for ERα, GATA3 and FOXA1 in MCF-7 cells are already well defined26,27,28 and our data fit well with these results (see above). As validation of the SPDEF and PTTG1 regulons, we carried out small interfering RNA (siRNA) knock down experiments for these TFs (previously published ESR1 data are included as positive control) to confirm that the responsive gene sets are indeed enriched in the relevant regulons. For each of these three putative MRs we find that its own regulon was significantly enriched (Supplementary Table S4). Further evidence for cross-regulation between the MRs and all five MR regulons was obtained by gene set enrichment analysis (Supplementary Fig. S12 and Supplementary Methods). The DEG list after PTTG1 knock down was enriched for genes of the PTTG1 regulon as well as additional proliferation-related regulons (Supplementary information, MR overlap and synergy analysis). There is remarkable overlap between the MRs perturbed after siPTTG1 treatment and MRs enriched with the proliferation-based meta-PCNA signature25 in both cohorts (Supplementary Table S1). Our knock-down experiments provide further experimental support for the computationally derived network structure.
Finally, to demonstrate the link between the identified MRs and FGFR2 signalling, we examined ERα occupancy at FGFR2-responsive genes using ChIP. For the binding sites tested here, ERα occupancy is induced by estradiol, but importantly this occupancy is increased by additional treatment with FGF10 and reversed by the FGFR kinase inhibitor PD173074 (Fig. 6c–f). These results were obtained for the known ER-induced genes MYC and GREB, the ER-repressed gene EGR2 and for TOX3, a likely breast cancer risk gene, which does not respond to estradiol, but is induced by FGF10. Our results show that FGF10 signalling can alter ERα occupancy at FGFR2-responsive genes.
Transcriptional modules of MRs are highly overlapping
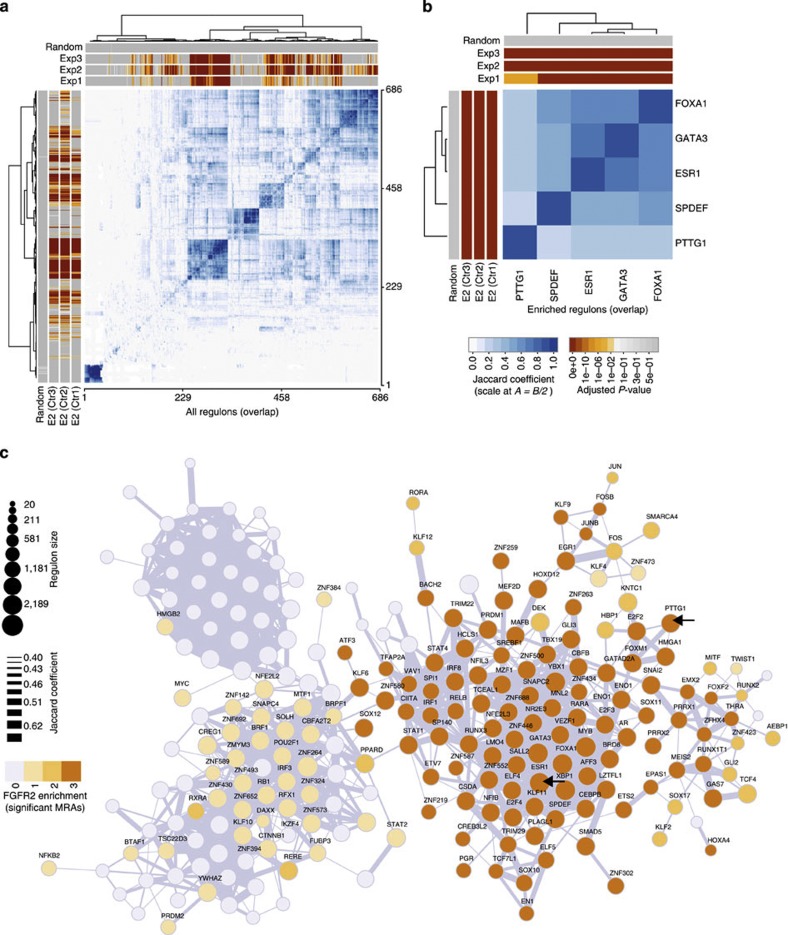
To be able to identify MRs from our gene expression network, we used the DPI filter in our bioinformatics pipeline to remove overlap between regulons. However, in a real cellular setting co-operating TFs regulate overlapping sets of genes, with the expression of individual genes being affected by the activity of multiple TFs. We therefore examined the overlap of all TF regulons (based on the unfiltered TN in cohort I) by unsupervised clustering. Figure 7a shows the Jaccard coefficient (JC) for overlap between regulons. Only a few, very highly connected TF clusters exist and the FGFR2 response is mediated by the largest cluster (centred on regulon 250 in Fig. 7a). An enlargement of these data for the five MRs (Fig. 7b) highlights the strong overlap between the ERα network of TFs (ESR1, GATA3 and FOXA1) and SPDEF and a smaller overlap with the PTTG1 regulon. The regulons most highly enriched for the FGFR2 signatures strongly overlap with those enriched for the estradiol signatures (Fig. 7a,b), but both E2 and FGFR2 unique genes exist, in keeping with our finding that the two responses peak at different times (Supplementary Figs S1a–S3a) and differ in their association with risk genes. We used RedeR30 to visualize the overlap between different TF regulons in the unfiltered TN in a network graph. The edges within this network represent inter-regulon overlaps with a JC >0.4 (Fig. 7c). The MRs ESR1, FOXA1 and GATA3 cluster very closely and the newly identified MR SPDEF is also tightly connected to this central cluster. (See Supplementary Fig. S13 for a fully annotated network.) The PTTG1 regulon, which is associated with both breast cancer and T-ALL, maps to a different part of the network (Fig. 7c). It is closely linked to E2F2 and FOXM1, which are part of the extended MR list and have previously been linked to control of proliferation31,32. The close link between these regulons was confirmed in our siRNA analysis, where the E2F2 and FOXM1 regulons were significantly perturbed by siRNA against PTTG1 (Supplementary Table S4). The relationship between clusters of TFs was explored using the previously described synergy and shadowing analyses33 (Supplementary Fig. S14 and Supplementary Methods). Our results are consistent with identification of a central ER-related MR cluster and the presence of a second cluster that is likely to be related to changes in cell proliferation.
Figure 7. Overlap between regulons in the unfiltered TN.
(a) The heatmap shows the hierarchical clustering on the Jaccard similarity coefficient (in shades of blue) computed among all regulons in the unfiltered TN derived from cohort I. Sidebars show the enrichment P-values (shades of orange) from the MRA analysis for FGFR2-associated gene expression signatures (Exp1–3) at the top of the graph and the MRA analysis for E2-associated gene expression signatures (E2 Ctrl 1–3) derived for each experiment on the left. (b) Hierarchical clustering on the Jaccard similarity coefficient focused on the overlap between the five MRs of the FGFR2 response. (c) The unfiltered TN in breast cancer, with edges depicting the overlap of regulons. The network is calculated on cohort I and different intensities of orange indicate enrichment of a regulon in 1, 2 or 3 of the FGFR2 gene signatures. Arrows highlight the ESR1 and PTTG1 regulons. Unconnected regulons and connections corresponding to JC <0.4 are not shown (a full network is shown in Supplementary Fig. S13).
Risk SNPs link to FGFR2-responsive genes in MR regulons
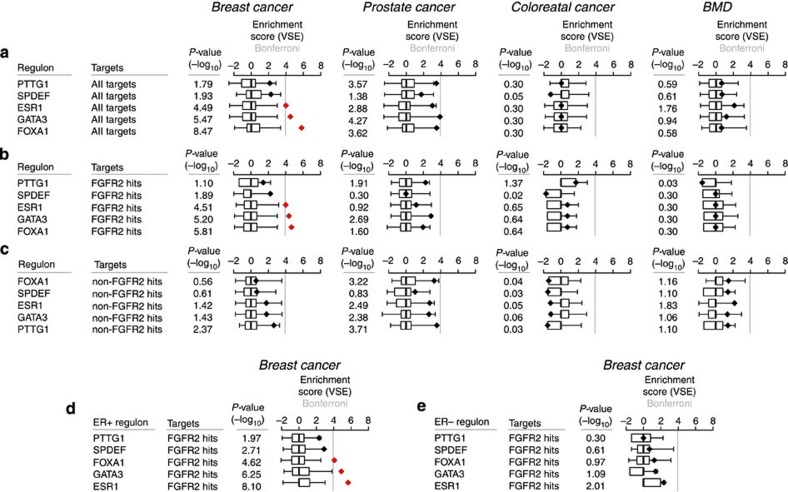
Having defined the regulons, we investigated how risk SNPs are distributed among them and carried out a cis-eQTL analysis between the risk SNP list (AVS) and the genes in the regulons for each of the MRs. Our analysis showed a statistically significant enrichment for genes in the ESR1, GATA3 and FOXA1 regulons with breast cancer risk SNPs but not prostate, colon or BMD risk SNPs (Fig. 8a). This is the first report of a statistically significant link of GATA3 with risk gene expression. Within each regulon, we found that only the FGFR2-responsive genes were associated with risk (Fig. 8b,c). However, we note that all FGFR2 responses were measured on a background of oestrogen signalling, so that ER may still play a critical role, but in conjunction with FGFR2. As an additional control, we examined whether risk is associated with ER status and only observed significant enrichment when the regulons were derived for ER+, but not ER− tumours (Fig. 8d,e), fully in keeping with the central role for ER that we postulate.
Figure 8. Enrichment of the breast cancer AVS in FGFR2 master regulators following cis-eQTL validation.
(a) VSE plots and cis-eQTL for all genes in the regulons. (b) VSE plots and cis-eQTL for genes that respond to FGFR2 perturbation. (c) VSE plots and cis-eQTL for genes that do not respond to FGFR2 perturbation. (d–e) VSE plots and cis-eQTL for genes that respond to FGFR2 perturbation using regulons either derived from ER+ (d) or ER− (e) samples. Box plots show the normalized null distributions (box: 1st–3rd quartiles; bars: extremes). Black diamonds show the corresponding VSE scores. Red diamonds highlight mapping tallies that satisfy a Bonferroni-corrected threshold for significance (P<1e–4). P-values are based on null distributions from 1,000 MRVSs.
In conclusion, we demonstrate that at least three of the identified MRs, ESR1, GATA3 and FOXA1 are linked to risk gene expression. This association with risk is restricted to the FGFR2-responsive genes in each regulon, suggesting that FGFR2 activity is an important determinant of ER+ breast cancer risk.
Discussion
Although the number of known breast cancer risk loci is increasing rapidly, we still have little knowledge of the cellular pathways that are perturbed in cancer predisposition. Here we take a systems biology approach to gain insight into pathways and networks associated with breast cancer susceptibility. We focus on FGFR2, the most significant risk locus in multiple independent GWAS1,2,3. Using eQTL analysis, we show that breast cancer risk SNPs are preferentially linked to genes affected by FGFR2 signalling, supporting the idea that breast cancer risk SNPs cluster in pathways, as has been shown for metabolic diseases34. Our findings support other evidence that risk SNPs in the intron of FGFR2 mediate their effect through altering expression of the FGFR2 gene. We identify MRs of the FGFR2 signalling response and find a central role for the ERα TN, including ESR1, FOXA1 and GATA3. In addition to these known factors, we identify SPDEF as a novel co-regulator of the ERα network. Our analysis separates this network from MRs related to proliferation changes, especially PTTG1, which is also known as securin and specifically interacts with p53 (ref. 35).
Several lines of evidence support the identification of these five MRs and regulons. The genes whose expression is altered by FGFR2 signalling were consistent across the three methods used to activate FGFR2. The gene expression networks identified from the METABRIC samples, and the MRs identified by subsequent analysis, were again consistent across the methods of FGFR2 activation and between the discovery and validation cohorts. Four of the five MRs consistently identified from the breast cancer signalling networks were absent from a similar analysis using networks obtained from another malignancy, T-ALL, as a control. The same four MRs were also identified when a parallel analysis was carried out on the TCGA breast cancer data set. Finally, the unfiltered TN for breast cancer groups together many TFs that have previously been linked to ERα activity, such as GATA3 (ref. 28), FOXA1 (ref. 27) and XBP36. The striking overlap of the network defined by our analysis with previously described regulatory circuits37 supports the validity of our approach.
Further support for the importance of these MRs comes from comparison with somatic alterations in breast cancer20. Two of the five MRs of the FGFR2 response, FOXA1 and GATA3, are frequently mutated in breast tumours20, suggesting that pathways mediating susceptibility overlap with those perturbed during cancer progression.
The identification of the ERα-network, which has long been known to be critical to mammary gland development and cancer progression, as central mediator of the FGFR2 response is consistent with the epidemiological findings that the FGFR2 risk is restricted to ER+ disease1,4. Furthermore, the identification of FOXA1 and GATA3 as TFs associated with the expression of breast cancer risk genes is consistent with functional analysis of risk loci available to date. FOXA1 has been confirmed as a mediator of risk at the TOX3 gene18 and GATA3 binds to one of the causative SNPs at the CCND1 risk locus38.
SPDEF is of interest as a MR of the FGFR2 response and as a novel cofactor of the ERα-network, as validated by both our network and ChIP-seq analysis. SPDEF is normally expressed in a range of epithelial cell types, especially in hormone-regulated tissues39, and has previously been associated with cancer: The SPDEF protein is overexpressed in breast cancer cells compared with normal tissue40,41, but is often lost in high grade, invasive tumours42. SPDEF was originally identified as a co-factor of AR43 and acts to suppress metastasis in prostate tumour models in vivo44. Similarly, SPDEF overexpression in breast cancer cell lines also results in an inhibition of invasion, migration and growth42.
Using a network approach has allowed us to distinguish two key components of the FGFR2 response: the ERα-related MRs (ESR1, FOXA1, GATA3 and SPDEF) and a proliferation-related cluster around PTTG1. These results improve on analyses based on differential gene expression, which primarily reflect increased proliferation25. By identifying specific MRs we also improve on GO-term enrichment-based methods that identify very broad biological categories45. Our approach of testing MR regulons for association with risk SNP clusters should be widely applicable to the follow-up of other GWAS.
Although consistently the ‘top hit’ in GWAS, FGFR2 is merely a contributor to a much larger picture of polygenic susceptibility. A large amount of this susceptibility remains unexplained, the so-called ‘missing heritability’. Our finding that SNPs cluster in pathways suggests that FGFR2-regulated gene loci near SNPs that may not have reached genome-wide significance may also be functional and may account for some of this missing heritability.
Our results are also relevant to prevention. The risk variant in FGFR2 has an estimated population attributable fraction of 19%, which implies that restoring FGFR2 signalling to the wild-type state in the population could in principle reduce breast cancer incidence by that amount. The network approach revealed ERα as a mediator of the FGFR2 effect, a finding fully consistent with the successful use of anti-estrogens in prevention. However, our findings strongly suggest that FGFR2 has a role in risk beyond that of ERα. If so, the FGFR2 pathway may be an additional target for both therapy and prevention46.
Methods
Cell culture
MCF-7 human breast cancer cells were cultured in DMEM supplemented with 10% HI-FCS and antibiotics. In addition, iF2-expressing cells were supplemented with 500 mg ml−1 G418 (Invitrogen) and FGFR2b overexpressing cells with 300 μg ml−1 Zeocin and 2 μg ml−1 blasticidin (Invitrogen) and tetracycline-free FCS was used (Bioscience Autogen). FGFR2b overexpression was induced by tetracycline (final concentration of 1 mg ml−1). Cell synchronisation via oestrogen deprivation was carried out for at least 3 days in phenol red-free DMEM (Invitrogen) supplemented with 5% charcoal dextran-treated HI-FBS (Hyclone) and 1% penicillin–streptomycin. All cells were grown at 37 °C in 5% CO2.
Establishment of model FGFR2 signalling systems
MCF-7 cells were transfected with iF2-pCR3.1 using Lipofectamine 2000 (Invitrogen). Single-cell clones resistant to 1,000 μg ml−1 G418 were expanded and iF2 expression confirmed by western blot and immunofluorescent staining. The FGFR2b tetracycline-inducible overexpression MCF-7 line was established by double-transfection of FspI-linearised F2b-pcDNA4/TO and pcDNA6/TR in a 1:5 ratio by DNA. Single-cell clones were expanded under selection using 500 μg ml−1 Zeocin and 3 μg ml−1 blasticidin. Tetracycline induction of FGFR2b expression was confirmed by western blot.
Stimulation of FGFR2 signalling
Oestrogen-deprived cells were stimulated with 1 nM estradiol (Sigma); 100 ng ml−1 FGF10 (Invitrogen); 100 ng ml−1 PD173074 (Sigma-Aldrich). iF2 was activated with 100 nM AP20187 (Takara Biosciences).
RNA collection and microarray processing
RNA was extracted using the miRNeasy spin column kit (Qiagen) and quality checked using an RNA 6000 Nano chip on a 2100 Bioanalyser (Agilent). RNA (250 ng; RIN>7) was used for cRNA amplification and labelling using the Illumina TotalPrep-96 kit (Ambion 4397949). cRNA was hybridized to HumanHT-12 v4 Expression BeadChips according to the Illumina protocol (Illumina WGGX DirectHyb Assay Guide 11286331 RevA). Raw image files were processed and analysed using the beadarray package47 from Bioconductor. The full data sets are available at the R package Fletcher2013a.
Quantitative RT–PCR and data analysis
After reverse transcription, quantitative PCR was performed using Power SYBR Green FAST on a 9800HT qPCR machine (all Applied Biosystems). Raw data were collected using SDS 2.3 and then further analysed in Microsoft Excel. Ct values were normalized using the ΔΔCt method to (i) levels of DGUOK and UBC housekeeping gene expression per sample and (ii) to vehicle treatment at each timepoint. All conditions were examined in three independent replicates. Relevant primers are listed in Supplementary Table S6.
IL8 ELISA
After stimulation culture media was removed daily, stored and assayed by ELISA for IL8 (Enzo Life Sciences). Absorbance was read on a PHERAstar microplate reader (BMG Labtech) and raw OD converted into protein concentration. IL8 levels per 500K cells were normalized to levels in vehicle-treated cells and corrected for media volume changes. All experimental conditions were tested in triplicate.
Chromatin immunoprecipitation
For ERα ChIP-seq, cells were oestrogen starved and E2-stimulated for 45 min. For SPDEF ChIP-seq, cells growing asynchronously in full DMEM were collected. ChIP-seq was performed as previously described48. Briefly, cells were cross-linked in 1% formaldehyde for 10 min. Nuclear extracts were prepared and sonicated using a Bioruptor (Diagenode) for 15 min on the ‘high’ setting with cycles of 30 s on and 30 s off. Sonicated lysate was mixed with Protein A Dynabeads (Invitrogen) pre-incubated with antibodies against ERα (sc543; 10 μg of antibody in 50 μl volume, diluted 1:25 in sonicated nuclear extract) and SPDEF (sc67022-X; 10 μg of antibody in 5 μl diluted 1:250 in sonicated nuclear extract) (both Santa Cruz Biotechnology). Immunoprecipitated chromatin was used to prepare Solexa sequencing libraries. The full ChIP-seq data set is available within the R package Fletcher2013b and quality control metrics are given in Supplementary Tables S2 and S3. Primers used in ChIP–RT–PCR are listed in Supplementary Table S6. The experiment was carried out in duplicate with similar results. A representative example is shown with error bars denoting the technical error in three RT–PCR repeats.
siRNA knockdown of TFs
siRNA SMARTpools (Dharmacon) targeting PTTG1 (L-004309) and SPDEF (L-020199) and a control non-targeting pool (D-001810) were transfected into MCF-7 cells using Lipofectamine RNAiMAX (Invitrogen). RNA was collected after 72 h and processed for microarray analysis. The data (available within the R package Fletcher2013a) was compared with published data49 for ESR1.
Analysis of gene expression data
The limma50 package in Bioconductor was used to call DEGs and principal component analysis demonstrated low experimental variation and the specificity of the FGFR response. The source code for the data analysis is available in the R package Fletcher2013a (also see the Vignette for Fletcher2013a).
Variant set enrichment
The VSE analysis was carried out as described by Cowper-Sal lari et al.18 Briefly, the VSE method tests enrichment of the AVS for a particular trait in a genomic annotation. Although the first represents clusters of risk-associated and linked SNPs, the second corresponds to chromosomal coordinates to which a particular property or function has been attributed. The enrichment statistics assesses the overlap between these clusters and the genomic annotation, a quantity referred to as the mapping tally. This corresponds to the number of SNP clusters in the AVS that contain at least one linked SNP that overlaps the genomic annotation. The enrichment score is then obtained by comparing the observed mapping tally to a null distribution based on random permutations of the AVS (that is, matched random variant sets—MRVS). All risk-associated SNPs were obtained from the GWAS catalogue (accessed January 2013; http:/ www.genome.gov/gwastudies/). The list of all SNPs in strong LD with each risk-associated SNP was obtained from the HapMap project data (CEPH HapMap Linkage Disequilibrium, release no. 27, NCBI B36), using LD threshold based on LOD >3 and D′ >0.99.
Extended variant set enrichment
The VSE method provides a robust framework to cope with the heterogeneous structure of haplotype blocks, and has been designed to test enrichment in cistromes and epigenomes. In order to extend the variant set enrichment to gene loci here we applied an additional step using expression quantitative trait loci (eQTLs). The rationale of this extended approach is that the simple overlap between a given cluster of SNPs and a particular gene locus does not imply functional association with gene expression. Therefore, the VSE analysis was conditioned to a cis-eQTL validation. We assessed cis eQTLs using METABRIC data19 by applying a multivariate linear model, placing on the right hand side of the model the genotypes as predictors (representing a given cluster of risk-associated and linked SNPs that have been genotyped in METABRIC, with the assumption of additive effect), and in the left hand side the gene expression as response variable (representing a given gene set or regulon, assuming a Gaussian distribution). Cis-eQTL analysis was carried out only for genes 200 kb up- or downstream from a particular cluster. Provided that HapMap linkage disequilibrium data have been mapped for markers up to 200 kb apart, the effective cis-eQTL analysis extended up to 400 kb radius around the AVS. The overall exact P-value for the AVS, conditioned to the cis-eQTL validation, was obtained from the null distribution derived from 1,000 MRVS as described by Cowper-Sal lari et al.18 Only enrichment scores satisfying the Bonferroni-corrected threshold (P<0.001) are reported as significant. The extended step of the VSE analysis was executed in R51 (http://www.R-project.org/) using the stats package, including lm and manova functions.
In Fig. 2, the Exp1 gene list is balanced to generate comparable sized lists (also see Supplementary information).
Network inference
METABRIC breast cancer gene expression data set19 included a test (n=997), a validation (n=995) and a normal breast expression data set (n=144); the T-ALL control (n=57) was downloaded from GEO (accession number GSE33469)24 and the TCGA breast cancer gene expression data set (n=155) was downloaded from the dedicated website20 (https://tcga-data.nci.nih.gov/docs/publications/brca_2012). Each data set was analysed separately and the results from each network compared (see Fig. 3; for the source code of the network analysis see the R package Fletcher2013b).
Probes were filtered based on their coefficient of variation and MI was calculated in the R package minet52. To derive the regulatory network we re-implemented ARACNe/MRA13 in R, the source code is available in the R package RTN. The Vignette for Fletcher2013b gives additional information on the MI computation, application of the DPI15 and MRA. Follow-up analysis included clustering analysis, generation of enrichment maps, gene set enrichment analysis53 and synergy and shadow analysis33. (Also see R package Fletcher2013b and the associated Vignette.) For the network visualization we used the R package RedeR30.
Network validation
ChIP-Seq reads were aligned to genome build hg18 and filtered by removing reads either with quality less than five or overlapping ‘signal artefact’ regions54. Peaks were called using model-based analysis for ChIP-Seq55, run using default parameters. Binding events that occurred in at least two out of three biological replicates were considered.
ChIP-Seq peaks were ranked by P-value and 75 bp sequences centred on the summits of 150 peaks were selected for de novo motif analysis. DNA sequences were retrieved using the Genome Browser56 (assembly NCBI36/hg18) and motif searching was performed using the command line version of MEME 4.8.1 (ref. 57). Motifs between 9 and 15 bases were searched from both strands assuming one binding site per sequence model (mod=oops). Similar motifs were also obtained from peak summits ranked 1–1,000 and zero or one binding site per sequence model (mod=zoops).
Further detail on the statistical analysis and the source code that reproduces the statistical analysis on the ChIP-Seq data is available in the R package Fletcher2013b. This also includes the analysis of siRNA data and the analysis of the meta-PCNA signature.
Author contributions
M.N.C.F. carried out the experimental work. M.A.A.C. performed the computational analysis. X.W. and I.S. assisted in the computational analysis, M.O’R. in the experimental work. B.A.J.P. proposed the idea and obtained funding for this project. M.N.C.F., M.A.A.C., B.A.J.P., F.M. and K.B.M. designed the experiments and wrote the manuscript, F.M. and K.B.M. are co-corresponding authors. C.C. is the lead for the METABRIC study and reviewed the manuscript. S.-F.C. and O.M.R. provided the normalized METABRIC data.
Additional information
Accession codes Microarray data have been deposited in GEO under accession codes GSE48924, GSE48925, GSE48927 for FGFR2 stimulation and under accession code GSE48928 for siRNA experiments. ChIP-seq data have been deposited in GEO under accession code GSE48930. All submissions have been assigned the SuperSeries number GSE48931.
How to cite this article: Fletcher, M. N. C. et al. Master regulators of FGFR2 signalling and breast cancer risk. Nat. Commun. 4:2464 doi: 10.1038/ncomms3464 (2013).
Supplementary Material
Supplementary Figures S1-S15, Supplementary Tables S1-S6, Supplementary Methods and Supplementary References
Acknowledgments
This work was funded by Cancer Research UK and by the NIHR Cambridge Biomedical Research Centre. We thank Paul Pharoah for helpful discussions, and Jason Carroll and Christina Curtis for critically reviewing the manuscript. We also thank Hutchison Whampoa Ltd for their support of the Li Ka Shing Professorship held by B.A.J.P. for a substantial time during the course of this work.
References
- Michailidou K. et al. Large-scale genotyping identifies 41 novel breast cancer susceptibility loci. Nat. Genet. 45, 392–398 (2013). [DOI] [PMC free article] [PubMed] [Google Scholar]
- Easton D. F. et al. Genome-wide association study identifies novel breast cancer susceptibility loci. Nature 447, 1087–1093 (2007). [DOI] [PMC free article] [PubMed] [Google Scholar]
- Hunter D. J. et al. A genome-wide association study identifies alleles in FGFR2 associated with risk of sporadic postmenopausal breast cancer. Nat. Genet. 39, 870–874 (2007). [DOI] [PMC free article] [PubMed] [Google Scholar]
- Udler M. S. et al. FGFR2 variants and breast cancer risk: fine-scale mapping using African American studies and analysis of chromatin conformation. Hum. Mol. Genet. 18, 1692–1703 (2009). [DOI] [PMC free article] [PubMed] [Google Scholar]
- Garcia-Closas M. et al. Heterogeneity of breast cancer associations with five susceptibility loci by clinical and pathological characteristics. PLoS. Genet. 4, e1000054 (2008). [DOI] [PMC free article] [PubMed] [Google Scholar]
- Meyer K. B. et al. Allele-specific up-regulation of FGFR2 increases susceptibility to breast cancer. PLoS Biol. 6, e108 (2008). [DOI] [PMC free article] [PubMed] [Google Scholar]
- Riaz M. et al. Correlation of breast cancer susceptibility loci with patient characteristics, metastasis-free survival, and mRNA expression of the nearest genes. Breast Cancer Res. Treat. 133, 843–851 (2012). [DOI] [PubMed] [Google Scholar]
- Li Q. et al. Integrative eQTL-based analyses reveal the biology of breast cancer risk loci. Cell 152, 633–641 (2013). [DOI] [PMC free article] [PubMed] [Google Scholar]
- Lu P., Ewald A. J., Martin G. R. & Werb Z. Genetic mosaic analysis reveals FGF receptor 2 function in terminal end buds during mammary gland branching morphogenesis. Dev. Biol. 321, 77–87 (2008). [DOI] [PMC free article] [PubMed] [Google Scholar]
- Kim S. et al. FGFR2 promotes breast tumorigenicity through maintenance of breast tumor-initiating cells. PLoS One 8, e51671 (2013). [DOI] [PMC free article] [PubMed] [Google Scholar]
- Turner N. & Grose R. Fibroblast growth factor receptor signalling: from development to cancer. Nat. Rev. Cancer 10, 118–129 (2010). [DOI] [PubMed] [Google Scholar]
- Muller F. J. et al. Regulatory networks define phenotypic classes of human stem cell lines. Nature 455, 401–405 (2008). [DOI] [PMC free article] [PubMed] [Google Scholar]
- Carro M. S. et al. The transcriptional network for mesenchymal transformation of brain tumours. Nature 463, 318–325 (2010). [DOI] [PMC free article] [PubMed] [Google Scholar]
- Basso K. et al. Reverse engineering of regulatory networks in human B cells. Nat. Genet. 37, 382–390 (2005). [DOI] [PubMed] [Google Scholar]
- Margolin A. A. et al. Reverse engineering cellular networks. Nat. Protoc. 1, 662–671 (2006). [DOI] [PubMed] [Google Scholar]
- Zhang X. et al. Receptor specificity of the fibroblast growth factor family. The complete mammalian FGF family. J. Biol. Chem. 281, 15694–15700 (2006). [DOI] [PMC free article] [PubMed] [Google Scholar]
- Xian W., Schwertfeger K. L. & Rosen J. M. Distinct roles of fibroblast growth factor receptor 1 and 2 in regulating cell survival and epithelial-mesenchymal transition. Mol. Endocrinol. 21, 987–1000 (2007). [DOI] [PubMed] [Google Scholar]
- Cowper-Sal lari R. et al. Breast cancer risk-associated SNPs modulate the affinity of chromatin for FOXA1 and alter gene expression. Nat. Genet. 44, 1191–1198 (2012). [DOI] [PMC free article] [PubMed] [Google Scholar]
- Curtis C. et al. The genomic and transcriptomic architecture of 2,000 breast tumours reveals novel subgroups. Nature 486, 346–352 (2012). [DOI] [PMC free article] [PubMed] [Google Scholar]
- TCGA. Comprehensive molecular portraits of human breast tumours. Nature 490, 61–70 (2012). [DOI] [PMC free article] [PubMed] [Google Scholar]
- Allred D. C., Brown P. & Medina D. The origins of estrogen receptor alpha-positive and estrogen receptor alpha-negative human breast cancer. Breast Cancer Res. 6, 240–245 (2004). [DOI] [PMC free article] [PubMed] [Google Scholar]
- Kouros-Mehr H., Kim J. W., Bechis S. K. & Werb Z. GATA-3 and the regulation of the mammary luminal cell fate. Curr. Opin. Cell. Biol. 20, 164–170 (2008). [DOI] [PMC free article] [PubMed] [Google Scholar]
- Bernardo G. M. et al. FOXA1 is an essential determinant of ERα expression and mammary ductal morphogenesis. Development 137, 2045–2054 (2010). [DOI] [PMC free article] [PubMed] [Google Scholar]
- Van Vlierberghe P. et al. ETV6 mutations in early immature human T cell leukemias. J. Exp. Med. 208, 2571–2579 (2011). [DOI] [PMC free article] [PubMed] [Google Scholar]
- Venet D., Dumont J. E. & Detours V. Most random gene expression signatures are significantly associated with breast cancer outcome. PLoS. Comput. Biol. 7, e1002240 (2011). [DOI] [PMC free article] [PubMed] [Google Scholar]
- Carroll J. S. et al. Genome-wide analysis of estrogen receptor binding sites. Nat. Genet. 38, 1289–1297 (2006). [DOI] [PubMed] [Google Scholar]
- Hurtado A., Holmes K. A., Ross-Innes C. S., Schmidt D. & Carroll J. S. FOXA1 is a key determinant of estrogen receptor function and endocrine response. Nat. Genet. 43, 27–33 (2010). [DOI] [PMC free article] [PubMed] [Google Scholar]
- Theodorou V., Stark R., Menon S. & Carroll J. GATA3 acts upstream of FOXA1 in mediating ER binding by shaping enhancer accessibility. Genome Res. 23, 12–22 (2013). [DOI] [PMC free article] [PubMed] [Google Scholar]
- Wei G. H. et al. Genome-wide analysis of ETS-family DNA-binding in vitro and in vivo. EMBO J. 29, 2147–2160 (2010). [DOI] [PMC free article] [PubMed] [Google Scholar]
- Castro M. A. A., Wang X., Fletcher M. N. C., Meyer K. B. & Markowetz F. RedeR: R/Bioconductor package for representing modular structures, nested networks and multiple levels of hierarchical associations. Genome Biol. 13, R29 (2012). [DOI] [PMC free article] [PubMed] [Google Scholar]
- Wu L. et al. The E2F1-3 transcription factors are essential for cellular proliferation. Nature 414, 457–462 (2001). [DOI] [PubMed] [Google Scholar]
- Laoukili J. et al. FoxM1 is required for execution of the mitotic programme and chromosome stability. Nat. Cell Biol. 7, 126–136 (2005). [DOI] [PubMed] [Google Scholar]
- Lefebvre C. et al. A human B-cell interactome identifies MYB and FOXM1 as master regulators of proliferation in germinal centers. Mol. Syst. Biol. 6, 377 (2010). [DOI] [PMC free article] [PubMed] [Google Scholar]
- Schadt E. E. Molecular networks as sensors and drivers of common human diseases. Nature 461, 218–223 (2009). [DOI] [PubMed] [Google Scholar]
- Bernal J. A. et al. Human securin interacts with p53 and modulates p53-mediated transcriptional activity and apoptosis. Nat. Genet. 32, 306–311 (2002). [DOI] [PubMed] [Google Scholar]
- Ding L. et al. Ligand-independent activation of estrogen receptor alpha by XBP-1. Nucleic Acids Res. 31, 5266–5274 (2003). [DOI] [PMC free article] [PubMed] [Google Scholar]
- Kong S. L., Li G., Loh S. L., Sung W. K. & Liu E. T. Cellular reprogramming by the conjoint action of ERα, FOXA1, and GATA3 to a ligand-inducible growth state. Mol. Syst. Biol. 7, 526 (2011). [DOI] [PMC free article] [PubMed] [Google Scholar]
- French J. et al. Fine scale mapping and functional analysis of the breast cancer 11q13 (CCND1) locus. Am. J. Hum. Genet. 92, 1–15 (2013). [Google Scholar]
- Steffan J. J. & Koul H. K. Prostate derived ETS factor (PDEF): a putative tumor metastasis suppressor. Cancer Lett. 310, 109–117 (2011). [DOI] [PubMed] [Google Scholar]
- Turcotte S., Forget M. A., Beauseigle D., Nassif E. & Lapointe R. Prostate-derived Ets transcription factor overexpression is associated with nodal metastasis and hormone receptor positivity in invasive breast cancer. Neoplasia 9, 788–796 (2007). [DOI] [PMC free article] [PubMed] [Google Scholar]
- Sood A. K. et al. Expression characteristics of prostate-derived Ets factor support a role in breast and prostate cancer progression. Hum. Pathol. 38, 1628–1638 (2007). [DOI] [PMC free article] [PubMed] [Google Scholar]
- Feldman R. J., Sementchenko V. I., Gayed M., Fraig M. M. & Watson D. K. Pdef expression in human breast cancer is correlated with invasive potential and altered gene expression. Cancer Res. 63, 4626–4631 (2003). [PubMed] [Google Scholar]
- Oettgen P. et al. PDEF, a novel prostate epithelium-specific ets transcription factor, interacts with the androgen receptor and activates prostate-specific antigen gene expression. J. Biol. Chem. 275, 1216–1225 (2000). [DOI] [PubMed] [Google Scholar]
- Steffan J., Koul S., Meacham R. & Koul H. The transcription factor SPDEF suppresses prostate tumour metastasis. J. Biol. Chem. 287, 29968–29978 (2012). [DOI] [PMC free article] [PubMed] [Google Scholar]
- Wang K., Li M. & Hakonarson H. Analysing biological pathways in genome-wide association studies. Nat. Rev. Genet. 11, 843–854 (2010). [DOI] [PubMed] [Google Scholar]
- Schadt E. E., Friend S. H. & Shaywitz D. A. A network view of disease and compound screening. Nat. Rev. Drug. Discov. 8, 286–295 (2009). [DOI] [PubMed] [Google Scholar]
- Dunning M. J., Smith M. L., Ritchie M. E. & Tavare S. Beadarray: R classes and methods for Illumina bead-based data. Bioinformatics 23, 2183–2184 (2007). [DOI] [PubMed] [Google Scholar]
- Schmidt D. et al. ChIP-seq: using high-throughput sequencing to discover protein-DNA interactions. Methods 48, 240–248 (2009). [DOI] [PMC free article] [PubMed] [Google Scholar]
- Park Y. Y. et al. Reconstruction of nuclear receptor network reveals that NR2E3 is a novel upstream regulator of ESR1 in breast cancer. EMBO Mol. Med. 4, 52–67 (2012). [DOI] [PMC free article] [PubMed] [Google Scholar]
- Smyth G. K. Linear models and empirical bayes methods for assessing differential expression in microarray experiments. Stat. Appl. Genet. Mol. Biol. 3, Article3 (2004). [DOI] [PubMed] [Google Scholar]
- R-Core-Team. R: A Language and Environment For Statistical Computing R Foundation for Statistical Computing: Vienna, Austria, ISBN 3-900051-07-0 (2012). [Google Scholar]
- Meyer P. E., Lafitte F. & Bontempi G. Minet: A R/Bioconductor package for inferring large transcriptional networks using mutual information. BMC Bioinformat. 9, 461 (2008). [DOI] [PMC free article] [PubMed] [Google Scholar]
- Subramanian A. et al. Gene set enrichment analysis: a knowledge-based approach for interpreting genome-wide expression profiles. Proc. Natl Acad. Sci. USA 102, 15545–15550 (2005). [DOI] [PMC free article] [PubMed] [Google Scholar]
- Weinstock G. M. ENCODE: more genomic empowerment. Genome Res. 17, 667–668 (2007). [DOI] [PubMed] [Google Scholar]
- Zhang Y. et al. Model-based analysis of ChIP-Seq (MACS). Genome Biol. 9, R137 (2008). [DOI] [PMC free article] [PubMed] [Google Scholar]
- Karolchik D. et al. The UCSC Table Browser data retrieval tool. Nucleic Acids Res. 32, D493–D496 (2004). [DOI] [PMC free article] [PubMed] [Google Scholar]
- Bailey T. L. et al. MEME SUITE: tools for motif discovery and searching. Nucleic Acids Res. 37, W202–W208 (2009). [DOI] [PMC free article] [PubMed] [Google Scholar]
Associated Data
This section collects any data citations, data availability statements, or supplementary materials included in this article.
Supplementary Materials
Supplementary Figures S1-S15, Supplementary Tables S1-S6, Supplementary Methods and Supplementary References


