Abstract
In low temperature aqueous solutions, it has long been recognized by in situ experiments that many minerals are preceded by crystalline nanometre-sized particles and non-crystalline nanophases. For magmatic systems, nanometre-sized precursors have not yet been demonstrated to exist, although the suggestion has been around for some time. Here we demonstrate by high temperature quench experiments that platinum and arsenic self-organize to nanoparticles, well before the melt has reached a Pt–As concentration at which discrete Pt arsenide minerals become stable phases. If all highly siderophile elements associate to nanophases in undersaturated melts, the distribution of the noble metals between silicate, sulphide and metal melts will be controlled by the surface properties of nano-associations, more so than by the chemical properties of the elements.
 It has long been suggested, but never shown, that nanometre-sized particles precede mineral formation in magmatic systems. Here, Helmy et al. demonstrate that platinum and arsenic self-organize to nanoparticle precursors in magmatic liquids before mineral crystallization.
Classic nucleation theory predicts that a stable nucleus will form when a solution is supersaturated in its components, that is, when the growth of a nucleus may lower the Gibbs free energy of the system1. Recently, it has become apparent that this simple model may need some revision2,3,4. Before solutions become saturated in stable minerals, some self-organization occurs among cationic and anionic species to form a range of molecular associations, non-crystalline polymolecular clusters and crystalline nanoparticles5,6,7,8. With respect to composition and short range order, these nano-associations can be similar to the stable mineral nuclei6, although with respect to physical and chemical properties they differ greatly from their macroscopic counterparts4,9.
So far, prenucleation clustering has only been demonstrated for mineral species that crystallize from aqueous solutions. For melts at magmatic temperatures, direct evidence for self-organization is still missing. There is indirect chemical evidence from solubility experiments that some form of preferential cation–anion associations must exist in silicate melts10,11,12, and natural minerals are reported to contain inclusions of nanophases13. Wirth et al.14 demonstrate by high resolution transmission electron microscopy (HRTEM) that pyrrhotite (Fe1−xS) and pentlandite ((Ni,Fe)9S8) of the Merensky reef indeed carry noble metal-rich nanophase inclusions, as small in size as 30 nm. However, interpreting these nanophases as magmatic precursors to discrete noble metal minerals has an element of ambiguity: the base metal sulphides carrying the inclusions are all subsolidus minerals that formed below 400 °C 15, and all sulphides were subsequently reset in composition and structure to closure temperatures of 100–150 °C 16.
In this Article we show, by high temperature quench experiment, that nano-associations indeed exist in magmatic systems. We dope Fe–S and Fe–Cu–S melts with traces of Pt and As and equilibrate these compositions between 950 and 1,180 °C (see Methods). Even though the experimental melts are highly undersaturated with respect to discrete Pt–As minerals, HRTEM imaging of the quenched run products reveals a wide range of Pt–As nano-associations, including poorly ordered (Pt,As)n clusters, crystalline PtAs2 nanoparticle platelets and, at very high temperature, nanometre-sized droplets of a Pt-enriched arsenide melt. Obviously, magmatic liquids are not fundamentally different from aqueous solutions where nanophase precursors to stable minerals seem to be commonplace. We confirm a suggestion by Tredoux et al.17 that the highly siderophile elements (HSE) tend to self-organize to poly-atomic clusters and nanoparticles, rather than being dissolved in magmatic liquids as individual atoms or cationic species.
Results
Phase relations and compositions
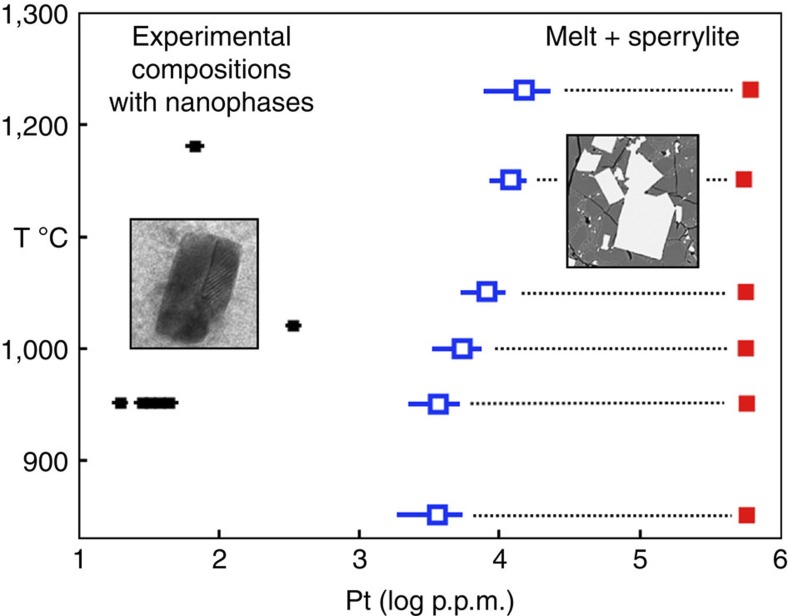
Run products of the equilibration experiments are quenched Fe–(Cu)–S sulphide melt, monosulphide (Fe1−xS) crystals, and in Pt–arsenide-saturated melt compositions the magmatic Pt–arsenide mineral sperrylite (PtAs2). Phase relations and phase compositions with respect to Pt contents are shown in Fig. 1. All phases are analysed for major and trace elements with electron microprobe and Laser-ablation mass spectrometry (Table 1 and Methods).
Figure 1. Phase relations.
Phase diagram of the platinum–arsenic-bearing Fe-(Cu)-S systems determined at an S2 partial pressure corresponding to the Fe1−xS–S2 liquid–vapour equilibrium20. Blue symbols—compositions of sperrylite-saturated Fe-(Cu)-S melts (~5,000–6,000 p.p.m. Pt). Red symbols—sperrylite compositions. Small black symbols—sperrylite-undersaturated melts analysed for Pt–As distribution and/or FIB sectioned in search of Pt–As nanophases and nanoparticles. The insets illustrate the compositional regions where macroscopic sperrylite (euhedral, bright) is stable and where (Pt–As)n nanophases are found. Error bars are 2 sigma of the mean.
Table 1. Phase compositions.
| Run number | AsPt01 | AsPt11 | AsPt21 | AsPt31 | AsPt51 | Pt300As | Pt50As |
|---|---|---|---|---|---|---|---|
| Starting composition | Fe–Cu–S | Fe–Cu–S | Fe–Cu–S | Fe–Cu–S | Fe–Cu–S | Fe–Cu–S | Fe–S |
| Pt (p.p.m.) | 20 | 20 | 20 | 20 | 20 | 300 | 60 |
| As (p.p.m.) | 0 | 8 | 16 | 24 | 40 | 230 | 100 |
| Run temperature (°C) | 950 | 950 | 950 | 950 | 950 | 1,020 | 1,180 |
| Run time (h) | 48 | 48 | 48 | 48 | 48 | 48 | 15 min |
| Phases at run conditions | mss, L | mss, L | mss, L | mss, L | mss, L | mss, L | mss, L |
| Monosulphide | n=7 | n=6 | n=7 | n=6 | n=8 | n=5 | n=5 |
| Fe (wt.%) | 58.6±0.4 | 58.2±0.2 | 61.1±0.6 | 61.8±0.4 | 61.9±0.4 | 58.4±0.6 | 63.1±0.3 |
| Cu (wt.%) | 5.1±0.5 | 6.1±0.1 | 2.9±0.5 | 2.2±0.2 | 2.3±0.1 | 5.4±0.1 | — |
| Pt (p.p.m.) | 2.1±0.2 | 0.8±0.1 | 0.16±0.1 | 0.11±0.04 | 0.11±0.04 | 22±0.5 | 1.6±0.3 |
| As (p.p.m.) | — | 2.1±0.2 | 5.7±0.4 | 6.4±0.6 | 15.9±1 | 9±0.7 | 20.5±1.5 |
| S (wt.%) | 36.6±0.3 | 36.6±0.2 | 36.6±0.2 | 36.7±0.1 | 36.7±0.1 | 37.3±0.5 | 36.4±0.2 |
| Atomic metal/S | 0.99±0.01 | 0.995±0.01 | 1±0.006 | 1±0.01 | 1±0.01 | 0.97±0.03 | 1 |
| Sulphide melt | n=6 | n=8 | n=7 | n=8 | n=8 | n=5 | n=15 |
| Fe (wt.%) | 40.3±5.9 | 37±2.8 | 41.6±4.4 | 34.5±5.9 | 43.8±6.8 | 38.5±1.3 | 62.2±0.2 |
| Cu (wt.%) | 28.7±7 | 32.1±3.7 | 27.1±5.7 | 34.6±5.4 | 24.2±7.5 | 30.2±1.6 | — |
| Pt (p.p.m.) | 44±2.4 | 38±1 | 31±2 | 20±2 | 35±3 | 342±32 | 67±6 |
| As (p.p.m.) | — | 13±3 | 20±2 | 23±1 | 68±3 | 369±35 | 122±5 |
| S (wt.%) | 31±2.5 | 30.9±0.4 | 31.9±0.8 | 31.2±3.3 | 31.3±1.2 | 32.2±0.2 | 37.2±0.2 |
| Atomic metal/S | 1.21±0.12 | 1.21±0.02 | 1.18±0.04 | 1.2±0.13 | 1.19±0.05 | 1.16±0.05 | 0.96±0.02 |
| DPt (mss/melt) | 0.048±0.003 | 0.021±0.002 | 0.005±0.001 | 0.005±0.001 | 0.003±0.001 | — | — |
| Δlog pS2 (iron–troilite) | 1.5±0.2 | 0.6±0.1 | 0.1±0.6 | 0.5±0.3 | 0±0.4 | 3±0.2 | 0.8±0.4 |
Major elements Fe, Cu, and S analysed with electron microprobe analysis, Pt and As analysed with laser ablation inductively coupled plasma mass spectrometry. Averages of n analyses, the ranges are 2 sigma of the mean. ΔpS2 is the logarithmic partial pressure of sulphur of the gas phase coexisting with sulphide liquid, given relative to the Fe–FeS equilibrium37.
Influence of arsenic on Pt partitioning
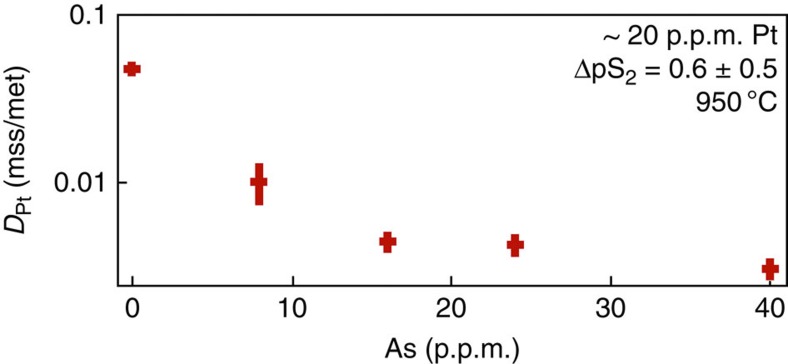
Laser-ablation analysis of coexisting monosulphide–melt pairs of the 950 °C runs shows that the presence of As greatly influences the distribution of Pt (Fig. 2). When Asn− is added to the sulphide, the distribution coefficients of Pt between monosulphide crystals and sulphide melt (DPtmss/melt) fall drastically relative to the DPtmss/melt determined in the As-free sulphide system, from 0.05 to ~0.003. The preferred explanation is that when arsenic is present, the Ptn+ cationic species associates with the Asn− anionic species to form Pt–As molecular associations or polymolecular (Pt–As)n clusters, and in that associated form faces difficulty substituting into the metal sublattice of monosulphide (Fe1−xS) phases. From the DPtmss/melt of the most As-enriched monosulphide–melt pair (40 p.p.m. As), we calculate that more than 90% of the Ptn+ in solution in the melt must be associated with Asn−.
Figure 2. Distribution coefficients.
The partitioning of Pt between monosulphide (Fe1-xS) and As-bearing Fe–Cu–S melt at 950 °C. The Pt content in all bulk compositions is around 20 p.p.m., whereas the Pt:As atomic ratio ranges from infinity to 0.2 (at 40 p.p.m. As). The sulphur partial pressure at run conditions is quoted in log-bar units relative to the iron–troilite (Fe–FeS) equilibrium19,37 as ΔpS2, at which most of the As is present as the Asn− anionic species34. Error bars are 2 sigma of the mean.
Nanoparticles and nanophases
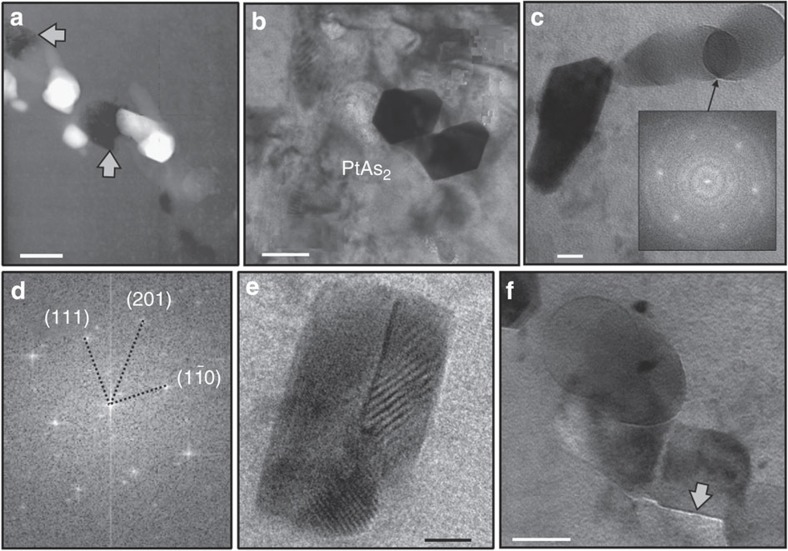
Following this observation, several monosulphide grains were sectioned with focused ion beam (FIB) techniques to 150 nm thin platelets, then examined by HRTEM18. These experiments contained 300 and 60 p.p.m. Pt (atomic Pt/As=0.2) and were undersaturated relative to sperrylite (PtAs2) by factors of 20 and 100. Nano-associations of Pt and As were indeed found. One FIB section through a monosulphide crystal intersected PtAs2 nanoparticles ranging in size from ~5 to 50 nm (Fig. 3a–c). The nanoparticles tend to be either aligned like pearls on a string and/or clumped to small particle aggregates, and they occur in intimate association with negative crystal-shaped fluid inclusions rich in chloride. Note that Pt and As were added to the starting mixes in the form of chloride and nitride solutions (see Methods), so chloride is an impurity in all bulk sulphide charges and is occasionally trapped along with sulphur vapour by monosulphide as inclusions.
Figure 3. Nanophases and nanoparticles.
Nano-sized particles in equilibrium monosulphide from run # Pt300As at 1,020 °C. (a) A trail of euhedral PtAs2 nanoparticles together with chloride-rich fluid inclusions (arrows); scale bar, 100 nm. (b,c) Bright field images of euhedral PtAs2 nanoparticles and rounded Pt–As clusters; the fast Fourier Transform (FFT) inset in (c) is from the overlap and returned the diffraction pattern of the FeS host crystal (P63/mmc), suggesting that the rounded phases are non-crystalline; scale bars, 50 and 20 nm. (d) The FFT image from the euhedral PtAs2 phase in (c) is consistent with the Pa3 space group of cubic PtAs2. (e) HRTEM image of several overlapping crystalline PtAs2 platelets; note the Moiré patterns indicating their crystallinity; scale bar, 10 nm. (f) PtAs2 nanoplatelet 'edge on' marked by an arrow; measured thickness is ~5 unit cells; scale bar, 50 nm.
The euhedral PtAs2 nanoparticles are found to be crystalline (space group Pa3; Fig. 3d) showing Moiré patterns with the enclosing monosulphide (Fig. 3e). Where nanoparticles are intersected ‘edge on’ (Fig. 3f), thicknesses are measured that range ~1–2 nm or ~5 unit cells, identifying them as ultra-thin six-sided nanoplatelets. Energy-dispersive analyses in transmission electron microscopy (TEM) scanning mode display Pt and As as major elements (see Methods), and the lattice parameters derived from fast Fourier Transform diffraction patterns calculated from high resolution images correspond to those of sperrylite PtAs2. No preferred orientation is noted relative to the hexagonal (P63/mmc) lattice of the monosulphide host.
In close spatial association with the PtAs2 nanoparticle platelets, rounded phases are identified (Fig. 3f). The very low absorption contrasts in TEM imaging suggests that they must be extremely thin, probably even thinner than the euhedral nanoparticle platelets. Chemical microanalysis proved difficult but Pt and As are detectable. No Moiré patterns are noted where the rounded phases overlap with each other or with the FeS lattice (Fig. 3c), suggesting that they may be non-crystalline. Several explanations seem possible. They may be clusters of Pt–As molecules devoid of a long-range order. Alternatively, they may be remnants of formerly crystalline PtAs2 nanoparticle platelets in a state of partial dissolution. Perhaps the close coexistence of euhedral and rounded (Pt–As)n associations points to a dynamic oscillation between PtAs2 nanoplatelets nucleating and re-dissolving at the same time on a small scale, trapped and isolated from the sulphide melt by rapid monosulphide overgrowth.
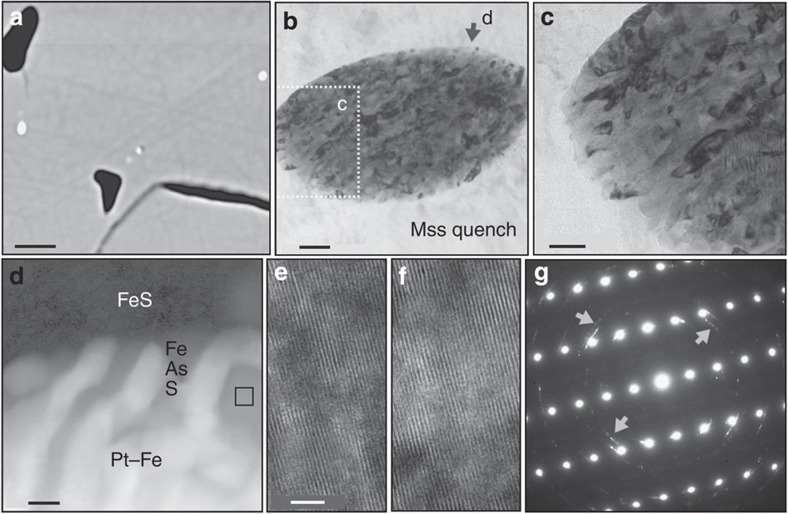
One experiment at 1,180 °C just inside the three-phase (monosulphide—sulphide liquid—S2 gas) field of the Fe–S system 19,20 returned, after quenching, Pt–As associations in the form of nanometre-sized As-enriched melt globules. These nanodroplets are found trapped in both equilibrium and quench monosulphide (Fig. 4a). This run was undersaturated in Pt relative to sperrylite saturation by about a factor of 100. Nonetheless, at run conditions, nanometre-sized Pt–As-enriched melt globules coexist stably with crystalline equilibrium monosulphide and FeS melt (Fig. 4b). On quenching, the globules crystallize to Pt–Fe and PtAs2 nano-crystallites set in a matrix of Fe(As,S), that is, arsenide-enriched quench monosulphide (Fig. 4c,d). The Fe(As,S) matrix of the globules is in crystallographic continuity with the As-free monosulphide crystal hosting the inclusion (Fig. 4e,f), whereas the Pt-rich crystallites inside the globule are polycrystalline and unoriented relative to the Fe(As,S) matrix, as evidenced by the Debye–Scherrer rings in the diffraction pattern in Fig. 4g. Energy-dispersive analyses of the FeS inside and the FeS outside the globule reveal that the globule–matrix interface is defined by a sharp (~10 nm) gradient in As content: high in the globule, whereas below detection in the matrix FeS.
Figure 4. Nanodroplets.
Platinum–arsenic-enriched globules in equilibrium monosulphide from run Pt50As, quenched from 1,180 °C. (a) A back scattered electron (BSE) image of a polished surface intersecting five bright nano-sized Pt–As-rich globules in monosulphide; the dark cavities are filled at run conditions with S2 vapour; scale bar, 5 μm. (b) Bright field (BF) image of a 900 by 500 nm-sized globule, with dark Pt-rich quench phases aligned in an As-bearing FeS matrix; scale bar, 100 nm. (c) BF image of the lower left of the globule in more detail; scale bar, 50 nm. (d) Absorption contrasts at the globule–matrix contact (position marked with an arrow in Fig. 3b); bright subhedral Pt–Fe-rich quench phases (Pt–Fe and PtAs2) in a grey matrix of As-bearing FeS. Note the sharp contact between As-bearing FeS globule–matrix and As-free FeS outside the globule, window analysed in TEM scanning mode for composition marked by square; scale bar, 20 nm. (e,f) HRTEM images of the As-bearing FeS matrix inside the globule (d) and the monosulphide hosting the globule (e); both lattices are in structural continuity; scale bar, 5 nm. (g) Diffraction pattern of the Pt–As-bearing globule in (b); the As-bearing FeS matrix inside the globule is in structural continuity with the FeS surrounding the globule; the Debye–Scherrer rings (arrows) are from polycrystalline Pt-rich quench phases.
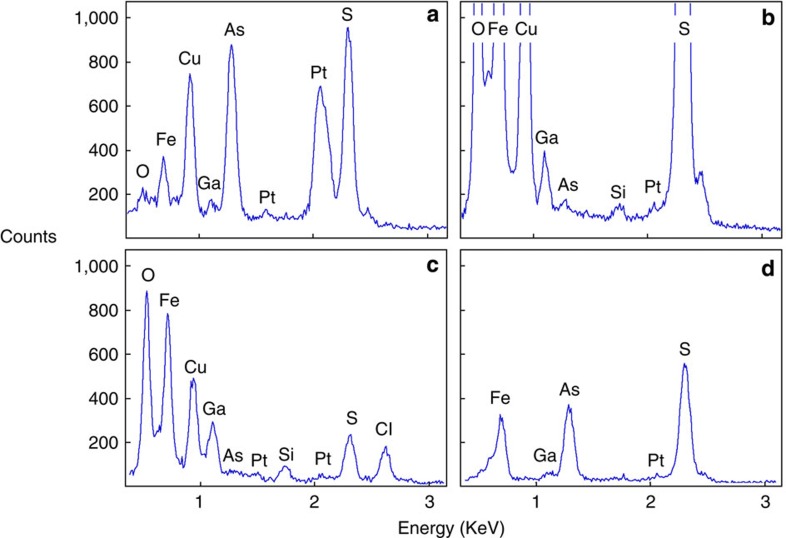
Chemical compositions of the individual nanophases are measured with an X-ray analyser equipped with a Li-doped silicon detector (Fig. 5). Analyses are performed either in the scanning transmission mode, that is, by scanning the electron beam within a preselected window, or in spot mode with spot sizes ~1 nm in diameter. These spot sizes are possible because sulphide and arsenide minerals are not sensitive to mass loss during exposure to the beam. All nanophases analysed contain substantial Pt and As, well above the background of these elements in the host sulphides.
Figure 5. Phase compositions.
Energy-dispersive spectra of selected nanophases and matrix sulphides illustrated in Figs. 3 and 4. For analytical conditions refer to the Methods section. (a) An element spectrum of the euhedral PtAs2 nanoparticle in Fig. 3c. (b) A spectrum of a non-crystalline Pt–As nanophase, Fig. 3c. (c) A spectrum of a fluid inclusion cavity shown in Fig. 3a. (d) A spectrum of the Fe(As,S) matrix of the nanoglobule in Fig. 4d, in close contact with the matrix FeS; area scanned to derive the spectrum is marked in Fig. 3d by a square. Gallium is a contaminant derived from deposits of the Ga beam, and the Cu signal present in most spectra is derived from the copper grid carrying the FIB section. The Si signal is probably derived from silica condensates, deposited in the sulphide products during quenching. Limits above which an element can be detected on a three sigma confidence level are around 700 p.p.m.14
Discussion
Our study shows that the HSE may form nano-associations in magmatic melts, well before high-enough noble metal concentrations are reached that stable nuclei of discrete noble metal minerals can form. In the FeS melts, most undersaturated with respect to macroscopic Pt–As–S phases, the simplest association may be in the form of binary Pt–As molecules, indirectly borne out of the As effect on DPtmss–melt in Fig. 2. At higher Pt concentration, more polymerized units appear, including non-crystalline (Pt–As)n polymolecular clusters, crystalline PtAs2 nanoplatelets, and at very high temperature (1,180 °C) immiscible Pt–As-rich melt globules. It is important to note that all these nano-associations of Pt and As are stable in melts highly undersaturated with respect to the crystalline macroscopic phase sperrylite (PtAs2), in the case of the 1,180 °C FeS experiment (Fig. 4) undersaturated by a factor of ~100. Equally important is to emphasize that the nanophases probably have chemical properties not shared by their bulk equivalents (for example, macroscopic PtAs2 or PtAsS) or by their cationic and anionic equivalents in solution3.
Before we discuss the consequences of HSE prenucleation clustering for the chemical behaviour of the HSE in high-temperature magmatic systems, an argument must be made that the nano-associations imaged here were indeed stable at run conditions. This is an important issue: unlike silicate liquids, sulphide melts can never be frozen to glass but always quench by shedding metastable crystalline sulphide phases that may obscure the equilibrium phase relations21,22,23.
For the crystalline nanoparticles in Fig. 3a quench origin can be ruled out. First, the equilibrium monosulphide hosting the PtAs2 nanoparticles contains 15 p.p.m. Pt and 9 p.p.m. As, rather low to have exsolved PtAs2 phases in such numbers in so localized volumes of monosulphide, within the short time interval it takes to quench the sulphides from run conditions to room temperature. Second, no preferred orientation is noted between the PtAs2 nanoparticles and the lattices of the monosulphide host crystals; this would be intuitive if the former were solid-state quench exsolutions from the latter. Third and most importantly, the PtAs2 nanoparticles are next neighbours to primary chloride-rich fluid inclusions trapped during monosulphide growth. Such compositions could not have exsolved from crystalline monosulphide but are indicative of magmatic trapping before the run was quenched. These nanoparticles probably formed within a boundary layer24 at a monosulphide–melt interface, enriched in all solute (Cl, Pt, As) that was rejected by the monosulphide lattice.
The nano-associations in the form of Pt–As-rich globules in Fig. 4 are more ambiguous to interpret although most observations favour their stable existence at run temperature. First, the bulk FeS only contained 60 p.p.m. Pt, so no reason seems evident why a sulphide melt so low in Pt should have exsolved immiscible Pt–As-rich melt globules during quenching when the saturation concentration with stable PtAs2 nuclei at 1,180 °C is at ~6,000 p.p.m. Pt (Fig. 1). Second, the interval between run temperature (1,180 °C) and solidus temperature19,20, that is, the temperature where the FeS composition is fully crystalline (1,150 °C), was bridged during drop-quench within a few tens of seconds. If globule exsolution, crystallization of the host monosulphides and globule crystallization had all occurred simultaneously within that narrow quench interval of ~30 °C, one would be hard pressed to envision globule–matrix interfaces as sharp and as organized as in Fig. 4g. Third, these globules are found included in equilibrium monosulphide crystals, that is within crystals that were coexistent at run temperature. This is atypical for a quench phase. Normally, trace elements incompatible with crystalline phases are sequestered into later-stage derivative melts and are then found as quench products in the quenched sulphide melt. Even if we were to consider the unlikely case that the globules were quench: a high degree of self-organization must have existed between the Ptn+ and Asn− at magmatic temperature to organize Pt and As into physically separate nanophases, within the few tens of seconds it took to quench the runs from 1,180 °C to below the solidus (1,150 °C) of the FeS system.
Similar to minerals crystallizing from aqueous solutions, magmatic minerals may nucleate by using preexisting nanophases and nanoparticles as building blocks. Although this is only demonstrated for the element combination Pt–As and only in sulphide melts, no a priori reason is evident why the same principle should not also hold for all other noble metals in sulphide and metal melts, as well as for trace minerals crystallizing from silicate melts. In magmatic sulphide deposits, the platinum-group elements (PGE) are to a large extent organized as discrete arsenide, antimonide, bismutho–telluride and stannide minerals24,25,26,27,28,29, although theoretically all noble elements could be accommodated by the lattices of the coexisting base metal sulphides. For us this does not come as a surprise: these mineral compositions reflect the preferred metal–ligand nano-associations in which the PGE occur in magmatic sulphide melts, present well before discrete (micron-sized) PGE minerals become stable.
A continuum of nano-associations seems to exist in magmatic liquids, with compositions and short-range orders closely resembling the compositions and structures of the stable mineral nucleus. Statistically, it is easier for a trace mineral to crystallize and grow if it can build on preexisting nano-associations, than by assembling cationic and anionic species randomly distributed in the melt. Our results have far-reaching consequences for global HSE geochemistry30,31,32. If in the presence of As, Sb, Te and Bi, the HSE are present in melts in associated form, their distribution between silicate, sulphide and metal melts should not be modelled with partition coefficients derived from simple (As–Sb–Te–Bi-free) silicate–sulphide–metal experiments. In natural and chemically more complex systems the noble metals are associated, and their partitioning between the phases is then governed by the surface properties and surface charges of the nano-associations rather than by the chemical properties of the elements17.
Methods
Experimental details
Experiments are performed in the Pt–As-bearing Fe–S system at 1,180–1,280 °C and in the Fe–Cu–S system below 1,020 °C. Starting compositions (in wt.%) are 62.5 Fe and 37.5 S for the Fe–S system (60 p.p.m. Pt, 100 p.p.m. As) and 47.4 Fe, 17.2 Cu and 35.4 S (20–300 p.p.m. Pt, 0–230 p.p.m. As) for Fe–Cu–S. The mixtures are prepared by first adding Pt and As, as chloride and/or nitric acid solutions, to the elemental sulphur fractions of each composition. After drying at 60 °C overnight and evaporating the carrier solutions, the base metals Fe and Cu are added to the sulphur as metal powders. The mixes are ground thoroughly in an agate mortar, placed inside 6-mm outer diameter SiO2 glass tubes, welded shut at ~1 Pa, then prereacted by stepwise heating to 700 °C to form homogeneous sulphide phases33. The bulk metal/(S+As) atomic ratios are high enough to ensure that most of the As is present as anionic species (Asn−), ready to associate with the Ptn+ cationic species34.
After regrinding the prereacted sulphide, 250 mg aliquots are welded in evacuated SiO2 glass tubes and then reacted at the designated run temperature until equilibrium is reached. To scavenge O2 from the system, each charge contains a few milligrams of metallic Al, separated from the sulphide charge proper by a small, gas-permeable SiO2 wool plug. Quenching occurs by dropping the tubes in cold water. Phases present at run conditions are Fe–S or Fe–Cu–S sulphide melt, crystalline Fe1−xS monosulphides below 1,150 °C (for the Cu-bearing compositions below 1,050 °C) and crystalline sperrylite when the Pt content in the melt exceeds the saturation concentration of PtAs2 (~5,000–6,000 p.p.m. Pt; Fig. 1). Experimental conditions and phase compositions are listed in Table 1.
To trap nano-associations unmodified by quenching, the interval between run temperature and solidus temperature should be kept to a minimum. The Fe–S experiment at 1,180 °C is at the liquid/vapour univariant curve of FeS melt coexisting with S2 gas20. The interval between run temperature and complete solidification at the solidus is estimated to be ~30 °C. By quenching in cold water, that interval is overcome within a few tens of seconds. Experimental runs performed below 1,050 °C contain 17 wt.% Cu2S component in addition to FeS, and are quenched to solid phases within about 100 °C. The role of Cu is to widen the three-phase (monosulphide–liquid–vapour) stability field and extend the solidus of sulphide liquid to a lower temperature, allowing the study of the temperature region where crystalline nanoparticles are most likely to be stable.
Elemental analysis
Phases are analysed for major elements by electron microprobe analysis. Standards used are natural Canyon Diablo troilite, a Ga arsenide and metallic Pt and Cu. Platinum and As are analysed by laser-ablation inductively coupled plasma mass spectrometry using a Resonetics M50-E 193 nm ATL Excimer laser system coupled to a Finnigan X-series 2 quadrupole35. Isotopes monitored are 33S, 57Fe, 63Cu, 65Cu, 75As, 195Pt and 196Pt. Count rates are normalized to 57Fe and the Fe content of the phase, as analysed by electron microprobe analysis. Platinum is quantified using the PGE_Ni7b sulphide reference material36 and As is quantified on NIST610. The spot size for all laser-ablation analyses is 50–75 μm depending on the coarseness of the quench textures. The laser repetition rate is 5 Hz and the laser fluence is measured at ca. 6 J cm−2. No significant molecular or isobaric interferences are noted.
Transmission electron microscopy
Electron transparent membranes for TEM investigations are prepared using FIB sample preparation techniques. The FIB is a site-specific technique that allows the preparation of a TEM foil from the location of interest. The sputtering process is performed with Ga ions accelerated to 30 keV. The dimensions of the membranes prepared are 15 × 10 × 0.150 μm. Cutting thinner sections may be desirable but is impractical, as experimental sulphide materials quenched from magmatic temperature are intensely fractured and highly friable. For details of the FIB sample preparation technique see Wirth et al14.
The TEM investigations are carried out utilizing a FEI F20 X-Twin transmission electron microscope with a Schottky field emitter as the electron source. The TEM is equipped with a Gatan Tridiem imaging filter, a Fishione high-angle annular dark-field detector allowing for Z-contrast sensitive imaging, and an EDAX X-ray analyzer with an ultra-thin window. Bright field, dark field, and HRTEM images are acquired as energy-filtered images applying a 20-eV window to the zero-loss peak of the electron energy loss spectrum. Structural data are deduced from fast Fourier transforms calculated from HRTEM images and/or from convergent beam electron diffraction patterns. Single crystal diffraction patterns from HRTEM images are compared with the calculated diffraction pattern (cell parameters from the literature), measuring the length of the imaging vectors and the angles between imaging vectors as crucial criteria for phase identification.
Author contributions
H.M.H., C.B. and M.T. conceived the study. H.M.H., R.O.C.F. and C.B. designed the experimental setup and performed the experiments. R.O.C.F. and T.N. determined major and trace element compositions of experimental phases. R.W. performed the HRTEM analyses and identified the nanophases. All authors were involved in interpreting the results. H.M.H. and C.B. wrote the paper.
Additional information
How to cite this article: Helmy, H. M. et al. Noble metal nanoclusters and nanoparticles precede mineral formation in magmatic sulphide melts. Nat. Commun. 4:2405 doi: 10.1038/ncomms3405 (2013).
Acknowledgments
We thank the Alexander von Humboldt Foundation (grant to H.M.H.) and the German Research Council DFG (grant to C.B.) for financial support. Thanks are extended to Anja Schreiber for preparing the FIB sections and to Nils Jung for the preparation of polished sections of run products. The comments by two anonymous reviewers greatly improved the paper.
References
- Teng H. How ions and molecules organize to form crystals. Elements 9, 189–194 (2013). [Google Scholar]
- Navrotsky A. Energetic clues to pathways to biomineralization: precursors, clusters, and nanoparticles. Proc. Natl Acad. Sci 101, 12096–12101 (2004). [DOI] [PMC free article] [PubMed] [Google Scholar]
- Hochella M. F. Jr., Lower S. K. & Maurice P. A. et al. Nanominerals, mineral nanoparticles, and earth systems. Science 319, 1631–1635 (2008). [DOI] [PubMed] [Google Scholar]
- Banfield J. F., Welch S. A., Zhang H., Ebert T. T. & Penn R. L. Aggregation-based crystal growth and microstructure development in natural iron oxyhydroxide biomineralization products. Science 289, 751–754. [DOI] [PubMed] [Google Scholar]
- Gebauer D., Völkel A. & Cölfen H. Stable prenucleation calcium carbonate clusters. Science 322, 1819–1822 (2008). [DOI] [PubMed] [Google Scholar]
- Burns P. C. Nanoscale uranium-based cage clusters inspired by uranium mineralogy. Mineral. Mag. 75, 1–25 (2011). [Google Scholar]
- Burns P. C., Grice J. D. & Hawthorne F. C. Borate minerals. I. Polyhedral clusters and fundamental building units. Can. Mineral. 33, 1131–1151 (1995). [Google Scholar]
- Van Driessche A. E. S. et al. The role and implications of bassanite as a stable precursor phase to gypsum precipitation. Science 336, 69–72 (2012). [DOI] [PubMed] [Google Scholar]
- Auffan M. et al. Towards a definition of inorganic nanoparticles from an environmental, health and safety perspective. Nature Nanotech. 4, 634–641 (2009). [DOI] [PubMed] [Google Scholar]
- O’Neill H. St. C. & Eggins S. M. The effects of melt composition on trace element partitioning: an experimental investigation of the activity coefficients of FeO, NiO, CoO, MoO2 and MoO3 in silicate melts. Chem. Geol. 186, 151–181 (2002). [Google Scholar]
- O’Neill H. St. C, Berry A. J. & Eggins S. M. The solubility and oxidation state of tungsten in silicate melts: implications for the comparative chemistry of W and Mo in planetary differentiation processes. Chem. Geol. 255, 346–359 (2008). [Google Scholar]
- Laurenz V. et al. The solubility of palladium and ruthenium in picritic melts: 2. Geochim. Cosmochim. Acta 108, 172–183 (2013). [Google Scholar]
- Ballhaus C. & Sylvester P. Noble metal enrichment process in the Merensky Reef, Bushveld Complex. J. Petrol. 41, 545–561 (2000). [Google Scholar]
- Wirth R., Reid D. & Schreiber A. Nanometer-sized platinum-group minerals (PGM) in base metal sulfides: new evidence for an orthomagmatic origin of the Merensky reef PGE ore deposit, Bushveld Complex. South Africa. Can. Mineral. 51, 143–155 (2013). [Google Scholar]
- Misra K. & Fleet M. E. The chemical compositions of synthetic and natural pentlandite assemblages. Econ. Geol. 68, 518–539 (1973). [Google Scholar]
- Ballhaus C. & Ulmer P. Platinum-group elements in the Merensky Reef: II. Experimental solubilties of platinum and palladium in Fe1−xS from 950–450 °C under controlled fS2 and fH2. Geochim. Cosmochim. Acta 59, 4881–4888 (1995). [Google Scholar]
- Tredoux M., Lindsay M. N., Davies G. & McDonald I. The fractionation of platinum-group elements in magmatic systems, with the suggestion of a novel causal mechanism. S. Afr. J. Geol. 98, 157–167 (1995). [Google Scholar]
- Wirth R. Focused Ion Beam (FIB) combined with SEM and TEM: advanced analytical tools for studies of chemical composition, micro-structure and crystal structure in geomaterials on a nanometer scale. Chem. Geol. 261, 217–229 (2009). [Google Scholar]
- Toulmin P. Jr. & Barton P. N. A thermodynamic study of pyrite and pyrrhotite. Geochim. Cosmochim. Acta 28, 641–671 (1964). [Google Scholar]
- Waldner P. & Pelton A. D. Thermodynamic modelling of the Fe-S system. J. Phase Equilib. Diff. 26, 23–38 (2005). [Google Scholar]
- Ballhaus C., Tredoux M. & Späth A. Phase relations in the Fe-Ni-Cu-PGE-S system at magmatic temperature and application to the massive sulfide ores of the Sudbury Igneous Complex. J. Petrol. 42, 1911–1926 (2001). [Google Scholar]
- Kress V. Thermochemistry of sulfide liquids I. The system O-S-Fe at one bar. Contrib. Mineral. Petrol. 127, 76–86 (1997). [Google Scholar]
- Brenan J. M., Haider N. & Andrews D. Experimental evaluation of liquid immiscibility in a portion of the system Fe-Ni-Cu-S using high gravitational acceleration. Econ. Geol. 103, 1563–1570 (2008). [Google Scholar]
- Jamtveit B., Wogelius R. A. & Fraser D. G. Zonation patterns of skarn garnets: records of hydrothermal system evolution. Geology 21, 113–116 (1993). [Google Scholar]
- Holwell D. A. & McDonald I. Partitioning of platinum-group elements in the Platreef at Overysel, northern Bushveld Complex: a combined PGM and LA ICP-MS study. Contrib. Mineral. Petrol. 154, 171–190 (2007). [Google Scholar]
- Lorand J. P., Alard O. & Luguet A. Platinum-group element micronuggets and refertilization process in Lherz orogenic peridotite (northeastern Pyrenees, France). Earth Planet. Sci. Lett. 289, 298–310 (2010). [Google Scholar]
- Rose D., Viljoen F., Knoper M. & Rajesh H. Detailed assessment of platinum-group minerals associated with chromite stringers in the Merensky reef of the eastern Bushveld Complex, South Africa. Can. Mineral. 49, 1385–1396 (2011). [Google Scholar]
- Vermaak F. & Hendriks L. P. A review of the mineralogy of the Merensky Reef with specific reference to new data on the precious metal mineralogy. Econ. Geol. 71, 1244–1269 (1976). [Google Scholar]
- Kinloch E. D. & Peyerl W. Platinum-group minerals in various rock types of the Merensky Reef: genetic implications. Econ. Geol. 85, 537–555 (1990). [Google Scholar]
- Wänke H. Constitution of terrestrial planets. Phil. Trans. R. Soc. Lond. A 303, 287–302 (1981). [Google Scholar]
- Chou C. L. Fractionation of siderophile elements in the Earth’s upper mantle. Proc. 19th Lun. Planet Sci. Conf. 219–230 (1978). [Google Scholar]
- O’Neill H. S. C. The origin of the Moon and the early history of the Earth—A chemical model. . (Part 2: ): The Earth. Geochim. Cosmochim. Acta 55, 1159–1172 (1991). [Google Scholar]
- Helmy H. M., Ballhaus C., Berndt J., Bockrath C. & Wohlgemuth-Ueberwasser C. Formation of Pt, Pd and Ni tellurides: experiments in sulfide-telluride systems. Contrib. Mineral. Petrol. 153, 577–591 (2007). [Google Scholar]
- Helmy H. M., Ballhaus C., Wohlgemuth-Überwasser C., Fonseca R. & Laurenz V. Partitioning of Se, As, Sb, Te and Bi between monosulfide solid solution and sulfide melt—application to magmatic sulfide deposits. Geochim. Cosmochim. Acta 74, 6174–6179 (2010). [Google Scholar]
- Fonseca R. O. C. et al. New constraints on the genesis and long-term stability of Os-rich alloys in the Earth’s mantle. Geochim. Cosmochim. Acta 87, 227–242 (2012). [Google Scholar]
- Wohlgemuth-Ueberwasser C., Ballhaus C. & Berndt J. Synthesis of PGE sulfide standards for laser ablation inductively coupled plasma mass spectrometry (LA–ICP–MS). Contrib. Mineral. Contrib. Mineral. Petrol. 154, 607–617 (2007). [Google Scholar]
- Barin I. Thermochemical data of pure substances I+II. VCH (1995).


