Abstract
Background
A shift in glucose metabolism from oxidative phosphorylation to anaerobic glycolysis is the biochemical hallmark of malignant cancer cells.
Methods
In the present study, we demonstrated that Nodal stimulated the expression of glycolytic enzymes and decreased reliance on mitochondrial oxidative phosphorylation in human glioma cancer cells. The shift in glucose metabolism was mediated by induction of the hypoxia-inducible factor (HIF).
Results
Nodal protein expression was shown to be correlated with expression levels of glucose transporter (Glut)–1, hexokinase (HK)-II, pyruvate dehydrogenase kinase (PDK)–1, the phosphorylation level of pyruvate dehydrogenase (PDH), glucose uptake, and lactate accumulation in human glioma cells. These effects were inversely correlated with mitochondrial oxygen consumption and ATP production. Knockdown of Nodal expression with specific small hairpin RNA reduced Glut-1, HK-II, and PDK-1 expressions and PDH phosphorylation. Nodal knockdown also reduced glucose uptake and lactate generation, which in turn increased mitochondrial membrane potential (Ψ), O2 utilization, and ATP synthesis. The ectopic expression of Nodal in low-expressing Nodal glioma cells resulted in the opposite results compared with those of Nodal knockdown glioma cells. Treatment of cells with recombinant Nodal increased HIF-1 expression, and this effect was regulated at the transcriptional level. Blockage of the Nodal receptor by a pharmacological inhibitor or Nodal knockdown in U87MG cells decreased HIF-1α expression. Furthermore, HIF-1α knockdown in U87MG cells decreased Glut-1, HK-II, and PDK-1 expressions and PDH phosphorylation, which were similar to results in Nodal knockdown cells.
Conclusion
Taken together, these results suggest that Nodal affects energy metabolism through HIF-1α.
Keywords: energy metabolism, gliomas, Glut-1, HIF-1, Nodal
Human malignant glioma cells are characterized by uncontrolled growth and rapid invasion of adjacent tissues. When tumors grow into a 3-dimensional multicellular cluster, cancer cells evolve a mechanism that enhances glucose uptake and glycolysis to adapt to the microenvironment of hypoxia and low nutrients.1 These characteristics enable visualization of the tumors by [18F] fluoro-2-deoxyglucose PET, which is among the most sensitive ways to trace tumor growth.2 However, the molecular mechanism underlying the metabolic reprogramming is not completely clear.
In normal cells, ATP is generated from glucose via a glycolytic pathway and the subsequent tricarboxylic acid (TCA) cycle and mitochondrial respiratory chain. Glycolysis metabolizes glucose to pyruvate in the cytoplasm to produce a net of 2 ATP molecules from each glucose molecule. Pyruvate, the end product, can be converted to acetyl-coenzyme A (CoA) and enters the TCA cycle, which donates electrons via NADH and FADH2 to respiratory chain complexes in mitochondria. Electron transfer to oxygen creates a proton gradient across the mitochondrial inner membrane, which can be dissipated and produces 36 ATP molecules per glucose molecule. However, in the absence of oxygen, the NAD+ generated by glycolysis is regenerated from reduced NADH through the conversion of pyruvate to lactate by lactate dehydrogenase (LDH). Lactate is then used for an anabolic reaction to meet the needs of tumor cell proliferation.3 In the 1920s, Otto Warburg found that tumor cells utilize glycolysis instead of oxidative phosphorylation for glucose metabolism even in aerobic conditions, which is known as the Warburg effect.4
The discovery of hypoxia-inducible factor (HIF)–1 provided a potential link between hypoxia and gene expression patterns that control glycolysis and other metabolic changes.5 HIF-1 is a heterodimer composed of the basic helix-loop-helix proteins, HIF-1α and the aryl hydrocarbon nuclear translocator, which is also known as HIF-1β. An active HIF-1 heterodimer binds to the HIF-1 binding site within the hypoxia response element and enhances transcription of hypoxia-inducible genes involved in glucose/energy metabolism and a number of cell functions.6 HIF-1α is undetectable in normoxic conditions, while HIF-1β is found in most cells. The availability of HIF-1α is predominantly determined by stability regulation of HIF-1α through proline hydroxylation. HIF-1α is degraded under normoxic conditions by the von Hippel–Lindau protein, when the proline residues (Pro402 and Pro564) in its oxygen-dependent degradation domain are hydrolated by prolyl hydroxylase domain protein.7 In addition to hypoxia, mitochondrial generation of reactive oxygen species, including superoxide and H2O2, can also cause HIF-1 accumulation and subsequent expression of genes inducible by HIF-1 activation under normoxic conditions.6 Several recent studies revealed that oncogenic and tumor suppressor mutations may regulate glucose metabolism through increased expression of HIF-1.8 The phosphatidylinositide-3 kinase/Akt or mammalian target of rapamycin signaling pathway was shown to increase HIF-1α expression.9,10 HIF-1α regulates the shift of energy metabolism by promoting the expression of glucose transporters, glycolytic enzymes, hexokinase (HK)-II, lactate dehydrogenase A, and pyruvate dehydrogenase kinase (PDK)–1.11 PDK-1 represses the flux of pyruvate into acetyl-CoA, diverting carbon away from mitochondria and suppressing O2 consumption.12 These findings led to a promising hypothesis that the Warburg effect may be regulated by extracellular signals through activation of HIF-1 and thus to the expression of glucose metabolism-related genes under aerobic conditions.
Nodal belongs to the transforming growth factor (TGF)–β superfamily,13 and TGF-β/Sma- and Mad- related protein activity indicates a poor prognosis and promotes cell proliferation in gliomas. Inhibition of TGF-β signaling by SD208, a novel TGF-β receptor I kinase inhibitor, or SB431542, a small-molecule TGF-β receptor antagonist, leads to decreased invasiveness and proliferation of glioma cells.14 Autocrine secretion of TGF-β stimulates breast cancer energy metabolism.15 However, whether Nodal affects energy metabolism has not been investigated. Previously, we demonstrated that Nodal is involved in regulating cell proliferation, invasiveness, and differentiation in glioma cells.16 In this study, we found that the expression level of Nodal was correlated with the level of metabolism in glioma cells. Nodal appeared to regulate the metabolic pathways in glioma cells by enhancing the expressions of glucose transporter (Glut)–1 and PDK-1. Of importance, downregulation of Nodal resulted in decreased lactate accumulation. The direct link between Nodal deregulation and altered metabolism in glioma cells presented in this study strongly supports Nodal as a potential therapeutic target for treating this malignancy.
Materials and Methods
Culture of Human Glioma Cells and Western Blotting
Human GBM8401 cells were isolated from a grade IV glioma by Dr Hsin-I Ma of Tri-Service General Hospital. Human U87MG cells (American Type Culture Collection no. HTB-14) were purchased from the Institute of Food Sciences (Hsinchu, Taiwan). GBM-SKH cells were isolated from a grade IV human glioma by Dr Ching-Cheng Lee of Shin Kong Memorial Hospital. Cells were cultured in Dulbecco's modified Eagle's medium supplemented with 10% heat-inactivated fetal calf serum and maintained in a humidified incubator with 5% CO2 at 37°C. Cells were lysed by adding lysis buffer containing 10 mM Tris HCl (pH 7.5), 1 mM EGTA, 1 mM MgCl2, 1 mM sodium orthovanadate, 1 mM dithiothreitol, 0.1% mercaptoethanol, 0.5% Triton X-100, and the protease inhibitor cocktails and stored at −70°C for further measurements. Proteins were separated by sodium dodecyl sulfate–polyacrylamide gel electrophoresis. After electrophoresis, proteins were electrotransferred onto a polyvinyldifluoride (PVDF) membrane. The PVDF membrane was washed once with phosphate buffered saline (PBS) and twice with PBS plus 0.1% Tween 20 (PBST), blocked with blocking solution containing 5% nonfat dry milk in PBST for 1 h at room temperature, and blotted with primary antibodies in the blocking buffer. The PVDF membrane was incubated with peroxidase-linked anti-mouse immunoglobulin G antibodies for 1 h and then developed by an enhanced chemiluminescence plus detection kit (Amersham Life Sciences).17
Transfection of Plasmids
For Nodal knockdown, U87MG cells were seeded at a density of 5 × 10⁵ cells per 6-cm plate and allowed to adhere overnight. The next day, a vector control (pLKO.1) or Nodal-specific small hairpin (sh)RNA plasmid (shNodal) was transfected into cells using Lipofectamine. For Nodal overexpression, GBM-SKH cells were seeded at 5 × 10⁵ cells in a 6-cm plate. Transfected into cells the next day was pBabe/Nodal or the control pBabe vector. After 24 h, the medium was changed to select puromycin-resistant clones.17
Glucose Uptake Assay
Glucose uptake was measured using 2-[3H]deoxyglucose. Briefly, 5 × 10⁵ cells grown in 6-well plates were incubated in glucose-free medium for 30 min at 37°C. Added was 2-[3H]deoxyglucose at 1 μCi, incubated for 2 h. Cells were rapidly chilled at 4°C, washed 4 times, and transferred to scintillation vials for counting.
Lactate Measurements
Cells were plated, and the medium was changed to serum-free medium for 12 h. The supernatants were collected and diluted with water. Lactate production was determined using an L-lactate assay kit (BioAssay Systems). The optical density of lactate concentrations was measured at 565 nm according to the manufacturer's instructions.
Intracellular ATP Level Measurements
Cells (5 × 10⁵) were seeded and allowed to adhere overnight. The next day, the intracellular ATP levels of the cells were collected by using an ATP Lite assay kit (PerkinElmer) according to the manufacturer's instructions. ATP levels were measured by luminescence with an F-4500 fluorescence spectrophotometer (Hitachi) and normalized to the protein concentration.
Mitochondrial Membrane Potential Measurements
The integrity of the mitochondrial membrane (Ψm) was determined by the cationic dye JC-1 (JC100, Cell Technology). JC-1 dye was used to distinguish between cells with low and high mitochondrial membrane potential. The fluorescence emission will shift from green to orange-red and the dye aggregation will accumulate in the mitochondrial matrix. Cells (1 × 10⁶) were seeded and allowed to adhere overnight. The next day, cells were harvested, stained in culture medium with JC-1 dye, and incubated for 30 min at 37°C. The mean green fluorescence (FL-1 channel) and mean orange-red fluorescence (FL-2 channel) were recorded and quantified by flow cytometry (Cell Quest software; BD Biosciences).
Oxygen Consumption
To determine intact cell-coupled and -uncoupled endogenous respiration, 106 cells were resuspended in 1 mL of fresh medium prewarmed to 37°C and pregassed with 95% air and 5% CO2. The cell suspension was placed in a sealed respiration chamber equipped with a temperature control, a microstirring device, and a Clark-type oxygen electrode. Oxygen consumption in the cell suspension was measured using a Mitocell MT200 respirometer and an oxygen electrode (Warner Instruments). The oxygen content was periodically monitored with an MT200 respirometer, and the oxygen consumption rate was measured over 1 min.
Luciferase Activity Assay
Cells (5 × 10⁵) were transfected with 2 μg of plasmid hypoxia response element–luciferase (pHRE-Luc) and 0.2 μg of plasmid renilla luciferase–thymidine kinase promoter (pRL-TK; Promega) in Lipofectamine for 24 h, followed by treatments with various agents for 24 h, and then harvested for the luciferase activity assay using the Dual-Luciferase reporter assay system (Promega).
Statistical Analysis
Results are expressed as mean ± SEM from the number of independent experiments performed. One-way ANOVA was used to assess the difference in means among the groups, and Student's 2-tailed t-test was used to determine the difference of means between any 2 groups. P < .05 was taken as statistically significant. Pearson's correlation coefficient was used to determine the correlation between the protein level of Nodal and metabolic phenotype in glioma cell lines.
Results
Nodal Expression in Human Glioma Cell Lines Was Correlated With Expression Levels of Glut and Hexokinase and the Extent of Glucose Uptake and Lactate Accumulation
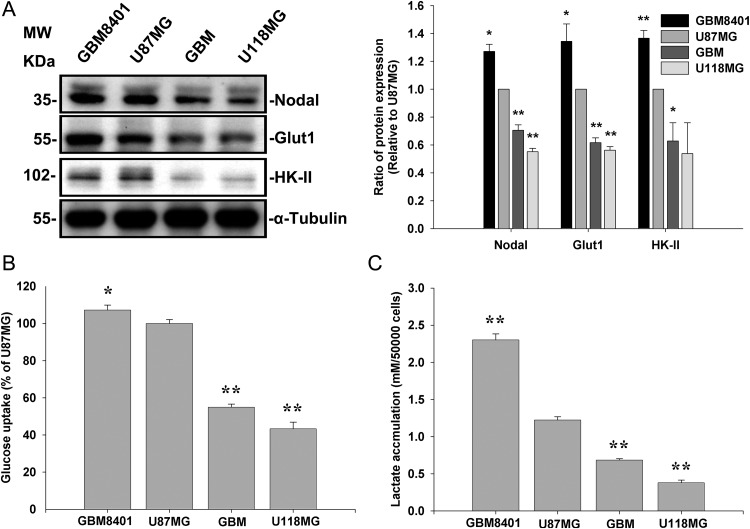
To determine whether Nodal involved glucose uptake and glycolysis, we compared expression levels of Nodal in U87MG and U118MG cells, along with 2 other cell lines derived from human grade IV gliomas (GBM-SKH and GBM8401). Nodal protein levels were higher in U87MG and GBM8401 cells compared with GBM-SKH and U118MG cells. The expression level of Nodal paralleled those of Glut-1 and HK-II (Fig. 1A). In agreement, the extent of 2-[3H]deoxyglucose uptake (Fig. 1B) and of lactate accumulation (Fig. 1C) paralleled expression levels of Nodal.
Fig. 1.
Nodal expression in human glioma cell lines correlated with expression levels of Glut and HK and the extent of glucose uptake and lactate accumulation. (A) Nodal expression determined by Western blotting was related to Glut-1 and HK-II expressions in human glioma cell lines. α-Tubulin served as an equal loading control. (B) Cells (5 × 10⁵) grown in 6-well plates were incubated with [3H]2-deoxyglucose and measured by liquid scintillation counting. (C) Lactate accumulation was detected in serum-free medium 12 h after seeding 5 × 10⁴ cells. Data represent the mean ± SEM of 3 independent experiments. *P < .05 and **P < .01, by Student's t-test.
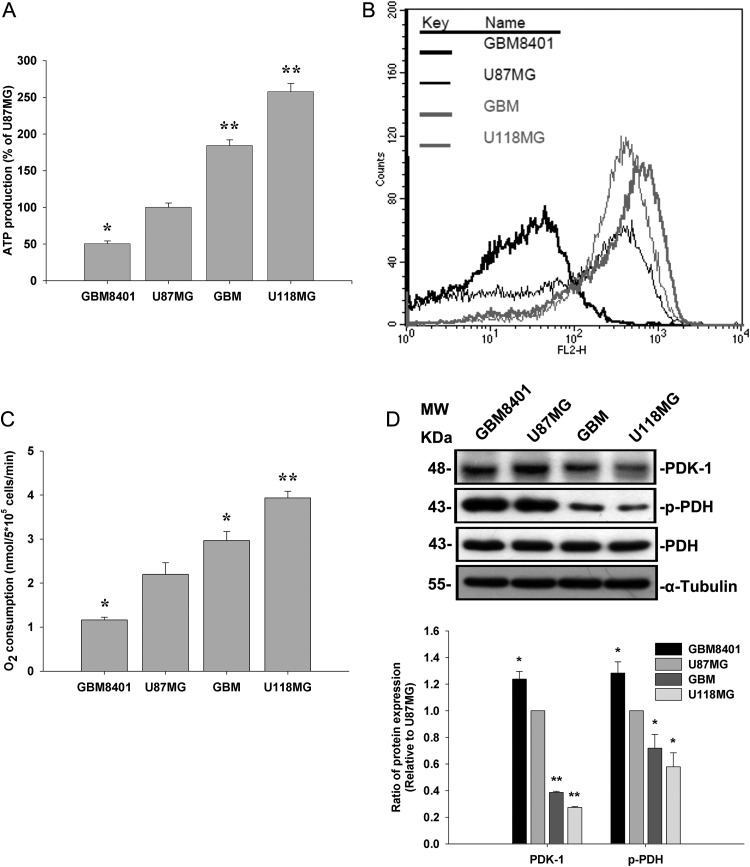
We further investigated whether Nodal expression was correlated with ATP production, mitochondrial membrane potential, and O2 consumption in these human glioma cells. Our results showed that ATP production, mitochondrial membrane potential, and O2 consumption were low in GBM8401 and U87MG cells and high in GBM-SKH and U118MG cells (Fig. 2A–C). PDK-1 was previously shown to repress the flux of pyruvate into acetyl-CoA, diverting energy metabolism away from mitochondria and suppressing O2 consumption.12 We next examined whether expression levels of PDK-1 and phosphorylation levels of pyruvate dehydrogenase (PDH) paralleled expression levels of Nodal. Consistently, phosphorylation levels of U87MG and GBM8401 cells were also higher than those of GBM-SKH and U118MG cells (Fig. 2D). In addition, the correlations of Nodal expression with the levels of Glut-1 expression, glucose uptake, lactate accumulation, ATP generation, and O2 consumption were determined (Table 1). The results showed that Nodal expression was highly correlated with these indicators of energy metabolism, indicating that Nodal may regulate cellular glucose flux and the subsequent energy metabolism.
Fig. 2.
ATP generation, mitochondrial membrane potential, and O2 utilization were compared with the expression level of PDK-1 and the phosphorylation level of PDH-α in human glioma cell lines. (A) The cellular ATP content was assayed by the luciferin/luciferase method on a Turner Designs 20/20 luminometer at 24°C. (B) Cells were cultured for 24 h, and mitochondrial membrane potential was measured by analysis of JC-1 fluorescence using flow cytometry. (C) Analysis of cellular oxygen consumption in the media was detected by a Clark-type O2 electrode at 37°C. (D) Cell lysates from human glioma cell lines were used to determine PDK-1 expression and PDH-α phosphorylation by Western blotting. α-Tubulin served as an equal loading control. Data represent mean ± SEM of 3 independent experiments. *P < .05 and **P < .01 by Student's t-test.
Table 1.
Pearson's correlation coefficients between Nodal protein, Glut-1 protein, glucose uptake, lactate accumulation, ATP generation, and O2 consumption
| Nodal | Glut-1 | Glucose Uptake | Lactate Accumulation | ATP Generation | O2 Consumption | |
|---|---|---|---|---|---|---|
| Nodal | 1.000 | |||||
| Glut-1 | 0.993** | 1.000 | ||||
| Glucose uptake | 0.951** | 0.952** | 1.000 | |||
| Lactate accumulation | 0.989 | 0.984 | 0.897** | 1.000 | ||
| ATP generation | −0.974 | −0.951 | −0.973 | −0.936 | 1.000 | |
| O2 consumption | −0.986 | −0.960 | −0.940 | −0.968 | 0.989* | 1.000 |
*P<.05 and **P<.01 by Student's t-test.
Recombinant Nodal Increased Glut-1, HK-II, and PDK-1 Expressions and Regulated Glucose Uptake and Energy Metabolism in Glioma Cell Lines
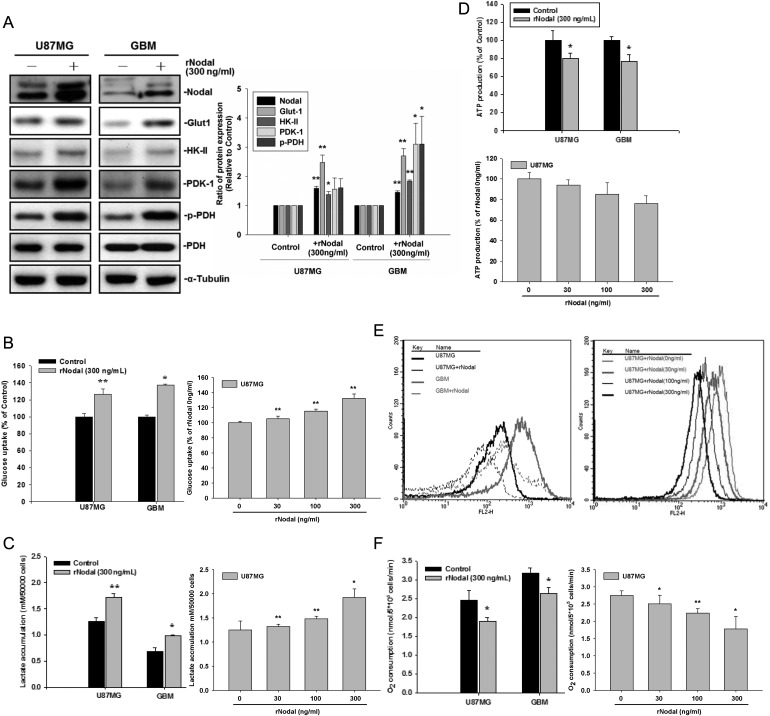
Nodal is a secreted protein and exerts its function on cell-surface receptors. To determine whether exogenously added Nodal could regulate glucose uptake and energy metabolism, we first found that treatment with recombinant Nodal (rNodal; 300 ng/mL) increased Glut-1, HK-II, and PDK-1 expression in U87MG and GBM-SKH cells (Fig. 3A). In agreement, upregulation of PDK-1 was associated with increased PDH phosphorylation. The addition of rNodal significantly increased 2-[3H]deoxyglucose uptake (Fig. 3B) and lactate accumulation (Fig. 3C). We next examined whether rNodal regulated ATP production, mitochondrial membrane potential, and O2 consumption in these human glioma cells. As shown in Fig. 3D–F, rNodal slightly decreased ATP production, mitochondrial membrane potential, and O2 consumption. In Fig. 3B–F, rNodal was also shown to affect glucose uptake, lactate accumulation, ATP production, mitochondrial membrane potential, and O2 consumption in a dose-dependent manner in U87MG cells. Taken together, these data suggest that Nodal regulates glucose uptake and energy metabolism.
Fig. 3.
Treatment with recombinant Nodal (rNodal) enhanced glucose uptake and suppressed mitochondrial respiration. (A) U87MG and GBM-SKH cells were separately treated with 300 ng/mL of rNodal for 24 h, and cell lysates from human glioma cell lines were used to determine the expression levels of Nodal, Glut-1, HK-II, and PDK-1 and PDH-α phosphorylation by Western blotting. α-Tubulin served as an equal loading control. (B) Glucose uptake, (C) cellular lactate accumulation, (D) ATP production, (E) mitochondrial membrane potential (ΔΨM), and (F) O2 consumption were analyzed. Data represent mean ± SEM of 3 independent experiments. *P < .05 and **P < .01 by Student's t-test.
Ectopic Expression of Nodal Mimicked the Effects of rNodal Treatment in GBM-SKH Cells
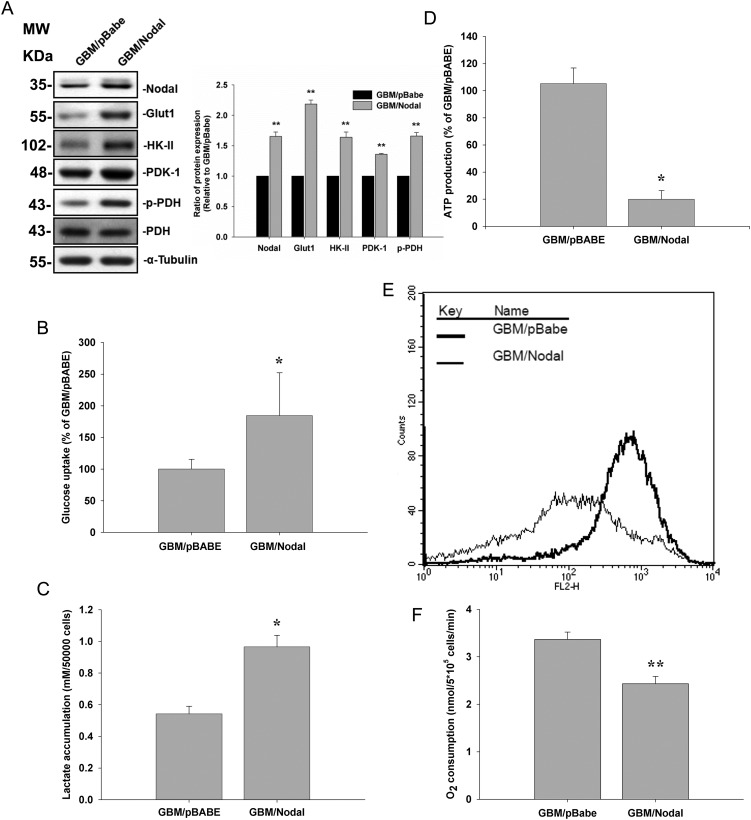
To further confirm the role of Nodal in energy metabolism, Nodal was stably expressed in less invasive GBM-SKH cells. Ectopic expression of Nodal increased Nodal protein levels in GBM-SKH cells (Fig. 4A). Similarly, overexpression of Nodal was associated with increased Glut-1, HK-II, and PDK-1 protein levels, which paralleled the increase in PDH phosphorylation (Fig. 4A). Overexpression of Nodal in GBM-SKH cells also increased 2-[3H]deoxyglucose uptake (Fig. 4B) and lactate accumulation (Fig. 4C). Consistent with rNodal treatment, overexpression of Nodal in GBM-SKH cells decreased ATP production, mitochondrial membrane potential, and O2 consumption (Fig. 4D–F).
Fig. 4.
Ectopic Nodal expression in GBM-SKH cells increased glucose uptake and suppressed mitochondrial respiration. GBM-SKH cells were transfected with a control vector (pBabe) or Nodal (pBabe/Nodal). (A) Protein expression levels of Nodal, Glut-1, HK-II, and PDK-1 and PDH-α phosphorylation in both cells were determined by Western blotting. α-Tubulin served as an equal loading control. (B) Glucose uptake, (C) cellular lactate accumulation, (D) ATP production, (E) mitochondrial membrane potential (ΔΨM), and (F) O2 consumption were analyzed. Data represent mean ± SEM of 3 independent experiments. *P < .05 and **P < .01 by Student's t-test.
Nodal Knockdown Decreased Glucose Uptake While Increasing Mitochondrial Membrane Potential in U87MG Cells
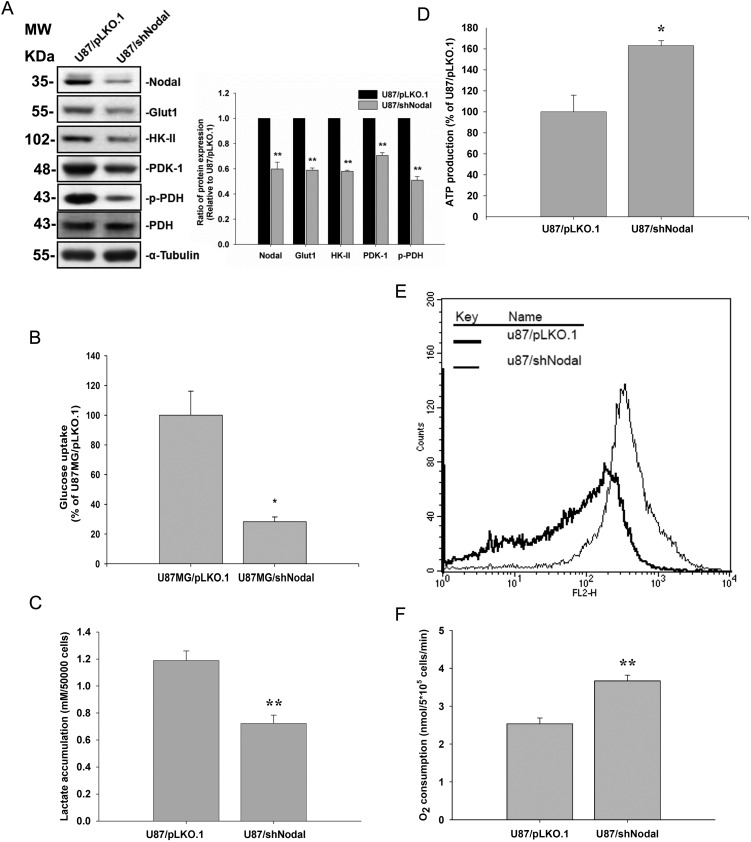
For further exploration, shRNA specific for Nodal was used to knock down Nodal expression in the more invasive U87MG cell line that expressed higher Nodal levels. Transfection of Nodal-specific shRNA suppressed Nodal protein expression in U87MG cells (Fig. 5A). Knockdown of Nodal was accompanied by reductions in Glut-1, HK-II, and PDK-1 protein levels in U87MG cells. Again, suppression of PDK-1 expression paralleled the phosphorylation level of PDH (Fig. 5A). Knockdown of Nodal resulted in decreases in cell 2-[3H]deoxyglucose uptake (Fig. 5B) and lactate accumulation (Fig. 5C). As shown in Fig. 5D, ATP production, mitochondrial membrane potential, and O2 consumption were all higher in Nodal knockdown cells compared with parental cells. Taken together, these data suggest that knockdown of Nodal modulates glucose uptake and energy metabolism (Fig. 5D–F).
Fig. 5.
Nodal knockdown lowered glucose uptake, and enhanced mitochondrial respiration. U87MG cells were stably transfected with the control vector (pLKO.1) and Nodal-specific shRNA (shNodal). (A) The protein expression levels of Nodal, HK-II, Glut-1, and PDK-1 and PDH-α phosphorylation in both cells were determined by Western blotting. α-Tubulin served as an equal loading control. (B) Glucose uptake, (C) cellular lactate accumulation, (D) ATP production, (E) mitochondrial membrane potential (ΔΨM), and (F) O2 consumption were analyzed. Data represent mean ± SEM of 3 independent experiments. *P < .05 and **P < .01 by Student' t-test.
Blockage of the Nodal Receptor by a Pharmacological Inhibitor or Nodal Knockdown in U87MG Cells Decreased HIF-1α Expression
Several oncogenic and growth factors activate glycolytic flux and dysregulate mitochondrial energy metabolism through HIF-1α. To investigate whether Nodal causes HIF-1α accumulation, U87MG cells were treated with rNodal, and protein levels of HIF-1α were examined.
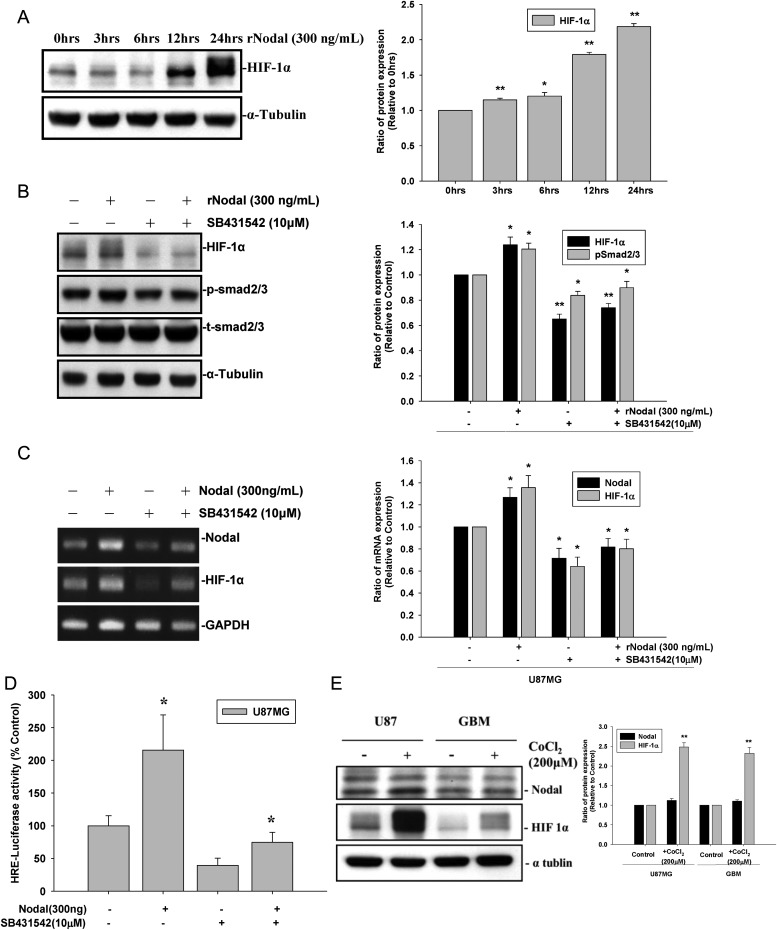
As shown in Fig. 6A–C, treatment with rNodal increased the messenger RNA and protein levels of HIF-1α in U87MG cells. In contrast, pretreatment with the Nodal receptor antagonist, SB431542, decreased Nodal-induced HIF-1α accumulation in the more invasive U87MG cells. Under hypoxic conditions, HIF-1α degradation was prevented by inactivation of prolyl hydroxylase. However, based on the time course study and real-time PCR data, Nodal may regulate HIF-1α expression at the transcriptional level. We next examined whether Nodal increased HIF-1α gene transcription by a reporter gene assay. As shown in Fig. 6D, Nodal increased the transcription of HIF-1α in U87MG cells. Furthermore, to investigate whether Nodal expression under hypoxia was associated with HIF-1α expression, U87MG and GBM cells were treated with the hypoxia minetic agent CoCl2 (200 μM). As shown in Fig. 6E, Nodal expression in both cell lines remained unchanged under hypoxic conditions compared with the normoxic condition (P > .05). On the contrary, HIF-1α expression was significantly increased by ∼2.4-fold under hypoxic conditions compared with the normoxic condition (P < .01), indicating that overexpression of HIF-1α under hypoxic conditions is not associated with Nodal expression. These data suggest that Nodal increases HIF-1α accumulation at the transcriptional level rather than stabilizing HIF-1α by inactivating prolyl hydroxylase, as seen under hypoxic conditions.
Fig. 6.
Nodal regulates HIF-1α expression through the TGF-β signaling pathway. U87MG cells were treated with recombinant Nodal (300 ng/mL) for different time periods, and (A) HIF-1α protein expression was determined by a Western blot analysis. U87MG cells were treated with SB431542 (10 μM) for 30 min prior to the addition of recombinant Nodal (300 ng/mL) for 24 h; (B) cell lysates were analyzed for HIF-1α expression and Sma- and Mad–related protein 2/3 phosphorylation by a Western blot analysis. (C) RNA was isolated and reverse-transcribed, and HIF-1α mRNA expression was analyzed by real-time PCR. (D) U87G cells were transfected with the control vector (pRL-TK) or a reporter gene (HRE/pRL-TK), and HRE-luciferase activity was assayed in 5 × 10⁵ cells. (E) U87MG and GBM-SKH cells were exposed to the hypoxia mimetic agent CoCl2 (200 μM) for 24 h, and Nodal and HIF-1α protein expression was determined by a Western blot analysis. Data represent mean ± SEM of 3 independent experiments. *P < .05 by Student' t-test.
Knockdown of HIF-1α Decreased Glut-1, HK-II, and PDK-1 Expression and PDH Phosphorylation in U87MG Cells
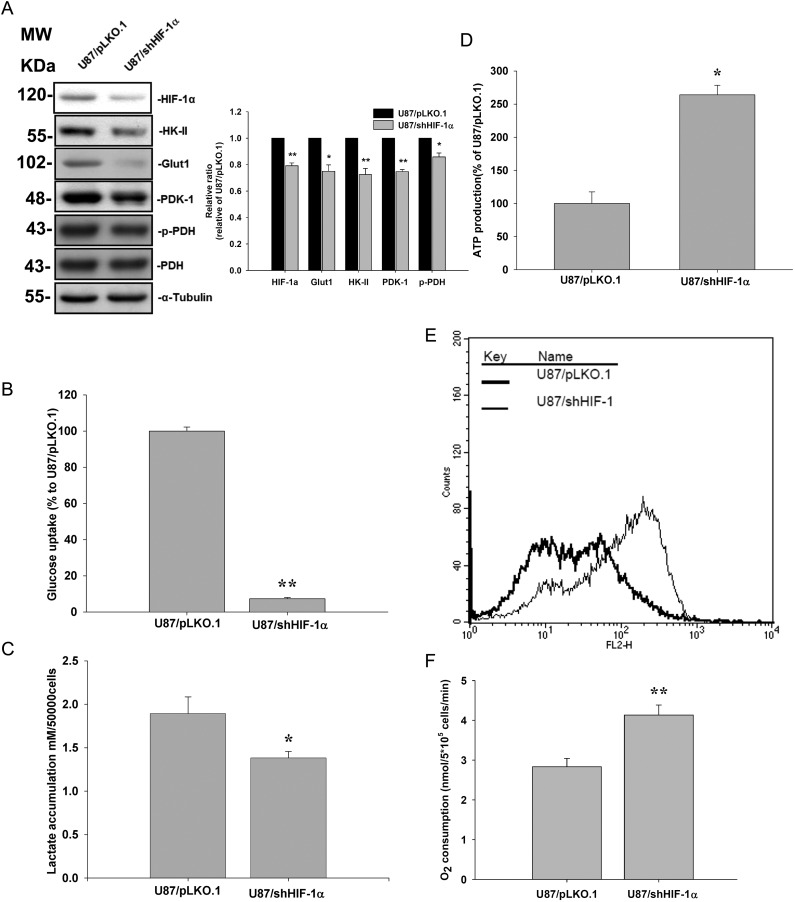
To explore the possibility that HIF-1α affects Nodal's role in energy metabolism, shRNA specific for HIF-1α was used to knock down HIF-1α expression in the more invasive U87MG cells. Transfection of HIF-1α–specific shRNA decreased HIF-1α protein expression in U87MG cells (Fig. 7A). Knockdown of HIF-1α was accompanied by reductions in Glut-1 and PDK-1 protein levels (Fig. 7A). Reduction of PDK-1 expression paralleled phosphorylation levels of PDH (Fig. 7A). Knockdown of HIF-1α resulted in decreased cell 2-[3H]deoxyglucose uptake (Fig. 7B) and lactate accumulation (Fig. 7C). In agreement, ATP production, mitochondrial membrane potential, and O2 consumption were all higher in HIF-1α knockdown cells compared with parental cells. These results indicate that HIF-1α mediates Nodal-stimulated regulation of glucose uptake and energy metabolism in glioma cells (Fig. 7D–F).
Fig. 7.
HIF-1α regulates cell metabolism and mitochondrial membrane potential. U87MG cells were stably transfected with the control vector (pLKO.1) or HIF-1α specific shRNA (shHIF-1α). (A) HIF-1α, Glut-1, HK-II, and PDK-1 protein levels and phosphorylation of PDH-α were determined by a Western blot analysis. (B) Glucose uptake, (C) lactate production, (D) ATP production, (E) mitochondrial membrane potential (ΔΨM), and (F) O2 consumption were analyzed. Data represent mean ± SEM of 3 independent experiments. *P < .05 and **P < .01 by Student's t-test.
Discussion
Most invasive cancer cells show higher glucose uptake and lower O2 consumption and mitochondrial energy metabolism compared with their cells of origin.18 We previously found that Nodal, a member of the TGF-β family, plays important roles in regulating cell proliferation, invasiveness, and differentiation in gliomas.16 However, the role of Nodal in energy metabolism has not been investigated. In the present study, we demonstrated that Nodal regulated the expression of Glut-1 and the key regulator of mitochondrial energy metabolism, PDK-1. We present evidence that treatment of cells with rNodal or overexpression of Nodal increased Glut-1 and PDK-1 expression. Increased PDK-1 in turn increased PDH phosphorylation and decreased PDH's activity in acetyl-CoA production. In contrast, Nodal knockdown decreased glucose transport and lactate accumulation and increased O2 consumption and mitochondrial energy metabolism. Although many oncogenic signaling pathways were shown to modulate energy metabolism via upregulation of Glut-1 and PDK-1, this was the first demonstration that an external ligand could regulate glucose uptake and mitochondrial energy metabolism in cancer cells. Understanding the molecular mechanisms of metabolic adaptation may provide significant molecular insights into the invasive nature of gliomas, which would be helpful in developing tactics to exploit glioma therapy.
The present study extends our previous finding that Nodal expression paralleled Glut-1 expression levels and that highly invasive glioma cells (U87MG and GBM8401) expressed higher level of Glut-1 compared with the less invasive GBM-SKH and U118MG cells. Glut-1 is overexpressed in many highly proliferative and malignant tumors.19–21 Our data are in line with those reported by many groups that a high expression level of Glut-1 can be considered an indicator of a poor prognosis.
Under hypoxic conditions, HIF-1α was shown to induce overexpression of Glut and regulate mitochondrial function in cancer cells. We showed that Nodal regulated HIF-1α expression at the transcriptional level under normoxic conditions. We further demonstrated that HIF-1α mediated the effects of Nodal on glycolytic flux and mitochondrial energy metabolism. These results are consistent with reports that HIF-1α regulates mitochondrial energy metabolism via induction of PDK-1. We demonstrated that the PDH kinase, PDK-1, was upregulated by Nodal in an HIF-1α–dependent manner. PDK-1 phosphorylates and decreases the activity of the PDH complex. Thus, PDK-1 can be considered a major regulator in the inactivation of the PDH complex, which decreases pyruvate oxidation through the TCA cycle, O2 consumption, and generation of the mitochondrial membrane potential. Our data showed that treatment of cells with rNodal and the ectopic expression of Nodal increased PDK-1 expression. However, ATP production, mitochondrial membrane potential generation, and O2 consumption only slightly decreased. This could be due to the fact that tumor mitochondria are able to oxidize alternative energy substrates independent of PDH complex activity.
In conclusion, these results suggest that expression levels of Nodal are tightly associated with alterations of glucose uptake and mitochondrial energy metabolism and support the notion that the Nodal/HIF-1α/Glut-1 signaling pathway can be considered a diagnostic marker for glioma progression.16,22 In addition, we demonstrated that both the inhibition of Nodal signaling and the knockdown of HIF-1α reduced glucose uptake and lactate accumulation in malignant U87MG glioma cells. Recently, an increase in lactate accumulation was shown to fuel tumor growth and metastasis,23 and these results support the notion that inhibition of Nodal signaling can be considered a novel therapeutic strategy for glioma treatment.
Funding
H.M.L. and his laboratory were supported by grants from the National Science Council of Taiwan (NSC99-3112-B-166-001). The costs of publication of this article were defrayed in part by payment of page charges.
Acknowledgments
We thank Shu-Ting Tsai and Yu-Lin Chen for secretarial assistance.
Conflict of interest statement. None declared.
References
- 1.Mathupala SP, Ko YH, Pedersen PL, Hexokinase II. Cancer's double-edged sword acting as both facilitator and gatekeeper of malignancy when bound to mitochondria. Oncogene. 2006;25(34):4777–4786. doi: 10.1038/sj.onc.1209603. [DOI] [PMC free article] [PubMed] [Google Scholar]
- 2.Muzi M, Freeman SD, Burrows RC, et al. Kinetic characterization of hexokinase isoenzymes from glioma cells: implications for FDG imaging of human brain tumors. Nucl Med Biol. 2001;28(2):107–116. doi: 10.1016/s0969-8051(00)00201-8. [DOI] [PubMed] [Google Scholar]
- 3.Vander Heiden MG, Cantley LC, Thompson CB. Understanding the Warburg effect: the metabolic requirements of cell proliferation. Science. 2009;324(5930):1029–1033. doi: 10.1126/science.1160809. [DOI] [PMC free article] [PubMed] [Google Scholar]
- 4.Warburg O. On the origin of cancer cells. Science. 1956;123(3191):309–314. doi: 10.1126/science.123.3191.309. [DOI] [PubMed] [Google Scholar]
- 5.Papandreou I, Cairns RA, Fontana L, Lim AL, Denko NC. HIF-1 mediates adaptation to hypoxia by actively downregulating mitochondrial oxygen consumption. Cell Metab. 2006;3(3):187–197. doi: 10.1016/j.cmet.2006.01.012. [DOI] [PubMed] [Google Scholar]
- 6.Majmundar AJ, Wong WJ, Simon MC. Hypoxia-inducible factors and the response to hypoxic stress. Mol Cell. 2010;40(2):294–309. doi: 10.1016/j.molcel.2010.09.022. [DOI] [PMC free article] [PubMed] [Google Scholar]
- 7.Jaakkola P, Mole DR, Tian YM, et al. Targeting of HIF-alpha to the von Hippel-Lindau ubiquitylation complex by O2-regulated prolyl hydroxylation. Science. 2001;292(5516):468–472. doi: 10.1126/science.1059796. [DOI] [PubMed] [Google Scholar]
- 8.Levine AJ, Puzio-Kuter AM. The control of the metabolic switch in cancers by oncogenes and tumor suppressor genes. Science. 2010;330(6009):1340–1344. doi: 10.1126/science.1193494. [DOI] [PubMed] [Google Scholar]
- 9.Mottet D, Dumont V, Deccache Y, et al. Regulation of hypoxia-inducible factor-1alpha protein level during hypoxic conditions by the phosphatidylinositol 3-kinase/Akt/glycogen synthase kinase 3beta pathway in HepG2 cells. J Biol Chem. 2003;278(33):31277–31285. doi: 10.1074/jbc.M300763200. [DOI] [PubMed] [Google Scholar]
- 10.Brugarolas J, Kaelin WG. Dysregulation of HIF and VEGF is a unifying feature of the familial hamartoma syndromes. Cancer Cell. 2004;6(1):7–10. doi: 10.1016/j.ccr.2004.06.020. [DOI] [PubMed] [Google Scholar]
- 11.Gordan JD, Thompson CB, Simon MC. HIF and c-Myc: sibling rivals for control of cancer cell metabolism and proliferation. Cancer Cell. 2007;12(2):108–113. doi: 10.1016/j.ccr.2007.07.006. [DOI] [PMC free article] [PubMed] [Google Scholar]
- 12.Simon MC. Mitochondrial reactive oxygen species are required for hypoxic HIF alpha stabilization. Adv Exp Med Biol. 2006;588:165–170. doi: 10.1007/978-0-387-34817-9_15. [DOI] [PubMed] [Google Scholar]
- 13.Watabe T, Miyazono K. Roles of TGF-beta family signaling in stem cell renewal and differentiation. Cell Res. 2009;19(1):103–115. doi: 10.1038/cr.2008.323. [DOI] [PubMed] [Google Scholar]
- 14.Hjelmeland MD, Hjelmeland AB, Sathornsumetee S, et al. SB-431542, a small molecule transforming growth factor-beta-receptor antagonist, inhibits human glioma cell line proliferation and motility. Mol Cancer Ther. 2004;3(6):737–745. [PubMed] [Google Scholar]
- 15.Guido C, Whitaker-Menezes D, Capparelli C, et al. Metabolic reprogramming of cancer-associated fibroblasts by TGF-beta drives tumor growth: connecting TGF-beta signaling with ‘Warburg-like’ cancer metabolism and L-lactate production. Cell Cycle. 2012;11(16):3019–3035. doi: 10.4161/cc.21384. [DOI] [PMC free article] [PubMed] [Google Scholar]
- 16.Lee CC, Jan HJ, Lai JH, et al. Nodal promotes growth and invasion in human gliomas. Oncogene. 2010;29(21):3110–3123. doi: 10.1038/onc.2010.55. [DOI] [PubMed] [Google Scholar]
- 17.Jan HJ, Lee CC, Shih YL, et al. Osteopontin regulates human glioma cell invasiveness and tumor growth in mice. Neuro Oncol. 2010;12(1):58–70. doi: 10.1093/neuonc/nop013. [DOI] [PMC free article] [PubMed] [Google Scholar]
- 18.DeBerardinis RJ, Lum JJ, Hatzivassiliou G, Thompson CB. The biology of cancer: metabolic reprogramming fuels cell growth and proliferation. Cell Metab. 2008;7(1):11–20. doi: 10.1016/j.cmet.2007.10.002. [DOI] [PubMed] [Google Scholar]
- 19.Altenberg B, Greulich KO. Genes of glycolysis are ubiquitously overexpressed in 24 cancer classes. Genomics. 2004;84(6):1014–1020. doi: 10.1016/j.ygeno.2004.08.010. [DOI] [PubMed] [Google Scholar]
- 20.Macheda ML, Rogers S, Best JD. Molecular and cellular regulation of glucose transporter (GLUT) proteins in cancer. J Cell Physiol. 2005;202(3):654–662. doi: 10.1002/jcp.20166. [DOI] [PubMed] [Google Scholar]
- 21.Amann T, Hellerbrand C. GLUT1 as a therapeutic target in hepatocellular carcinoma. Expert Opin Ther Tar. 2009;13(12):1411–1427. doi: 10.1517/14728220903307509. [DOI] [PubMed] [Google Scholar]
- 22.Strizzi L, Hardy KM, Margaryan NV, et al. Potential for the embryonic morphogen Nodal as a prognostic and predictive biomarker in breast cancer. Breast Cancer Res. 2012;14(3):R75. doi: 10.1186/bcr3185. [DOI] [PMC free article] [PubMed] [Google Scholar]
- 23.Martinez-Outschoorn UE, Prisco M, Ertel A, et al. Ketones and lactate increase cancer cell “stemness,” driving recurrence, metastasis and poor clinical outcome in breast cancer: achieving personalized medicine via metabolo-genomics. Cell Cycle. 2011;10(8):1271–1286. doi: 10.4161/cc.10.8.15330. [DOI] [PMC free article] [PubMed] [Google Scholar]


