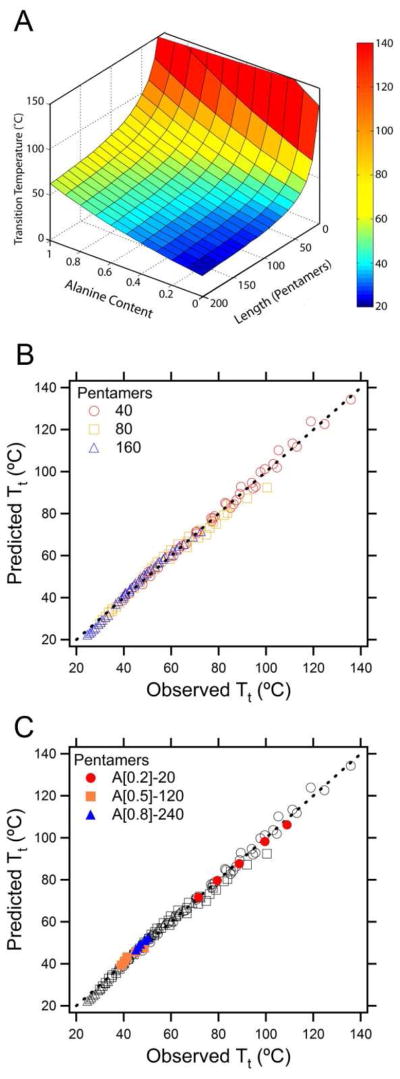
Figure 2.

A) A 3-dimensional plot of the predicted Tt landscape for the Ala and Val superfamily of ELPs at 25 μM in PBS. B) Predicted versus observed Tt for a global fit of eight ELP sequences across 3 molecular weights and 5 concentrations in PBS (r2=0.993; n=120). C) Predicted versus observed Tt for 3 additional sequences (A[0.2]-20, A[0.5]-140, and A[0.8]-240) not included in the original data set. These three ELPs showed a high fidelity to the model (r2=0.999, slope = 0.95).
